. 2018 Sep 11;8(1):13629.
doi: 10.1038/s41598-018-31996-0.

Matched Short-Term Depression and Recovery Encodes Interspike Interval at a Central Synapse

Affiliations

Matched Short-Term Depression and Recovery Encodes Interspike Interval at a Central Synapse

Armando E Castillo et al. Sci Rep. .

Abstract

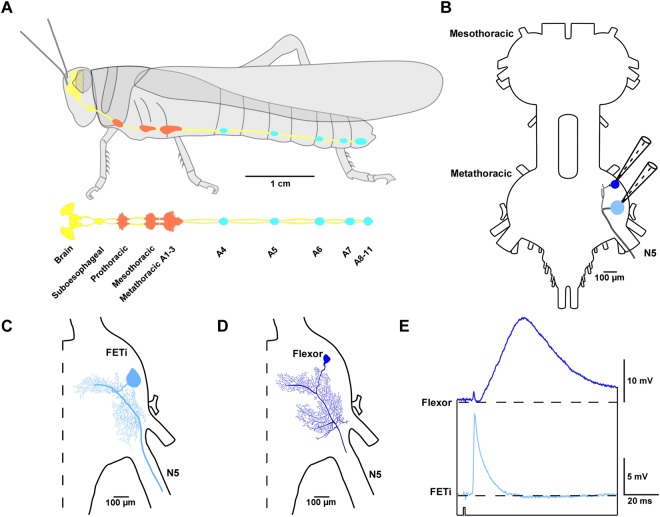
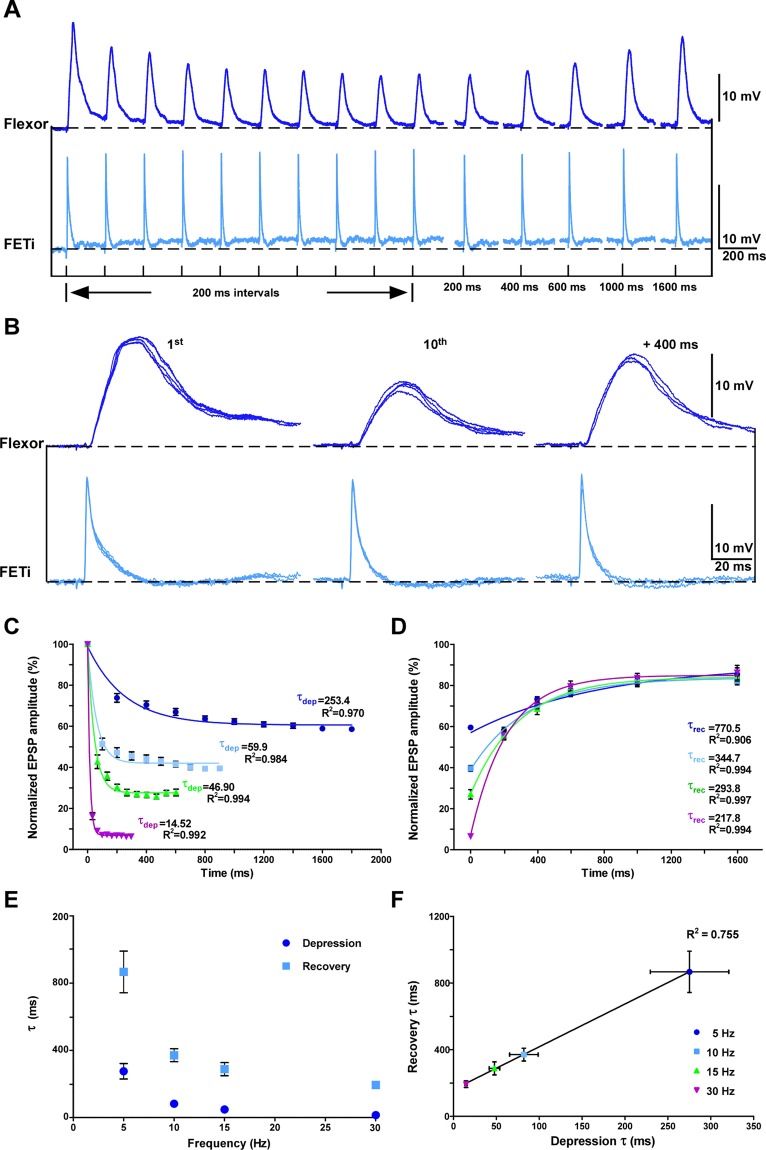
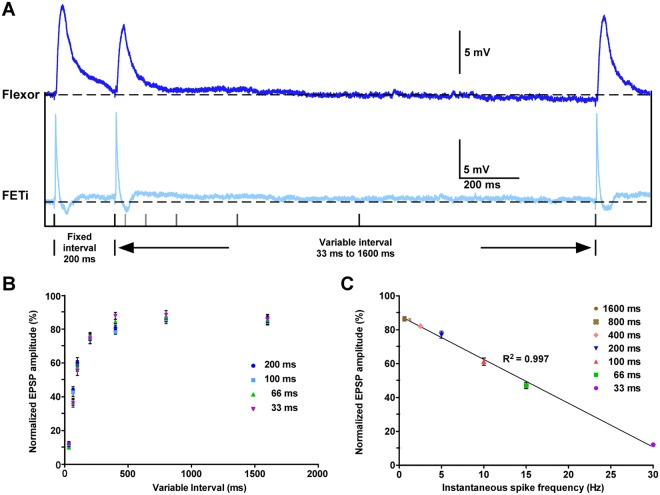
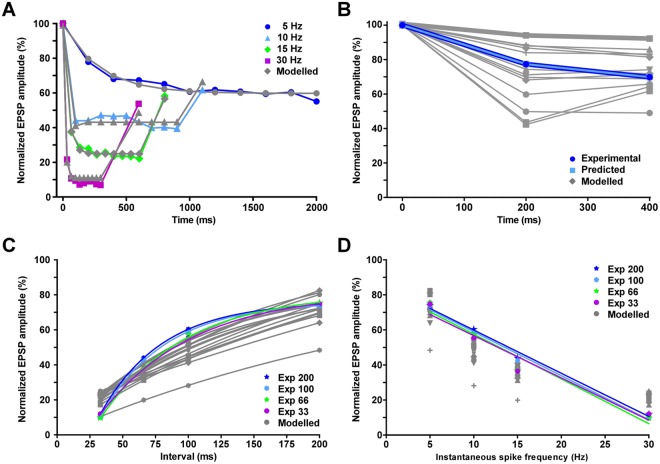
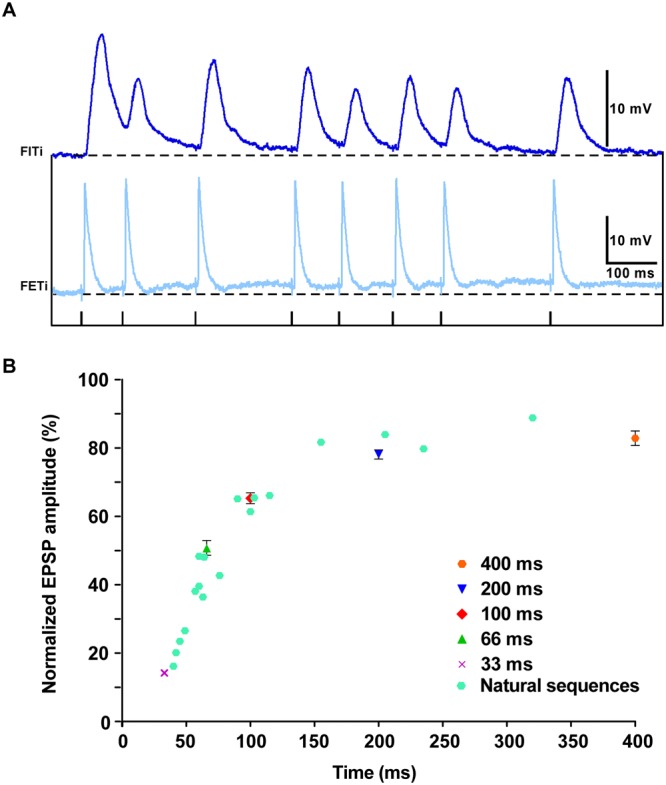
Reversible decreases in synaptic strength, known as short-term depression (STD), are widespread in neural circuits. Various computational roles have been attributed to STD but these tend to focus upon the initial depression rather than the subsequent recovery. We studied the role of STD and recovery at an excitatory synapse between the fast extensor tibiae (FETi) and flexor tibiae (flexor) motor neurons in the desert locust (Schistocerca gregaria) by making paired intracellular recordings in vivo. Over behaviorally relevant pre-synaptic spike frequencies, we found that this synapse undergoes matched frequency-dependent STD and recovery; higher frequency spikes that evoke stronger, faster STD also produce stronger, faster recovery. The precise matching of depression and recovery time constants at this synapse ensures that flexor excitatory post-synaptic potential (EPSP) amplitude encodes the presynaptic FETi interspike interval (ISI). Computational modelling shows that this precise matching enables the FETi-flexor synapse to linearly encode the ISI in the EPSP amplitude, a coding strategy that may be widespread in neural circuits.


Conflict of interest statement

The authors declare no competing interests.

Figures

Figure 1
Figure 1
A synaptic connection exists between the fast extensor tibia (FETi) and flexor motor neurons in the desert locust. (A) A schematic diagram of the lateral view of the desert locust and central nervous system (CNS) (above). A dorsal view of the CNS is also shown (below). The brain and connectives are shown in yellow, thoracic ganglia in red and abdominal ganglia in blue. (B) An outline of the meso- and metathoracic ganglia showing the FETi and flexor recording sites in the metathoracic ganglion. (C) The central morphology of FETi showing the soma, dendrites, primary neurite and the axon exiting the ganglion through nerve 5 (N5). (D) The central morphology of a fast flexor. (E) An antidromic spike in FETi (pale blue) evokes an EPSP in a fast flexor (dark blue). The black dashed line indicates the resting potential of each neuron. The lower black line indicates the timing of the electrical stimulus that triggers the antidromic spike in FETi.
Figure 2
Figure 2
Matched frequency dependent short-term depression (STD) and recovery at the FETi-flexor synapse. (A) A paired intracellular recording of FETi (pale blue) and a flexor (dark blue). A train of 10 antidromic FETi spikes at 5 Hz cause STD in the flexor EPSP amplitude. The recovery is assessed with single antidromic spikes at intervals between 200 and 1600 ms. The stimuli evoking the antidromic spikes are shown below. (B) Overlays of 5 FETi spikes and the corresponding flexor EPSPs at different points during STD and recovery show the low inter trial variability of the EPSP amplitude. (C) The mean normalized amplitudes of flexor EPSPs evoked by trains of 10 antidromic FETi spikes at between 5 and 30 Hz. Data for each frequency are fitted with a single exponential. Data were obtained with 10 repeats of each stimulus in 16 animals. Error bars show the standard error of the mean (SEM). (D) The normalized mean amplitudes of flexor EPSPs evoked by single FETi spikes to assess recovery from 200 to 1600 ms. The recovery after trains of 10 antidromic FETi spikes at between 5 and 30 Hz is shown. Data for each frequency are fitted with a single exponential. Data were obtained with 2 repeats of each stimulus in 13 animals. (E) STD and recovery time constants as a function of the stimulation frequency. The time constants of the exponentials fitted to the STD and recovery are frequency dependent, decreasing as the spike frequency increases. Error bars show the SEM. (F) Recovery time constant versus depression time constant. The time constants of the exponentials fitted to the STD and recovery are matched to one another producing a linear relationship (Slope = 2.77, Y-intersect = 151.0). Error bars show the standard error of the mean (SEM).
Figure 3
Figure 3
The FETi-flexor EPSP amplitude encodes interspike interval. (A) Intracellular traces showing flexor (dark blue) EPSPs evoked by triplets of FETi (pale blue) antidromic spikes. The stimulation protocol is shown below. (B) The normalized flexor EPSP amplitudes at each of the different variable intervals from the stimulation protocol shown in A. Four different fixed intervals were used 33, 66, 100 and 200 ms. The normalized EPSPs amplitude is the same irrespective of the duration of the fixed interval. Data were obtained with 3 repeats of each stimulus in 8 animals. (C) Mean normalized EPSP amplitudes at different variable intervals grouped by the instantaneous spike frequency (ISF). Flexor EPSP amplitude is related to FETi ISF, decreasing linearly as the ISF increases (slope = −2.59, Y intersect = 88.39). Data were obtained with 3 repeats of each stimulus in 8 animals.
Figure 4
Figure 4
Computational modelling of the FETi-flexor synapse demonstrates the importance of matching the frequency-dependent time constants of depression and recovery. (A) The fits of the computational model to trains of spikes causing STD in flexor EPSP amplitude. EPSPs evoked by spikes at different frequencies were fitted independently (see Supplemental Experimental Procedures). The computational model fits both the STD and recovery. Model parameter at 5 Hz, U = 0.64; A = 153.68; τrec = 566 ms. At 10 Hz, U = 1.02; A = 96.74; τrec = 166 ms. At 15 Hz, U = 0.86; A = 115.81; τrec = 290 ms and at 30 Hz, U = 0.91; A = 110.74; τrec = 322 ms. (B) The computational model fits experimental flexor EPSP amplitudes evoked by spike triplets. Flexor EPSP amplitudes are shown for a single 200/200 ms interval combination. Replacing the recovery time constant for this 200/200 ms (fixed/variable) interval combination with time constants obtained from fits of other intervals prevents the model fitting the experimental data. The dark blue line represents the experimental data. The pale blue data represent the model fit. Model parameter: U = 0.81; A = 122.77; τrec = 344 ms. (C) The relationship between normalized flexor EPSP amplitude and interspike interval is predicted by the model. Replacing the recovery time constant for all four fixed intervals and variable intervals of 33, 66, 100, 200 ms with time constants obtained from fits of other intervals, alters the relationship. Colored lines represent the experimental data, while grey lines represent the modeled data. (D) The relationship between normalized Flexor EPSP amplitude and ISF is predicted by the model. Replacing the recovery time constant for all four fixed intervals and variable intervals of 33, 66, 100, 200 ms with time constants obtained from fits of other intervals, disrupts the linear relationship between flexor EPSP amplitude and ISF. Colored lines represent the experimental data while grey lines represent the modeled data.
Figure 5
Figure 5
The FETi-flexor EPSP amplitude during natural sequences encodes interspike interval. (A) Intracellular traces showing flexor EPSPs evoked by natural sequences of FETi antidromic spikes. The stimulation protocol is shown below. (B) The amplitudes of flexor EPSPs during natural sequences have the same relationship to the inter-spike interval as do triplets (see Fig. 3).

References

    1. Abbott LF, Varela JA, Sen K, Nelson SB. Synaptic depression and cortical gain control. Science. 1997;275:221–224. doi: 10.1126/science.275.5297.221. - DOI - PubMed
    1. O’Donovan MJ, Rinzel J. Synaptic depression: A dynamic regulator of synaptic communication with varied functional roles. Trends in Neurosciences. 1997;20:431–433. doi: 10.1016/S0166-2236(97)01124-7. - DOI - PubMed
    1. Abbott LF, Regehr WG. Synaptic computation. Nature. 2004;431:796–803. doi: 10.1038/nature03010. - DOI - PubMed
    1. Pfister J, Dayan P, Lengyel M. Synapses with short-term plasticity are optimal estimators of presynaptic membrane potentials. Nature. 2010;13:1271–1275. - PMC - PubMed
    1. Wang LY, Kaczmarek LK. High-frequency firing helps replenish the readily releasable pool of synaptic vesicles. Nature. 1998;394:384–388. doi: 10.1038/28645. - DOI - PubMed

Publication types