. 2019 Apr;33(4):918-930.
doi: 10.1038/s41375-018-0254-2. Epub 2018 Sep 11.

Transmissible ER stress reconfigures the AML bone marrow compartment

Affiliations

Transmissible ER stress reconfigures the AML bone marrow compartment

Ben Doron et al. Leukemia. 2019 Apr.

Abstract

Successive adaptation of the bone marrow (BM) from homeostatic hematopoietic microenvironment to a self-reinforcing niche is an integral aspect of leukemogenesis. Yet, the cellular mechanisms underlying these functional alterations remain to be defined. Here, we found that AML incursion precipitates compartmental endoplasmic reticulum (ER) stress and an unfolded protein response (UPR) in both leukemia and stromal cells. We observed that extracellular vesicles (EV) transmit ER stress in vivo from the AML xenograft to BM stroma, whereby the upregulation of core UPR components drives subsequent osteolineage differentiation of mesenchymal stem cells (MSC). Finally, we show that the underlying mechanism involves quantitative incorporation and cell-cell transfer of Bone Morphogenic Protein 2 (BMP2), a potent osteogenic signal, by AML-EVs. Corroborative studies in AML patient samples support the translational relevance of AML-EVs as a platform for BMP trafficking and source of compartmental crosstalk. Transmissible ER stress was previously identified as a source of chemoresistance in solid tumor models, and this work reveals a role in remodeling the BM niche in AML.


Conflict of interest statement

Conflict of Interest: The authors have no conflicts of interest to disclose

Figures

Figure 1:
Figure 1:. AML negatively impacts the endosteal niche.
(a) MSC and OPC harvest workflow. Long bones from control and xenografted mice are removed, flushed, crushed, and incubated in Collagenase II. Disadhered cells are then filtered, stained with antibodies, and sorted via FACS. (b) CFU-F assay of MSCs and OPCs derived control and AML xenografted animals. Error bars are standard error of the mean (n= 8, 13, 8, 8 animals per condition). (c) The ratio of MSCs / OPCs in control and AML xenograft animals. Error bars are standard error of the mean (n= 22, 14, 4, 6 animals per condition). Significance in (b) and (c) was determined using ANOVA and Bonferroni correction. *P<0.05, ***P<0.001.
Figure 2:
Figure 2:. MSCs and OPCs exhibit differential fates in the leukemic bone marrow.
(a-b) Analysis of apoptosis in stromal populations. The percentage of Annexin V+ cells, and the MFI of P53 and Ser-15 phosphorylated P53 in control and xenografted animals within OPC (a) and MSC (b) gates. Error bars are standard error of the mean from (n= 8, 7, 5, 4) animals for Annexin V dataset and (n= 5, 6, 5, 4) for the pP53 and P53 experiments. Significance in (a) and (b) was determined using ANOVA and Bonferroni correction. **P<0.01, ***P<0.001. (c) Expression analysis of genes involved in early and late osteogenesis of xenograft-derived MSCs compared to control MSCs. Fold change determined by 2-ΔΔCt in pairwise analysis against control MSCs. Error bars are standard error of the mean from four animals per condition. Significance was determined by ANOVA and Student’s t-test. *P<0.05, **P<0.01, ***P<0.001.
Figure 3:
Figure 3:. MSCs and OPCs exhibit increased ER stress.
(a-b). Expression analysis of genes involved in the UPR from xenograft-derived MSCs (a) and OPCs (b). Fold change determined by 2-ΔΔCt in pairwise analysis against control MSC and OPCs, respectively. Error bars are standard error of the mean from four animals per condition. Significance was determined by ANOVA and Student’s t-test. *P<0.05, **P<0.01, ***P<0.001. (c) Expression analysis of genes involved in the UPR and osteogenesis in MSCs cultured in 1ng/mL thapsigargin compared to vehicle-treated MSCs. Fold change determined by 2-ΔΔCt against control cells. Error bars are standard error of the mean from three biological replicates. Significance was determined by Student’s t-test. ***P<0.001. (d) Expression analysis of UPR genes in hematopoietic stem cells (c-KIT+, SCA-1+, lin; KSL) from Molm-14 xenografts. Fold change determined by 2-ΔΔCt against KSL from control animals. Error bars are standard error of the mean from three animals per condition. Significance was determined by Student’s t-test. *P<0.05, **P<0.01, ***P<0.001.
Figure 4:
Figure 4:. AML EVs traffic to the ER of MSCs and OPCs.
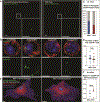
(a) Solid capture imaging of mGFP+ EVs from peripheral blood of Molm-14-mGFP xenografts (left) and from in vitro Molm-14-mGFP cells (right). Scale bars are 5μm. (b) Live-cell imaging of MSCs and OPCs derived from control and Molm-14-mGFPxenografts. mGFP: green, Cellmask: red, Hoechst: blue. Scale bars are 5μm. (c) Quantification of Molm-14-mGFP xenograft-derived MSCs and OPCs containing mGFP+ vesicles. 50 cells per cell type analyzed from 2 animals. (d) Quantification of mGFP+ vesicles per positive MSC and OPC derived from Molm-14-mGFP xenografts. 50 cells per cell type analyzed from 2 animals, significance determined by Student’s t-test *P<0.05. (e) Representative images of live-cell, confocal microscopy of in vitro expanded MSCs (left) and OPCs (right) exposed to EVs harvested from Molm-14-mGFP cells. Green: ER-localized mGFP+ vesicles, white: cytosol-localized mGFP+ vesicles, red: ER surface, purple: plasma membrane surface, blue: Hoechst. Scale bars are 5μm. (f) Quantification of ER-localization of internalized mGFP+ vesicles in in vitro expanded MSCs and OPCs. 5 cells per cell type analyzed, significance determined by student’s T-test *P<0.05
Figure 5:
Figure 5:. AML cells exhibit an UPR in vivo.
(a) Experimental outline for intrafemoral injections. EVs from Molm-14-mGFP cells and healthy CD34+ cells were injected contralaterally into femurs of recipient mice. Femurs were harvested 48hrs later, MSCs and OPCs were sorted into RNA extraction buffer for gene expression analysis. (b) Expression analysis of UPR genes from MSCs and OPCs from Molm-14-mGFP EV injected femurs. Fold change was determined by 2-ΔΔCt against respective cells from CD34+ EV injected femurs. Error bars are standard error of the mean from three animals per condition. (c) Expression analysis of UPR genes from MSCs and OPCs from CD34+-derived EV injected femurs. Fold change was determined by 2-ΔΔCt against respective cells from vehicle injected femurs. Error bars are standard error of the mean from three animals per condition. (d) Expression analysis of UPR genes from in vitro cultured MSCs and OPCs exposed to Molm-14-mGFP EVs. Fold change determined by 2-ΔΔCt against vehicle-treated cells. Error bars are standard error of the mean from three separate experiments. Significance in (b) and (c) was determined by Student’s t-test, *P<0.05, **P<0.01. (e) Timecourse of UPR gene expression in explanted Molm-14-mGFP. Molm-14-mGFP cells were sorted out of xenograft bone marrow based on human CD45 expression and cultured ex vivo. RNA was extracted from cells directly from the sort (0hr) or 48 and 72hrs in normal culture media in vitro. Fold change determined by 2-ΔΔCt against in vitro cultured Molm-14-mGFP cells. Error bars are standard error of the mean from three separate experiments. (f) UPR status was determined by protein levels of GRP78, and phosphorylated eIF2α in AML-patient samples and healthy pediatric and adult controls. (g) Expression analysis of UPR genes from blasts from AML patient samples. Fold change determined by 2-ΔΔCt in pairwise analysis against control samples. Error bars are standard error of the mean.
Figure 6:
Figure 6:. AML cells alter their EV cargo upon UPR induction.
(a) Expression analysis of BMP genes in Molm-14-mGFP cells cultured in thapsigargin. Fold change determined by 2-ΔΔCt against vehicle-treated cells. Error bars are standard error of the mean from (n=4, two separate experiments). Significance was determined using ANOVA and Bonferroni correction. *P<0.05, **P<0.01. (b) Timecourse of BMP gene expression in explanted Molm-14-mGFP. Molm-14-mGFP cells were sorted out of xenograft bone marrow based on human CD45 expression and cultured ex vivo. RNA was extracted from cells directly from the sort (0hr) or 48 and 72hrs in normal culture media in vitro. Fold change determined by 2-ΔΔCt against in vitro cultured Molm-14-mGFP cells. Error bars are standard error of the mean from (n=7, two separate experiments). (c) Expression analysis of BMP genes from AML patient samples. Fold change determined by 2-ΔΔCt in pairwise analysis against control samples. Error bars are standard error of the mean. (d) Concentration of BMP2 protein in the supernatant (SN) and pellet (EV) from EV harvest of Molm-14-mGFP cells cultured in thapsigargin. ELISA was used to determine protein concentration. Error bars are standard error of the mean from three separate experiments. Significance was determined by ANOVA and Student’s t-test. *P<0.05, **P<0.01. (e) Model for AML-mediated remodeling of the endosteal niche. Niche homeostasis is maintained by reciprocal crosstalk between stromal and hematopoietic components (left). AML proliferation results in an intrinsic UPR that is transferred to stromal cells in part by increased EV output and BMP2 incorporation into EVs. This signaling axis promotes ER stress in recipient stroma and contribute to the differential fates of MSCs and OPCs (right).

Similar articles

Cited by

References

    1. Mendez-Ferrer S, Michurina TV, Ferraro F, Mazloom AR, Macarthur BD, Lira SA, et al. Mesenchymal and haematopoietic stem cells form a unique bone marrow niche. Nature. 2010;466(7308):829–34. - PMC - PubMed
    1. Chitteti BR, Cheng YH, Poteat B, Rodriguez-Rodriguez S, Goebel WS, Carlesso N, et al. Impact of interactions of cellular components of the bone marrow microenvironment on hematopoietic stem and progenitor cell function. Blood. 2010;115(16):3239–48. - PMC - PubMed
    1. Jung Y, Song J, Shiozawa Y, Wang J, Wang Z, Williams B, et al. Hematopoietic stem cells regulate mesenchymal stromal cell induction into osteoblasts thereby participating in the formation of the stem cell niche. Stem Cells. 2008;26(8):2042–51. - PMC - PubMed
    1. El-Badri NS, Wang BY, Cherry Good RA. Osteoblasts promote engraftment of allogeneic hematopoietic stem cells. Exp Hematol. 1998;26(2):110–6. - PubMed
    1. Mendez-Ferrer S, Chow A, Merad M, Frenette PS. Circadian rhythms influence hematopoietic stem cells. Curr Opin Hematol. 2009;16(4):235–42. - PMC - PubMed

Publication types

MeSH terms