. 2019 Mar;33(3):671-685.
doi: 10.1038/s41375-018-0248-0. Epub 2018 Sep 11.

Downregulating Notch counteracts KrasG12D-induced ERK activation and oxidative phosphorylation in myeloproliferative neoplasm

Affiliations

Downregulating Notch counteracts KrasG12D-induced ERK activation and oxidative phosphorylation in myeloproliferative neoplasm

Guangyao Kong et al. Leukemia. 2019 Mar.

Abstract

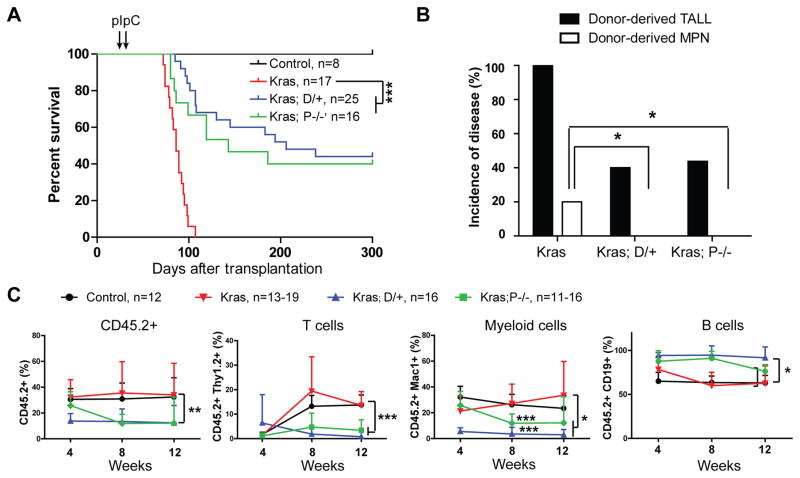
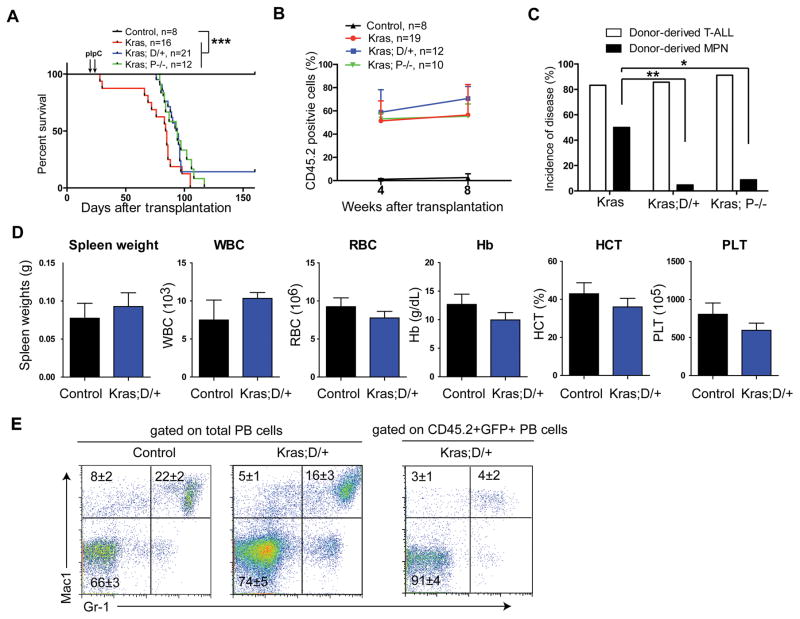
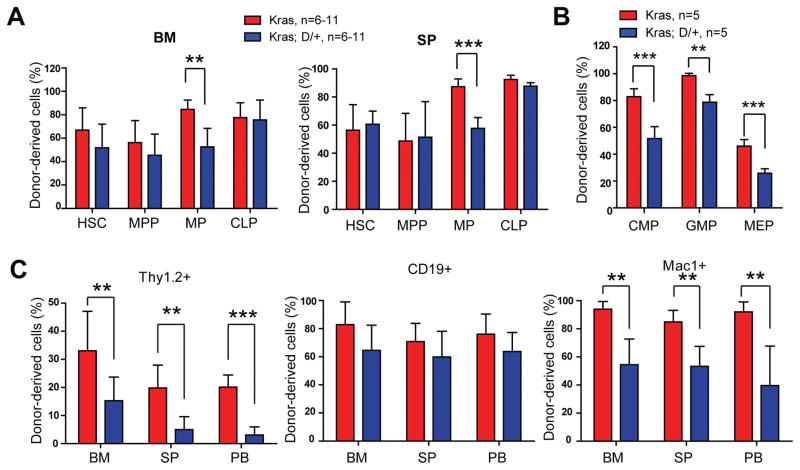
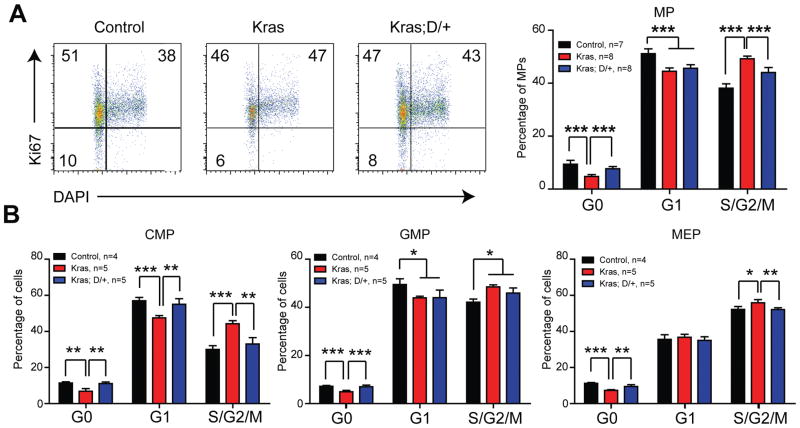
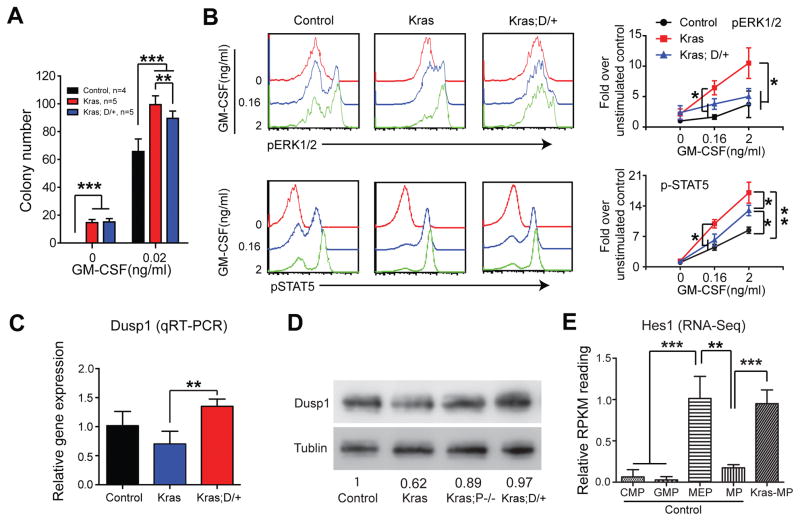
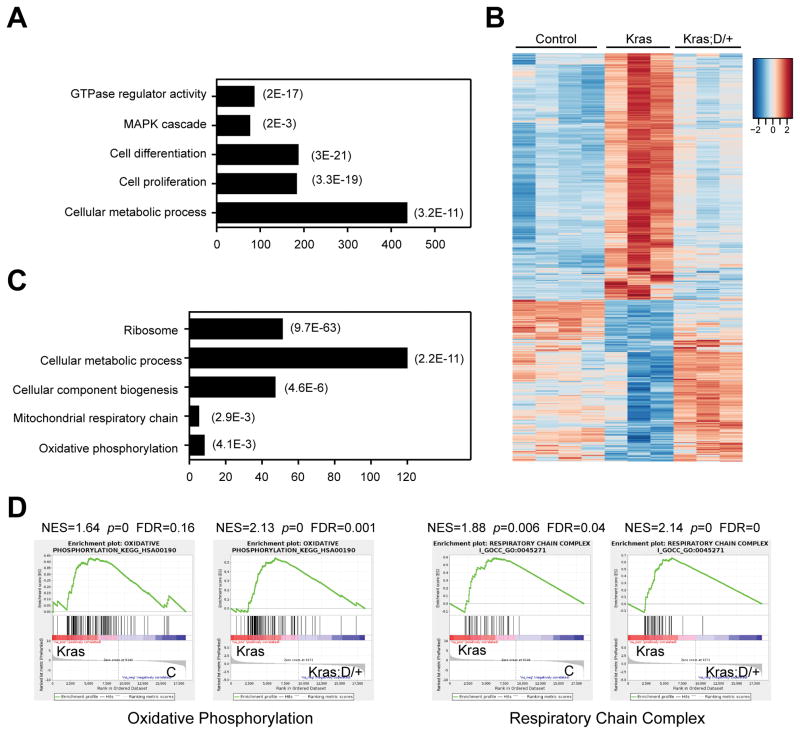
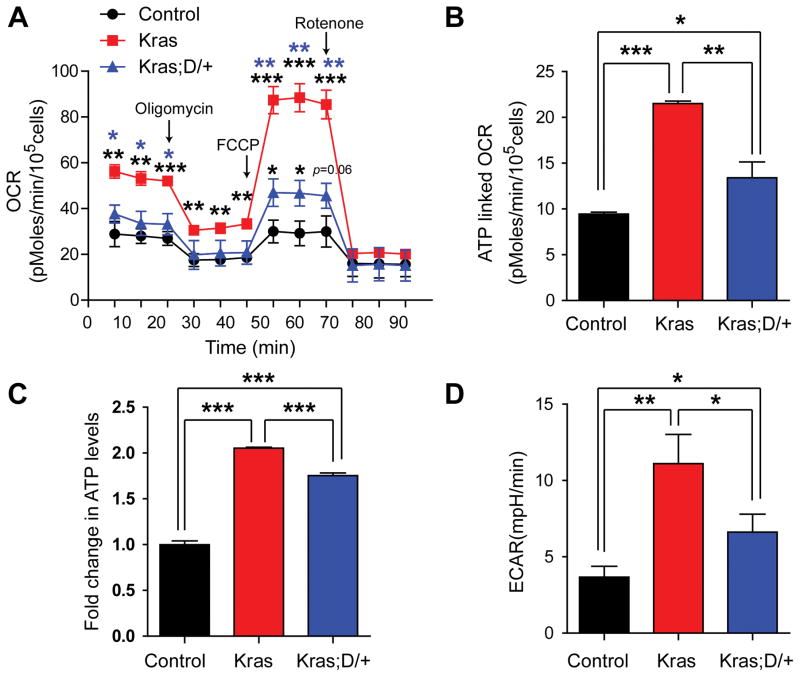
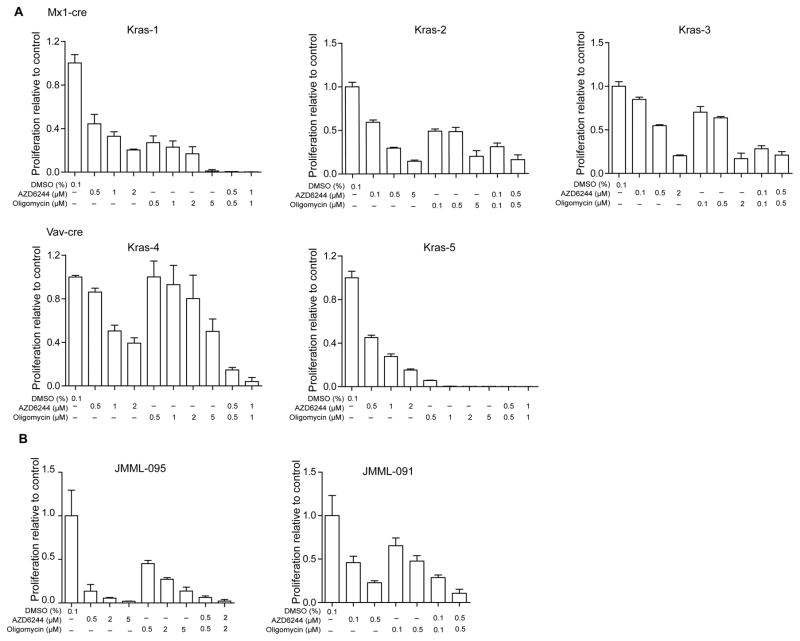
The Notch signaling pathway contributes to the pathogenesis of a wide spectrum of human cancers, including hematopoietic malignancies. Its functions are highly dependent on the specific cellular context. Gain-of-function NOTCH1 mutations are prevalent in human T-cell leukemia, while loss of Notch signaling is reported in myeloid leukemias. Here, we report a novel oncogenic function of Notch signaling in oncogenic Kras-induced myeloproliferative neoplasm (MPN). We find that downregulation of Notch signaling in hematopoietic cells via DNMAML expression or Pofut1 deletion significantly blocks MPN development in KrasG12D mice in a cell-autonomous manner. Further mechanistic studies indicate that inhibition of Notch signaling upregulates Dusp1, a dual phosphatase that inactivates p-ERK, and downregulates cytokine-evoked ERK activation in KrasG12D cells. Moreover, mitochondrial metabolism is greatly enhanced in KrasG12D cells but significantly reprogrammed by DNMAML close to that in control cells. Consequently, cell proliferation and expanded myeloid compartment in KrasG12D mice are significantly reduced. Consistent with these findings, combined inhibition of the MEK/ERK pathway and mitochondrial oxidative phosphorylation effectively inhibited the growth of human and mouse leukemia cells in vitro. Our study provides a strong rational to target both ERK signaling and aberrant metabolism in oncogenic Ras-driven myeloid leukemia.


Conflict of interest statement

Conflict of Interest Disclosures:

We declare that no conflict of interest exists.

Figures

Figure 1
Figure 1. Downregulating Notch signaling inhibits oncogenic Kras-induced T-ALL in a cell-autonomous manner
Lethally irradiated mice (CD45.1+) were transplanted with 2.5×10⁵ bone marrow cells (CD45.2+) from control (Mx1-Cre), KrasLSL G12D/+;Mx1-Cre (Kras), KrasLSL G12D/+;Rosa26LSL DNMAML-GFP/+;Mx1-Cre (Kras; D/+) or KrasLSL G12D/+; Pofutfl/fl ;Mx1-Cre (Kras; P−/−) mice along with 2.5×10⁵ competitor cells (CD45.1+). Four weeks after transplantation, Cre expression was induced using pI-pC injections as described in Methods. Moribund recipients transplanted with Kras, Kras; D/+ or Kras; P−/− cells and age-matched recipients transplanted with control cells were sacrificed for analysis. (A) Kaplan-Meier survival curves of different groups of recipient mice were plotted against days after transplantation. P values were determined using the Log-rank test. (B) Disease incidence in different groups of recipients. Chi-square analysis was performed. (C) Total donor-derived cells and donor-derived myeloid cells, B cells or T cells (CD45.2+) in different groups of recipients were evaluated regularly after transplantation. Of note, 4-week data were collected right before pI-pC injections. The results are presented as mean ± SD. * P<0.05; ** P<0.01; *** P<0.001.
Figure 2
Figure 2. Downregulating Notch signaling inhibits oncogenic Kras-induced acute MPN in a cell-autonomous manner
Lethally irradiated mice (CD45.1+) were transplanted with 2 ×10⁶ splenocytes (CD45.2+) from control (Mx1-Cre), KrasLSL G12D/+;Mx1-Cre (Kras), KrasLSL G12D/+;Rosa26LSL DNMAML-GFP/+;Mx1-Cre (Kras; D/+), or KrasLSL G12D/+; Pofutfl/fl ;Mx1-Cre (Kras; P−/−) mice along with 2.5×10⁵ competitor cells (CD45.1+). Four weeks after transplantation, Cre expression was induced using pI-pC injections as described in Methods. Moribund recipients transplanted with Kras, Kras; D/+ or Kras; P−/− cells and age-matched recipients transplanted with control cells were sacrificed for analysis. (A) Kaplan-Meier survival curves of different groups of recipient mice were plotted against days after transplantation. P values were determined using the Log-rank test. (B) Quantification of donor-derived cells (CD45.2+) in the peripheral blood of recipients. Of note, 4-week data were collected right before pI-pC injections. The results are presented as mean ± SD. (C) Disease incidence in different groups of recipient mice. Chi-square analysis was performed. (D, E) Three recipients transplanted with Kras; D/+ cells did not develop T-ALL and were sacrificed for analysis 160 days after transplantation with age-matched control recipients. (D) Quantification of spleen weight and CBC analysis results. Numbers of WBC (white blood cell), RBC (red blood cell), Hb (hemoglobin), HCT (hematocrit), and PLT (platelet) are shown. (E) Flow cytometric analysis of peripheral blood (PB) cells using myeloid lineage markers. Total (left) or donor-derived (right) live nucleated cells are gated for analysis. The results are presented as mean ± SD. * P<0.05; ** P<0.01; *** P<0.001.
Figure 3
Figure 3. DNMAML expression in Kras hematopoietic system reduces myeloid compartment
Lethally irradiated mice (CD45.1+) were transplanted with 2 ×10⁶ splenocytes (CD45.2+) from KrasLSL G12D/+;Mx1-Cre (Kras) or KrasLSL G12D/+;Rosa26LSL DNMAML-GFP/+;Mx1-Cre (Kras; D/+) mice along with 2.5×10⁵ competitor cells (CD45.1+). Three weeks after transplantation, Cre expression was induced using pI-pC injections as described in Methods. Recipients transplanted with Kras or Kras; D/+ cells were sacrificed 3 weeks after pI-pC injections. Donor-derived cells are defined as CD45.2+ cells in Kras recipients and CD45.2+ GFP+ cells in Kras; D/+ recipients. (A) Quantification of donor-derived hematopoietic stem cells (HSCs), multi-potential progenitors (MPPs), myeloid progenitors (MPs), and common lymphoid progenitors (CLPs) in the bone marrow (BM) and spleen (SP) of recipients. (B) Quantification of donor-derived common myeloid progenitors (CMPs), granulocyte-macrophage progenitors (GMPs), and megakaryocyte-erythroid progenitors (MEPs) in the bone marrow of recipients. (C) Quantification of donor-derived differentiated cells in BM, SP, and peripheral blood (PB). Data are presented as mean ± SD. * P<0.05, ** P<0.01; *** P<0.001.
Figure 4
Figure 4. DNMAML expression reduces hyperproliferation of Kras myeloid progenitors
Lethally irradiated mice (CD45.1+) were transplanted with 2 ×10⁶ splenocytes (CD45.2+) from KrasLSL G12D/+;Mx1-Cre (Kras) or KrasLSL G12D/+;Rosa26LSL DNMAML-GFP/+;Mx1-Cre (Kras; D/+) mice along with 2.5×10⁵ competitor cells (CD45.1+). The control group was transplanted with 1×10⁶ bone marrow cells (CD45.2+) along with 2.5×10⁵ competitor cells (CD45.1+). Three weeks after transplantation, Cre expression was induced using pI-pC injections as described in Methods. Recipients transplanted with control, Kras or Kras; D/+ cells were sacrificed 4–5 weeks after pI-pC injections. Donor-derived cells are defined as CD45.2+ cells in control and Kras recipients or CD45.2+ GFP+ cells in Kras; D/+ recipients. Cell cycle analysis of bone marrow donor-derived myeloid progenitors (MPs) (A), common myeloid progenitors (CMPs), granulocyte-macrophage progenitors (GMPs), and megakaryocyte-erythroid progenitors (MEPs) (B) using Ki67 and DAPI.
Figure 5
Figure 5. DNMAML expression leads to Dusp1 upregulation and downregulation of GM-CSF-stimulated ERK activation in Kras myeloid progenitors
Lethally irradiated mice (CD45.1+) were transplanted with 2 ×10⁶ splenocytes (CD45.2+) from KrasLSL G12D/+;Mx1-Cre (Kras) or KrasLSL G12D/+;Rosa26LSL DNMAML-GFP/+;Mx1-Cre (Kras; D/+) mice along with 2.5×10⁵ competitor cells (CD45.1+). The control group was transplanted with 1×10⁶ bone marrow cells (CD45.2+) along with 2.5×10⁵ competitor cells (CD45.1+). Three weeks after transplantation, Cre expression was induced using pI-pC injections as described in Methods. Recipients transplanted with control, Kras or Kras; D/+ cells were sacrificed 4–5 weeks after pI-pC injections. Donor-derived cells are defined as CD45.2+ cells in control and Kras recipients or CD45.2+ GFP+ cells in Kras; D/+ recipients. (A) 5X10⁴ donor-derived bone marrow cells from recipients were plated in duplicate in semi-solid medium with or without GM-CSF. (B) Donor-derived whole bone marrow cells were sorted using flow cytometry and serum- and cytokine-starved for 2 hours at 37°C. Cells were then stimulated with different concentrations of mGM-CSF for 10 minutes at 37°C. Levels of p-ERK1/2 and pSTAT5 were measured using phospho-flow cytometry. Lin−/low c-Kit+ cells, which are enriched for myeloid progenitors, were gated for analysis. (C, D) Dusp1 expression was quantified in donor-derived Lin bone marrow cells using qRT-PCR (C) or Western blot (D). (E) Quantification of Hes1 expression in different populations of progenitor cells using RNA-Seq. Data are presented as mean ± SD. * P<0.05, ** P<0.01; *** P<0.001.
Figure 6
Figure 6. DNMAML expression restores transcription levels of metabolic genes in Kras myeloid progenitors
Lethally irradiated mice (CD45.1+) were transplanted with 2 ×10⁶ splenocytes (CD45.2+) from KrasLSL G12D/+;Mx1-Cre (Kras) or KrasLSL G12D/+;Rosa26LSL DNMAML-GFP/+;Mx1-Cre (Kras; D/+) mice along with 2.5×10⁵ competitor cells (CD45.1+). Three weeks after transplantation, Cre expression was induced using pI-pC injections as described in Methods. Recipients transplanted with Kras or Kras; D/+ cells were sacrificed 3 weeks after pI-pC injections. Donor-derived myeloid progenitors (MPs) and MPs from control mice (Ctrl) were sorted for RNA-Seq analysis. Donor-derived cells are defined as CD45.2+ cells in control and Kras recipients or CD45.2+ GFP+ cells in Kras; D/+ recipients. (A) Gene Ontology (GO) analysis of differentially expressed genes in Kras MPs using DAVID bioinformatics program. The representative biological processes are shown with numbers of genes in each category (represented by the bar lengths) and corresponding P values. (B) Heatmap analysis of gene expression signature perturbed in Kras MPs but restored in Kras;D/+ MPs. (C) Go analysis of genes that were perturbed in Kras MPs but restored in Kras;D/+ MPs. The representative biological processes are shown with corresponding P values. (D) Gene Set Enrichment Analysis (GSEA) identified that oxidative phosphorylation and respiratory chain complex were upregulated in Kras MPs but restored to control levels in Kras;D/+ MPs. Data are presented as mean ± SD. * P<0.05, ** P<0.01; *** P<0.001.
Figure 7
Figure 7. Downregulating Notch signaling targets mitochondrial metabolism in Kras myeloid progenitor and precursor cells
Lethally irradiated mice (CD45.1+) were transplanted with 2 ×10⁶ splenocytes (CD45.2+) from KrasLSL G12D/+;Mx1-Cre (Kras) or KrasLSL G12D/+;Rosa26LSL DNMAML-GFP/+;Mx1-Cre (Kras; D/+) mice along with 2.5×10⁵ competitor cells (CD45.1+). The control group was transplanted with with 1×10⁶ bone marrow cells (CD45.2+) along with 2.5×10⁵ competitor cells (CD45.1+). Three weeks after transplantation, Cre expression was induced using pI-pC injections as described in Methods. Recipients transplanted with control, Kras or Kras; D/+ cells were sacrificed 5 weeks after pI-pC injections. Donor-derived Lin bone marrow cells were sorted using flow cytometry. Donor-derived cells are defined as CD45.2+ cells in control and Kras recipients or CD45.2+ GFP+ cells in Kras; D/+ recipients. (A) Oxygen consumption rates (OCR) were measured in the presence of the mitochondrial inhibitor (oligomycin, 1μM), the uncoupling agent (FCCP, 2.5 μM), and the respiratory chain inhibitor (rotenone, 1 μM). (B) Quantification of ATP-linked OCR, which is the calculated difference between the basal OCR level and the OCR level after oligomycin treatment. (C) Total cellular ATP concentrations were measured using the CellTiter Glo assay. (D) Quantification of extracellular acidification rates (ECAR). Data are presented as mean ± SD. * P<0.05, ** P<0.01; *** P<0.001.
Figure 8
Figure 8. Combined AZD6244 and oligomycin treatment effectively inhibits the growth of human and mouse leukemia cells in vitro
Leukemia cells from moribund Kras G12D/+ mice (carrying Mx1-Cre or Vav-Cre) with advanced JMML-like phenotypes (n=5) (A) or from human JMML patients (n=2) (B) were cultured in triplicate in 96-well plates in the presence of vehicle or various concentrations of AZD6244 and/or oligomycin for 5 days (A) or 14 days (B). Cell number was quantified using the CellTiter-Glo assay. Data are presented as mean ± s.d.

Similar articles

Cited by

References

    1. Wharton KA, Johansen KM, Xu T, Artavanis-Tsakonas S. Nucleotide sequence from the neurogenic locus notch implies a gene product that shares homology with proteins containing EGF-like repeats. Cell. 1985 Dec;43(3 Pt 2):567–581. - PubMed
    1. Kidd S, Kelley MR, Young MW. Sequence of the notch locus of Drosophila melanogaster: relationship of the encoded protein to mammalian clotting and growth factors. Mol Cell Biol. 1986 Sep;6(9):3094–3108. - PMC - PubMed
    1. Ntziachristos P, Lim JS, Sage J, Aifantis I. From fly wings to targeted cancer therapies: a centennial for notch signaling. Cancer Cell. 2014 Mar 17;25(3):318–334. - PMC - PubMed
    1. Moloney DJ, Panin VM, Johnston SH, Chen J, Shao L, Wilson R, et al. Fringe is a glycosyltransferase that modifies Notch. Nature. 2000 Jul 27;406(6794):369–375. - PubMed
    1. Wang Y, Shao L, Shi S, Harris RJ, Spellman MW, Stanley P, et al. Modification of epidermal growth factor-like repeats with O-fucose. Molecular cloning and expression of a novel GDP-fucose protein O-fucosyltransferase. J Biol Chem. 2001 Oct 26;276(43):40338–40345. - PubMed

Publication types

MeSH terms