. 2018 Sep 11;8(1):13610.
doi: 10.1038/s41598-018-31797-5.

Effects of dichloroacetate as single agent or in combination with GW6471 and metformin in paraganglioma cells

Affiliations

Effects of dichloroacetate as single agent or in combination with GW6471 and metformin in paraganglioma cells

Rosalba Florio et al. Sci Rep. .

Abstract

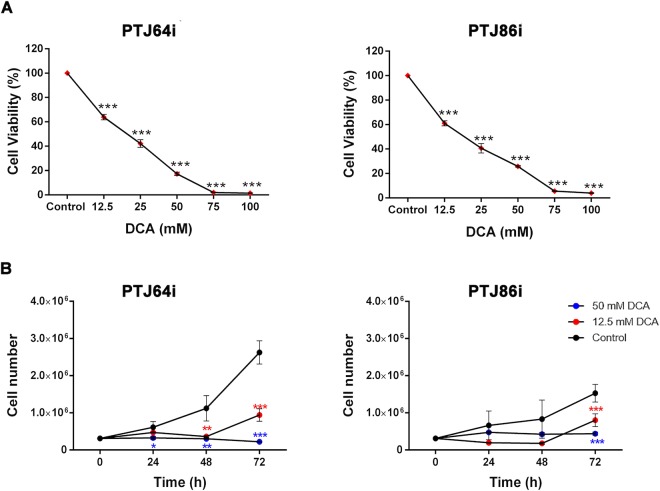
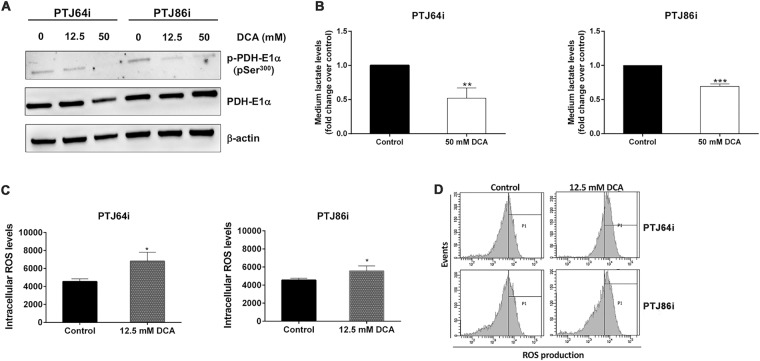
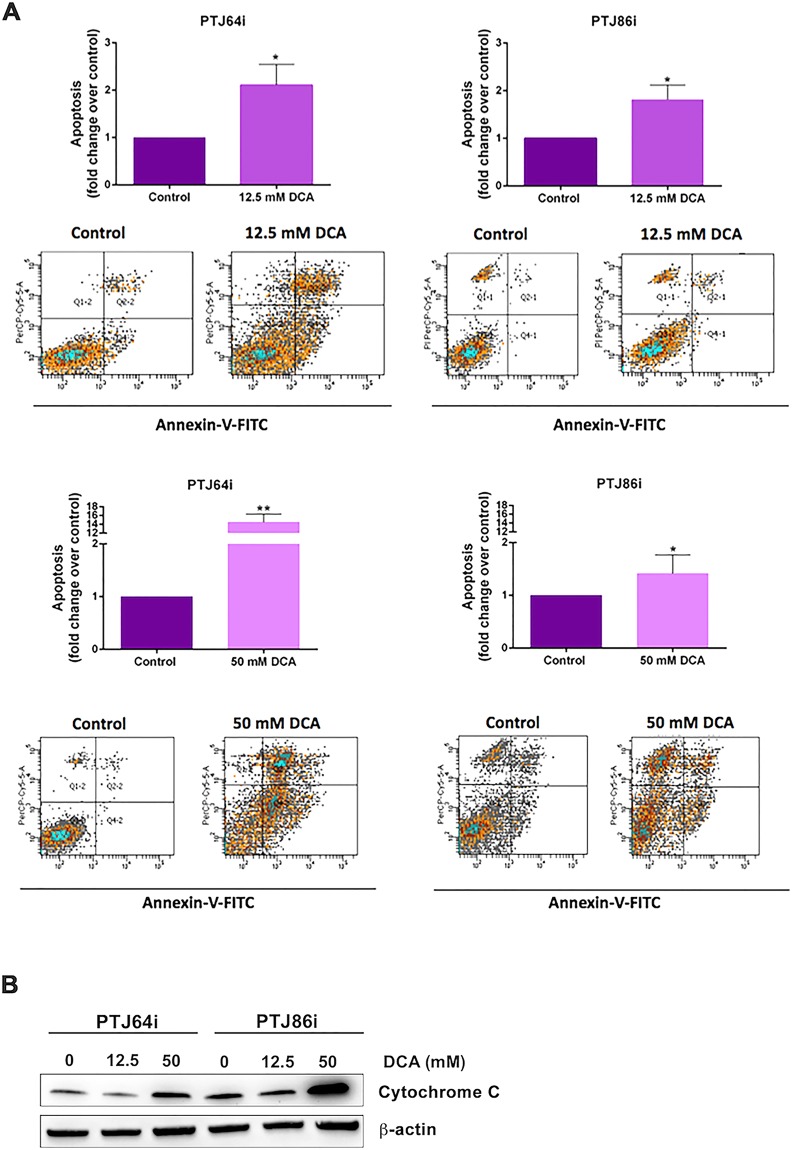
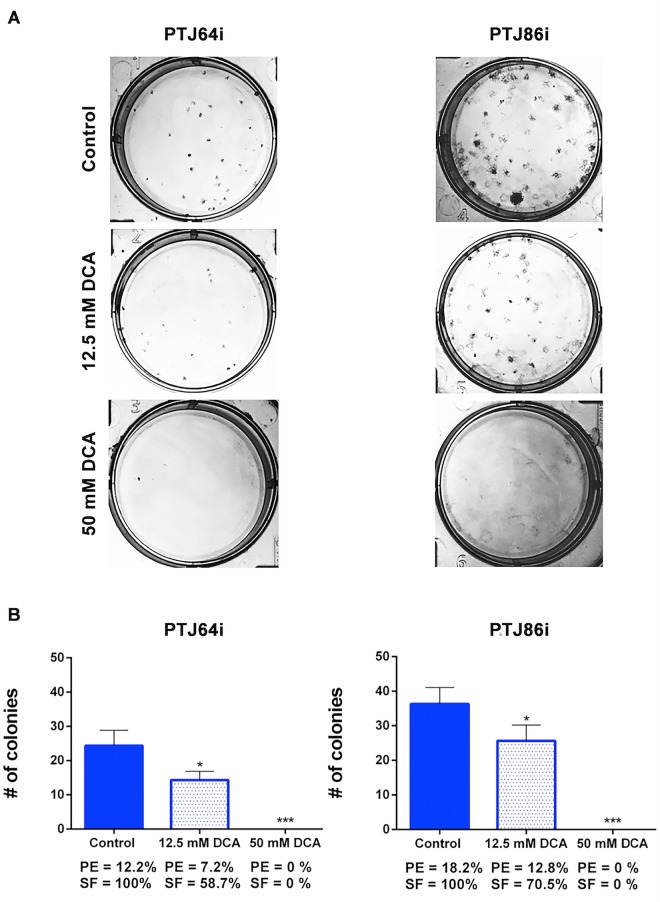
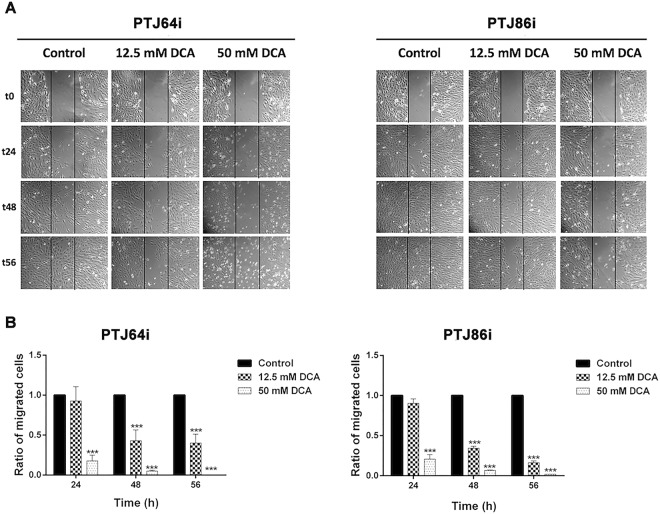
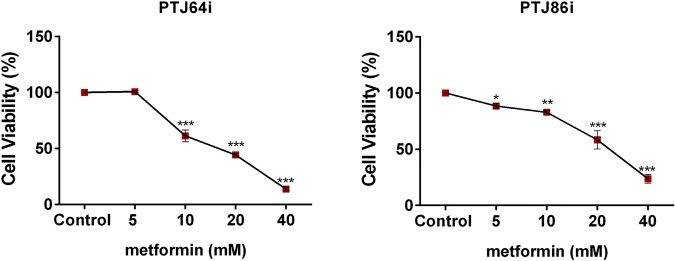
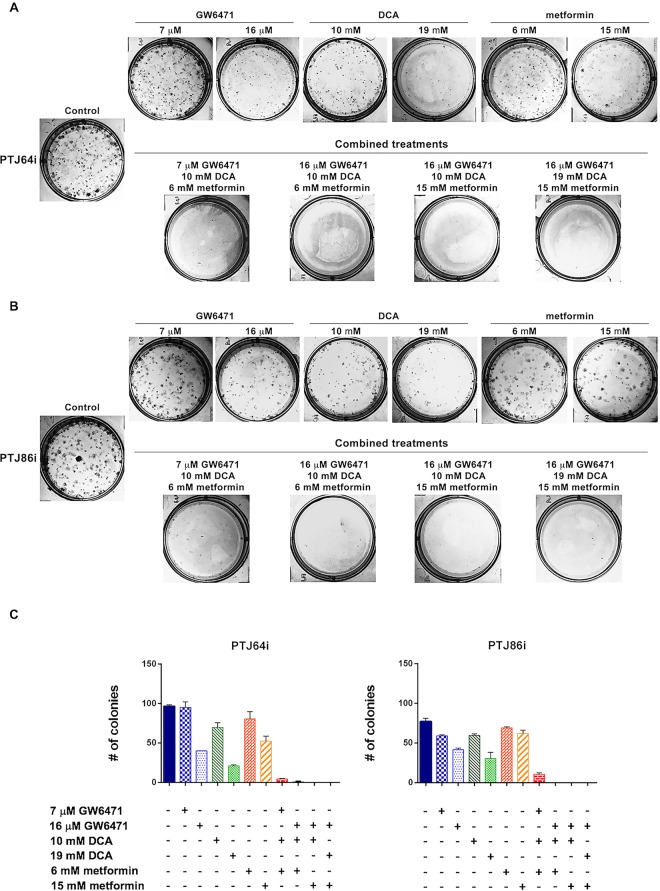
Paragangliomas (PGLs) are infiltrating autonomic nervous system tumors that cause important morbidity. At present, surgery is the only effective therapeutic option for this rare tumor. Thus, new agents for PGL treatment should be identified. Using unique PGL cell models established in our laboratory, we evaluated the effect of dichloroacetate (DCA) as single agent or in a novel combination with other metabolic drugs, including GW6471 and metformin. DCA and metformin had not been tested before in PGL. DCA reduced PGL cell viability and growth through mechanisms involving reactivation of PDH complex leading to promotion of oxidative metabolism, with lowering of lactate and enhanced ROS production. This resulted in cell cycle inhibition and induction of apoptosis in PGL cells, as shown by flow cytometry and immunoblot analyses. Moreover, DCA drastically impaired clonogenic activity and migration of PGL cells. Also metformin reduced PGL cell viability as single agent and the combinations of DCA, GW6471 and metformin had strong effects on cell viability. Furthermore, combined treatments had drastic and synergistic effects on clonogenic ability. In conclusion, DCA, GW6471 and metformin as single agents and in combination appear to have promising antitumor effects in unique cell models of PGL.


Conflict of interest statement

The authors declare no competing interests.

Figures

Figure 1
Figure 1
DCA reduces cell viability and growth in PTJ64i and PTJ86i cell lines. (A) Cells were incubated for 72 hours with DCA at the indicated concentrations, or with PBS vehicle (control). Cell viability was assessed by MTT assay. DCA significantly inhibited cell viability in both cell lines in a dose–dependent manner, with an IC50 of 18.9 mM in PTJ64i and 18.8 mM in PTJ86i, as assessed by CompuSyn. Data shown are the means ± SD of three independent experiments with quintuplicate determinations. *Statistically significant differences between control and each drug concentration (***p < 0.001); (B) Cell number was measured over a 72–hour time course treatment with 12.5 mM, 50 mM DCA or with vehicle control. Data shown are the means ± SD of three to nine independent determinations (*p < 0.05; **p < 0.01; ***p < 0.001).
Figure 2
Figure 2
DCA inhibits PDK, decreases extracellular lactate and increases intracellular ROS levels in PTJ64i and PTJ86i cell lines. (A) Western blot analysis of p-PDH-E1α (pSer300) and PDH-E1α proteins after incubation of PGL cells for 24 hours with vehicle or DCA at the indicated concentrations; (B) Histograms represent quantification of extracellular lactate levels in the culture media of PGL cell lines treated with DCA or vehicle (control) for 24 hours. Data shown are the means ± SD of three replicates and are expressed as fold change relative to vehicle (control) (**p < 0.01; ***p < 0.001); (C) Intracellular ROS levels in PTJ64i and PTJ86i cells measured by flow cytometry after a 24–hour treatment with DCA or vehicle (control). Data shown are the means ± SD of three independent experiments (*p < 0.05); (D) Representative CM–H2DCFDA histograms derived from flow cytometry analysis showing ROS production in PTJ64i and PTJ86i cells after a 24–hour treatment with DCA or vehicle (control). Full–length western blots are included in Supplementary Information (Fig. S1).
Figure 3
Figure 3
DCA affects cell cycle in PTJ64i and PTJ86i cell lines. (A) The histograms show the mean percentages of cells (values inside the bars) in the different cell phases, evaluated by flow cytometry, after 24-hour treatment with 12.5 or 50 mM DCA as compared to control. Results shown are the means ± SD of three independent experiments (**p < 0.01; ***p < 0.001); (B) Representative DNA distribution histograms of PGL cells exposed to DCA (12.5 mM and 50 mM) or vehicle (control) for 24 hours, as measured by flow cytometry; (C) Expression of cyclin D3 and cyclin B1 proteins after incubation of cells for 24 hours with vehicle or 50 mM DCA was analyzed by western blot using antibodies directed against the indicated proteins. Full–length western blots are included in Supplementary Information (Fig. S2).
Figure 4
Figure 4
Apoptosis in PTJ64i and PTJ86i cells treated with 12.5 or 50 mM DCA. (A) Values represented in the histograms (top of each panel) are the means ± SD of two to six independent experiments (*p < 0.05; ***p < 0.001). Dot plots (bottom of each panel) show representative experiments after a 24-hour treatment with 12.5 or 50 mM DCA; (B) Expression of cytochrome C in PTJ64i and PTJ86i cells treated with 12.5 and 50 mM DCA for 8 hours was analyzed by western blot. Full-length western blots are included in Supplementary Information (Fig. S3).
Figure 5
Figure 5
DCA affects clonogenic activity of PTJ64i and PTJ86i cell lines. (A) Representative plates of colony formation assays for both PGL cell lines are shown; (B) Histograms show the means ± SD of three independent experiments (*p < 0.05; ***p < 0.001). PE: plating efficiency [(# of colonies formed/# of cells plated)*100]; SF: surviving fraction [# of colonies formed *100/(# of cells plated *PE of control vehicle)].
Figure 6
Figure 6
Effect of DCA on wound healing. (A) Representative wound-healing assay pictures for PTJ64i and PTJ86i cells treated with vehicle or with DCA (12.5 and 50 mM) are shown. Pictures of PGL cells were taken at 0, 24, 48 and 56 hours to analyze the dynamics of wound closure (vertical lines indicate wound edges); (B) Histograms represent quantitative analyses of cell migration and are expressed as the ratio of the number of migrated cells in three fields after treatment as compared with vehicle (***p < 0.001).
Figure 7
Figure 7
Metformin affects cell viability in PTJ64i and PTJ86i cell lines. Cells were incubated for 72 hours with metformin at the indicated concentrations, or with PBS vehicle (control). Cell viability was assessed by MTT assay. Metformin significantly inhibited cell viability in both cell lines in a dose-dependent manner, with an IC50 of 21.6 mM in PTJ64i and 22.1 mM in PTJ86i, as assessed by CompuSyn. Data shown are the means ± SD of three independent experiments with quintuplicate determinations. *Statistically significant differences between control and each drug concentration (*p < 0.05; **p < 0.01; ***p < 0.001).
Figure 8
Figure 8
Effect of DCA, GW6471 and metformin as single agents or in combinations on PGL cell viability. Cells were incubated for 72 hours with DCA, GW6471 and metformin, alone or in combination, at the indicated concentrations, or with vehicle. Cell viability was assessed by MTT assay. The combination index (CI) for each drug combination was calculated using the Chou–Talalay equation. Data shown are the means ± SD of three independent experiments with quintuplicate determinations.
Figure 9
Figure 9
Effect of DCA, GW6471 and metformin as single agents or in combinations on PGL clonogenic capacity. (A,B) Representative plates of colony formation assays for PTJ64i (A) and PTJ86i (B) are shown; (C) Histograms represent quantitative analyses of colony formation assay in PGL cells. Data shown are the means ± SD of two independent experiments.

References

    1. Parenti G, et al. Updated and new perspectives on diagnosis, prognosis, and therapy of malignant pheochromocytoma/paraganglioma. J. Oncol. 2012;2012:872713. doi: 10.1155/2012/872713. - DOI - PMC - PubMed
    1. Taïeb D, et al. Current approaches and recent developments in the management of head and neck paragangliomas. Endocr. Rev. 2014;35:795–819. doi: 10.1210/er.2014-1026. - DOI - PMC - PubMed
    1. Baysal BE, et al. Mutations in SDHD, a mitochondrial complex II gene, in hereditary paraganglioma. Science. 2000;4:848–851. doi: 10.1126/science.287.5454.848. - DOI - PubMed
    1. Rustin P, Munnich A, Rötig A. Succinate dehydrogenase and human diseases: new insights into a well–known enzyme. Eur. J. Hum. Genet. 2002;10:289–291. doi: 10.1038/sj.ejhg.5200793. - DOI - PubMed
    1. Lack EE, Lloyd RV, Carney JA, Woodruff JM. Association of Directors of Anatomic and Surgical Pathology. Recommendations for reporting of extra–adrenal paragangliomas. Hum. Pathol. 2003;34:112–113. doi: 10.1053/hupa.2003.13. - DOI - PubMed

Publication types

LinkOut - more resources