. 2018 Sep 11;8(1):13628.
doi: 10.1038/s41598-018-31957-7.

Anti-TNFR1 targeting in humanized mice ameliorates disease in a model of multiple sclerosis

Affiliations

Anti-TNFR1 targeting in humanized mice ameliorates disease in a model of multiple sclerosis

Sarah K Williams et al. Sci Rep. .

Abstract

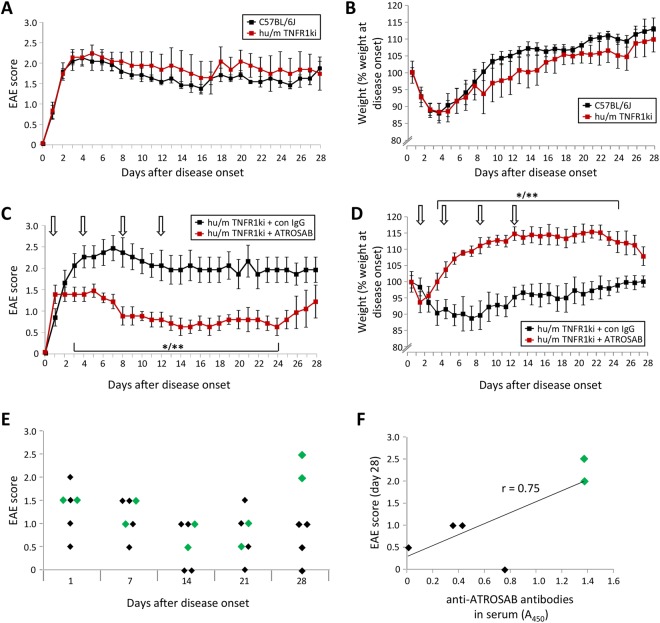
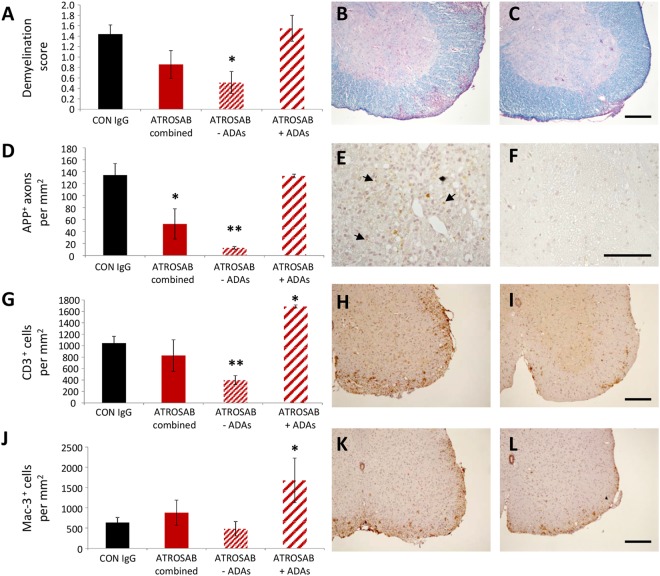
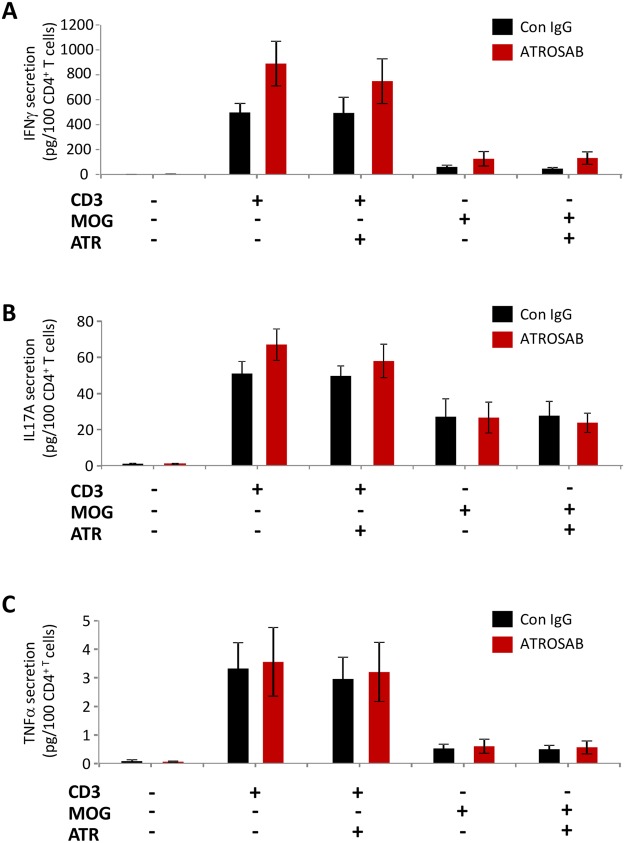
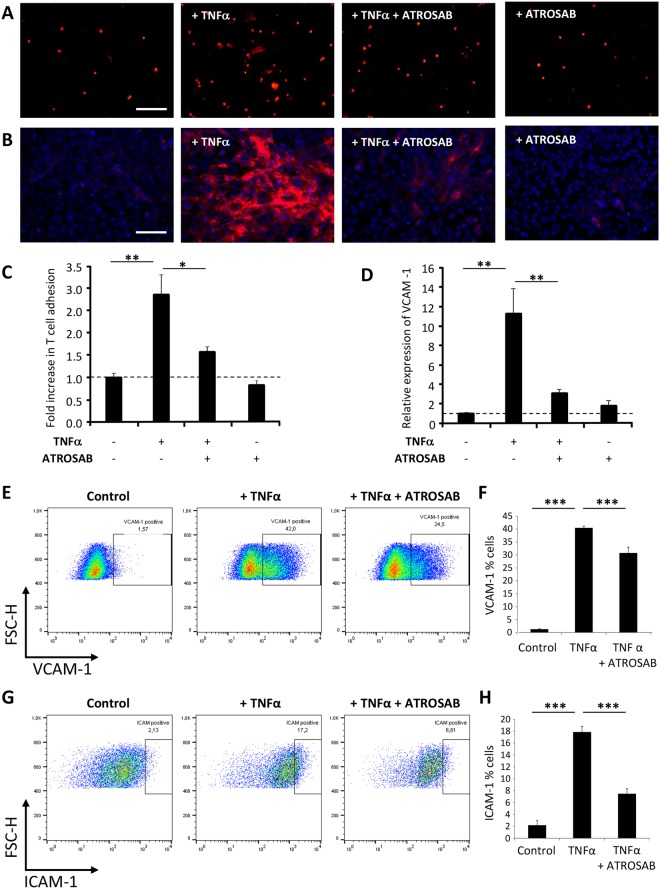
Tumour necrosis factor (TNF) signalling is mediated via two receptors, TNF-receptor 1 (TNFR1) and TNF-receptor 2 (TNFR2), which work antithetically to balance CNS immune responses involved in autoimmune diseases such as multiple sclerosis. To determine the therapeutic potential of selectively inhibiting TNFR1 in mice with experimental autoimmune encephalomyelitis, we used chimeric human/mouse TNFR1 knock-in mice allowing the evaluation of antagonistic anti-human TNFR1 antibody efficacy. Treatment of mice after onset of disease with ATROSAB resulted in a robust amelioration of disease severity, correlating with reduced central nervous system immune cell infiltration. Long-term efficacy of treatment was achieved by treatment with the parental mouse anti-human TNFR1 antibody, H398, and extended by subsequent re-treatment of mice following relapse. Our data support the hypothesis that anti-TNFR1 therapy restricts immune cell infiltration across the blood-brain barrier through the down-regulation of TNF-induced adhesion molecules, rather than altering immune cell composition or activity. Collectively, we demonstrate the potential for anti-human TNFR1 therapies to effectively modulate immune responses in autoimmune disease.


Conflict of interest statement

R.K., A.H. and K. Pfizenmaier are named inventors of patents covering the ATROSAB technology. A.H. is owner of Baliopharm, which is developing ATROSAB for clinical use. The authors have no additional financial interests. S.K.W., R. Fairless, O.M., P.C.L., K. Pichi, R. Fischer, U.L.M.E., B.W., N.R., P-O.C. and R.D. declare no potential conflict of interest.

Figures

Figure 1
Figure 1
Treatment of EAE with ATROSAB reduces disease severity. (A) Wild type C57BL/6 J mice (n = 6) and hu/m TNFR1ki (n = 5) mice were both immunized with MOG35−55 and the course of EAE followed until 28 days after disease onset. No difference was seen between the courses of EAE in the two strains of mice. (B) Weight loss was also assessed, again revealing no differences between the mouse strains. (C) hu/m TNFR1ki mice were treated by intra-peritoneal injection with either 20 mg/kg ATROSAB (n = 6) or a corresponding control IgG (n = 5) on days 1, 4, 8 and 12 of manifest EAE and followed until day 28 of EAE. ATROSAB treatment led to a significant reduction in disease severity from the third day of EAE onwards. (D) Assessment of EAE-associated weight loss similarly revealed a significant improvement in the mice receiving 20 mg/kg ATROSAB. (E) Analysis of individual EAE scores of ATROSAB-treated mice from the experiment shown in panels C/D. Two mice (green diamonds) out of 6 appear to stop responding to treatment by the end of the experiment at day 28 of EAE. (F) Blood sera samples from these ATROSAB-treated mice were assessed for the presence of anti-ATROSAB antibodies by ELISA, demonstrating a positive correlation between anti-drug antibody levels and disease severity at experiment end (Pearson correlation coefficient of 0.75). All EAE studies were repeated, with one representative experiment being shown. */**p < 0.05/0.01.
Figure 2
Figure 2
Treatment of EAE with ATROSAB improves histopathological alterations associated with the acute phase of EAE. Mice were treated with either 20 mg/kg ATROSAB (C,F,I,L,O) or a corresponding control IgG (B,E,H,K,N) on days 1 and 4 of EAE, and sacrificed during the acute phase of the disease on either day 5 or 6 of EAE. (A) Analysis of demyelination by staining of spinal cord sections with luxol fast blue (LFB) showed that ATROSAB significantly reduced spinal cord demyelination. (D) Acute axonal injury, as indicated by immunohistochemistry using an antibody again APP was reduced, though non-significantly, in the ATROSAB-treated group. (G) Infiltration of T cells into the spinal cord was reduced, again non-significantly, in the ATROSAB-treated group. As detected by immunohistochemistry, the presence of Mac-3+ activated microglia and macrophages in the spinal cord (J) was significantly reduced following ATROSAB treatment as was the infiltration of CD45R+ B cells (M). *p < 0.05, **p < 0.01. n = 6 per group. Scale bars C, I, L, O = 200 µm; F = 100 µm.
Figure 3
Figure 3
Treatment of EAE with ATROSAB improves histopathological alterations associated with the chronic phase of EAE. Mice were treated with either 20 mg/kg ATROSAB (B,E,H,K) or a corresponding control IgG (C,F,I,L) on days 1, 4, 8 and 12 of EAE, and sacrificed during the chronic phase of the disease on day 28 of EAE. (A) Analysis of demyelination by staining of spinal cord sections with LFB showed that ATROSAB significantly reduced spinal cord demyelination in mice not developing anti-drug antibodies (ADAs). (D) Axonal injury, as indicated by immunohistochemistry using an antibody against APP, was significantly reduced in the ATROSAB-treated group and was highly significant in treated mice which didn’t develop ADAs. Infiltration of CD3+ T cells (G) into the spinal cord was significantly reduced in ATROSAB treated mice which didn’t develop ADAs, but was significantly elevated in those that did. The presence of Mac-3+ activated microglia and macrophages (J) was not significantly altered between mice receiving either Con IgG or ATROSAB, although a significant elevation was seen in the sub-group which developed ADAs. *p < 0.05, **p < 0.01. n = 5 (con IgG) and 6 (ATROSAB). Scale bars C, I, L = 200 µm; F = 100 µm.
Figure 4
Figure 4
Long term treatment of EAE with anti-TNFR1 therapy is beneficial over an extended time frame. To prevent the occurrence of anti-drug antibodies, mice were treated with either H398, a mouse monoclonal antibody highly selective for human TNFR1 or control IgG on days 1, 4, 8 and 12 of manifest EAE. (A) H398-treated mice had reduced spinal cord deficits until approximately day 35 of EAE, at which point half the group received a further injection of 20 mg/kg H398 (re-treatment), and half received control IgG (no re-treatment) (relapse phase marked with light green bar). Those receiving H398 showed an improvement in disease severity which lasted approximately 20 days, after which mice underwent a further relapse (relapse phase marked with dark green bar) and were again treated with 20 mg/kg H398 or control IgG. Histopathological analyses of spinal cord were performed on all mice at day 85 of EAE and representative images shown from control IgG-treated mice (C,G,K,O), H398 + re-treatment (D,H,L,P) and H398 + no re-treatment (E,I,M,Q). Although demyelination (B–E) or T cell numbers (J–M) were not significantly affected by H398 re-treatment, mice which underwent a relapse following H398 treatment but no subsequent re-treatment had a significant elevation in the extent of axonal injury (F–I) and presence of activated microglia/macrophages (N–Q) than mice which underwent further H398 injections upon relapse (re-treated). *p < 0.05, **p < 0.01. n, control = 6; H398 + re-treatment = 3; H398 no re-treatment = 3. Scale bars = 200 µm.
Figure 5
Figure 5
Peripheral and central immune cell phenotypes are not altered following anti-TNFR1 treatment. MNCs, isolated from the CNS (pooled brain and spinal cord; (A), and splenocytes (C) were collected on days 5 and 6 of acute EAE from mice treated with either ATROSAB or control IgG. Following gating for CD45+ CD4+ cells, FACS analysis was performed to determine the percentage of those co-expressing markers of either TH1 (IFNγ), TH17 (IL-17), or Tregs (FoxP3). In addition, following gating for CD45+ cells from the CNS (B) and spleen (D) on days 5 and 6 of acute EAE, cells were assessed for markers of monocytes (CD11b). No differences could be seen between cells from the two treatment groups (n = 4 mice per group). In addition, immunohistochemistry was performed to determine the percentage of CD3+ spinal cord infiltrates (black) co-expressing FoxP3 (brown), in order to identify Tregs. In comparison to control-treated animals, no difference was seen in the percentage of CD3+FoxP3+ cells in the ATROSAB-treated groups at either the acute (FG) or chronic (HJ) disease stages. n = 6 per group. ATR, ATROSAB; CON, control IgG. Scale bar = 200 µm.
Figure 6
Figure 6
T cell cytokine secretion is unchanged by anti-TNFR1 treatment. T cells were isolated from lymph nodes following the second injection of ATROSAB/control IgG on days 5 or 6 of acute EAE. Following isolation and purification, T cells were re-stimulated with either anti-CD3 or MOG35−55 and ELISAs performed for IFNγ (A), IL17A (B) and TNFα (C). However, no differences were seen between T cells from both treatment groups in the secretion of either cytokine. n = 6 per treatment. ATR, ATROSAB.
Figure 7
Figure 7
Anti-TNFR1 treatment reduces TNFα-induced T cell adhesion and endothelial cell adhesion molecule expression. (A) An adhesion assay of DiI-labelled T cells (red) was performed using a human brain endothelial cell line (hCMEC/D3) which was grown to confluency and pre-activated as indicated prior to the assay. (C) Quantification revealed that 24 hour pre-treatment with huTNFα significantly increased the number of adherent T cells, but not when co-treated with ATROSAB. (B) Similarly, 24 hour treatment of hCMEC/D3 cells with huTNFα resulted in a robust production of VCAM-1 (red), which was essentially blocked by ATROSAB co-treatment, as quantified in (D). Dapi counter-staining (blue) indicates the endothelial cell nuclei. Measurement of surface (E) VCAM-1 and (G) ICAM-1 expression on hCMEC/D3 cells was assessed by flow cytometry, with quantification given in (F,H), respectively, showing a significant reduction in TNFα-induced upregulation by co-incubation with ATROSAB. Scale bars = 100 µm. *p < 0.05, **p < 0.01, ***p < 0.001. (C,D), n = 4 per treatment, representative experiment of 2; (F), n = (control) 7, (TNFα) 7, and (TNFα + ATROSAB) 10; (H), n = (control) 3, (TNFα) 3, (TNFα + ATROSAB) 4.

Similar articles

Cited by

References

    1. Wajant H, Pfizenmaier K, Scheurich P. Tumor necrosis factor signaling. Cell Death Diff. 2003;10:45–65. doi: 10.1038/sj.cdd.4401189. - DOI - PubMed
    1. Probert L. TNF and its receptors in the CNS: The essential, the desirable and the deleterious effects. Neuroscience. 2015;302:2–22. doi: 10.1016/j.neuroscience.2015.06.038. - DOI - PubMed
    1. Kontermann RE, Scheurich P, Pfizenmaier K. Antagonists of TNF action: clinical experience and new developments. Expert Opin. Drug Discov. 2009;4:279–292. doi: 10.1517/17460440902785167. - DOI - PubMed
    1. Dendrou CA, Fugger L, Friese MA. Immunopathology of multiple sclerosis. Nat. Rev. Immunol. 2015;15:545–558. doi: 10.1038/nri3871. - DOI - PubMed
    1. Hauser SL, Doolittle TH, Lincoln R, Brown RH, Dinarello CA. Cytokine accumulations in CSF of multiple sclerosis patients: frequent detection of interleukin-1 and tumour necrosis factor but not interkeukin-6. Neurology. 1990;40:1735–1739. doi: 10.1212/WNL.40.11.1735. - DOI - PubMed

Publication types

MeSH terms

Substances