. 2018 Nov;596(21):5281-5298.
doi: 10.1113/JP276370. Epub 2018 Oct 8.

Complex and spatially segregated auditory inputs of the mouse superior colliculus

Affiliations

Complex and spatially segregated auditory inputs of the mouse superior colliculus

Veronika Bednárová et al. J Physiol. 2018 Nov.

Abstract

Key points: Although the visual circuits in the superior colliculus (SC) have been thoroughly examined, the auditory circuits lack equivalent scrutiny. SC neurons receiving auditory inputs in mice were characterized and three distinguishable types of neurons were found. The auditory pathways from external nuclei of the inferior colliculus (IC) were characterized, and a novel direct inhibitory connection and an excitation that drives feed-forward inhibitory circuits within the SC were found. The direct excitatory and inhibitory inputs exhibited distinct arbourization patterns in the SC. These findings suggest functional differences between excitatory and inhibitory sensory information that targets the auditory SC.

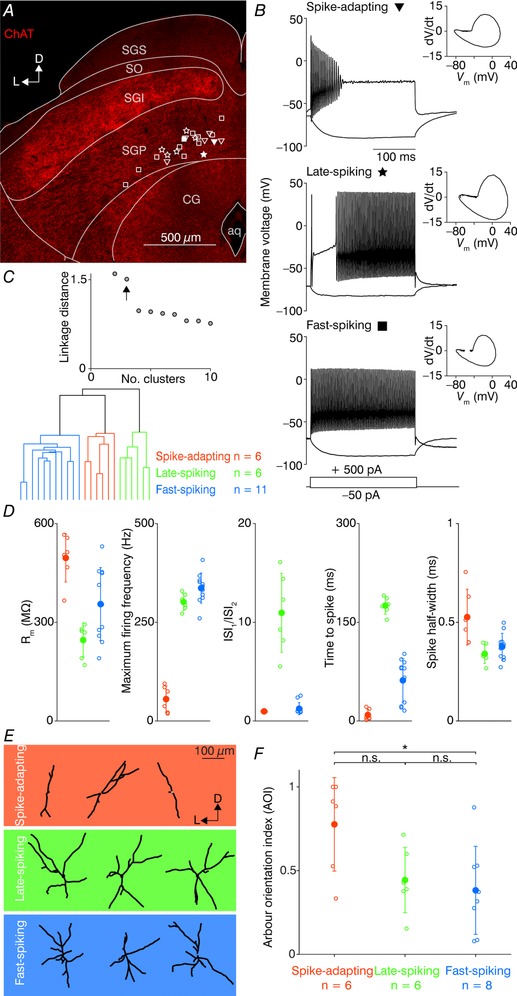
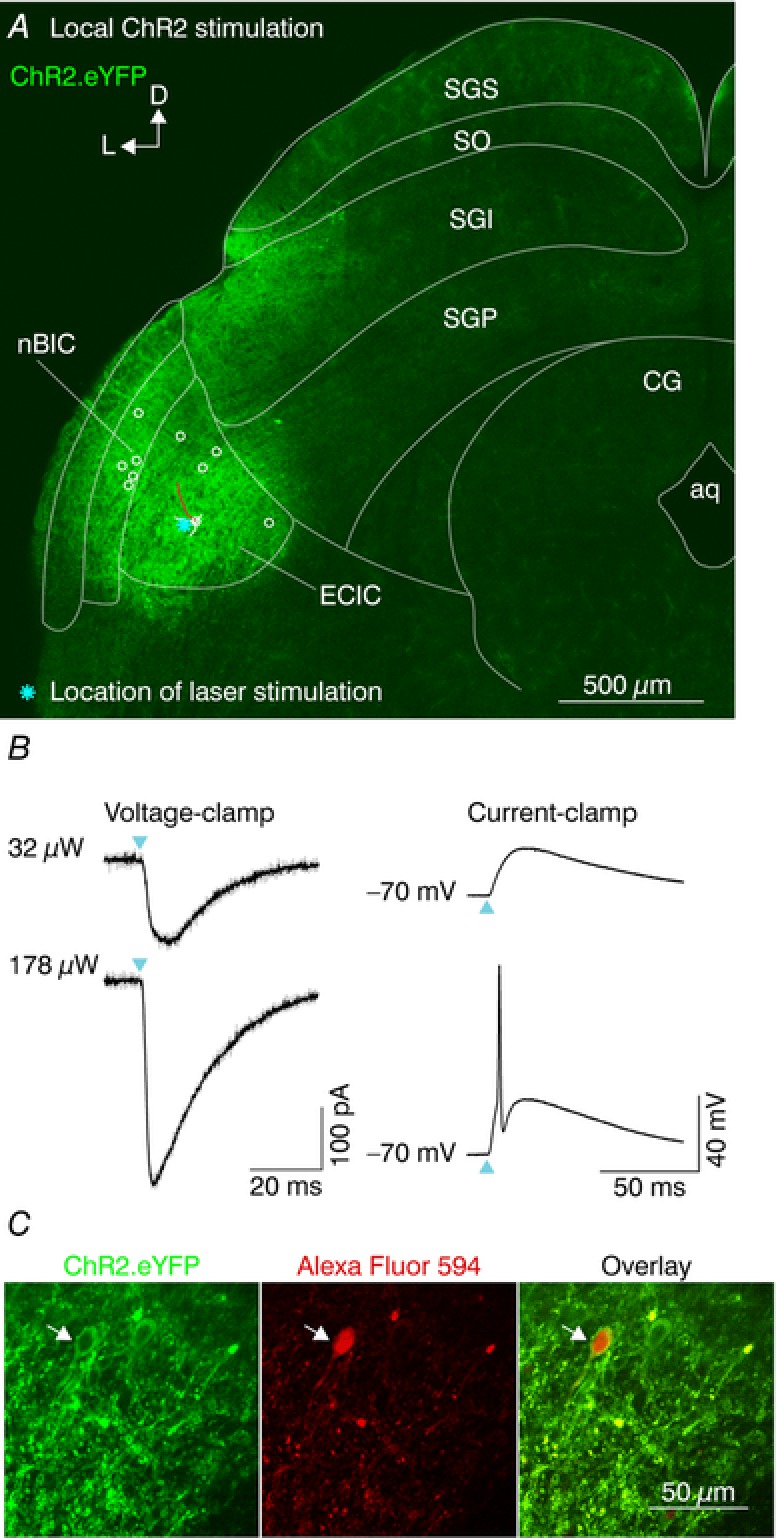
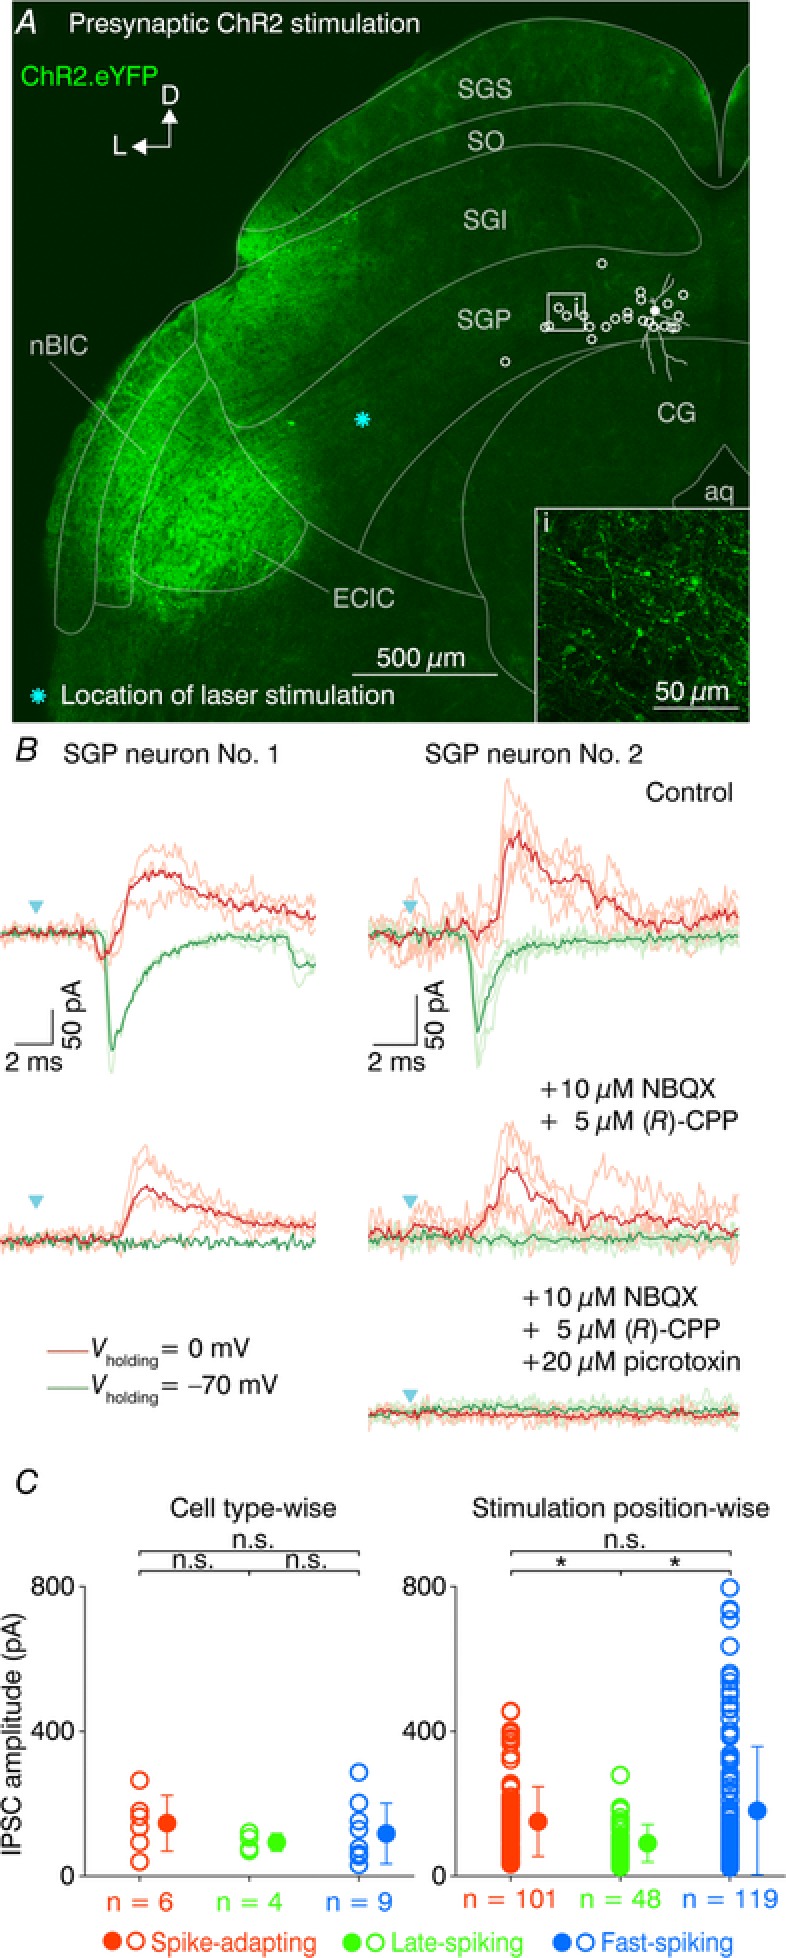
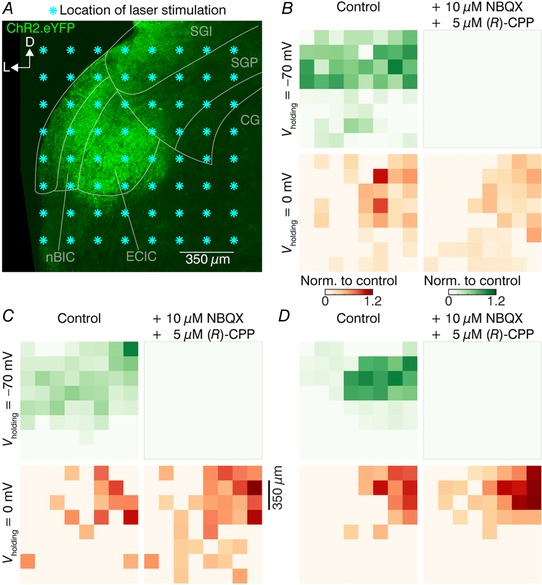
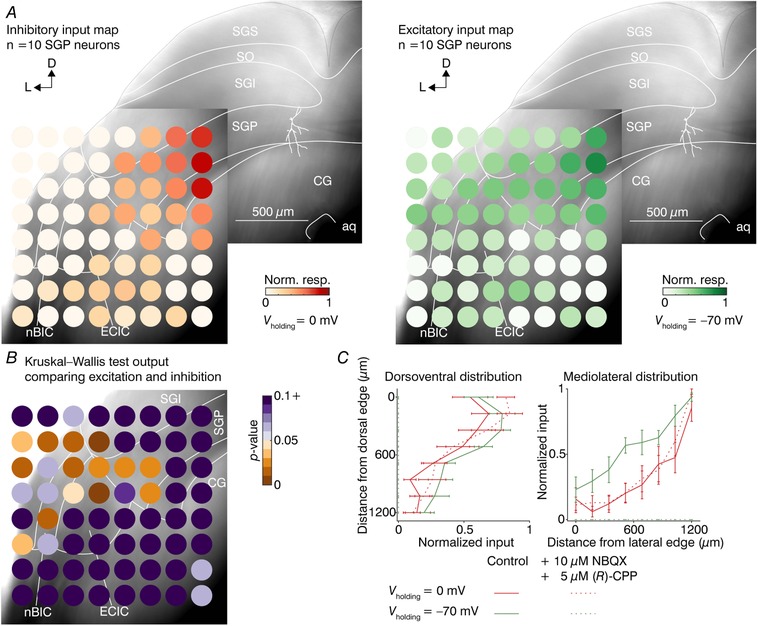
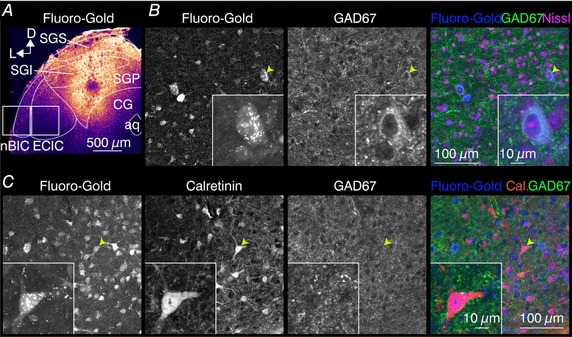
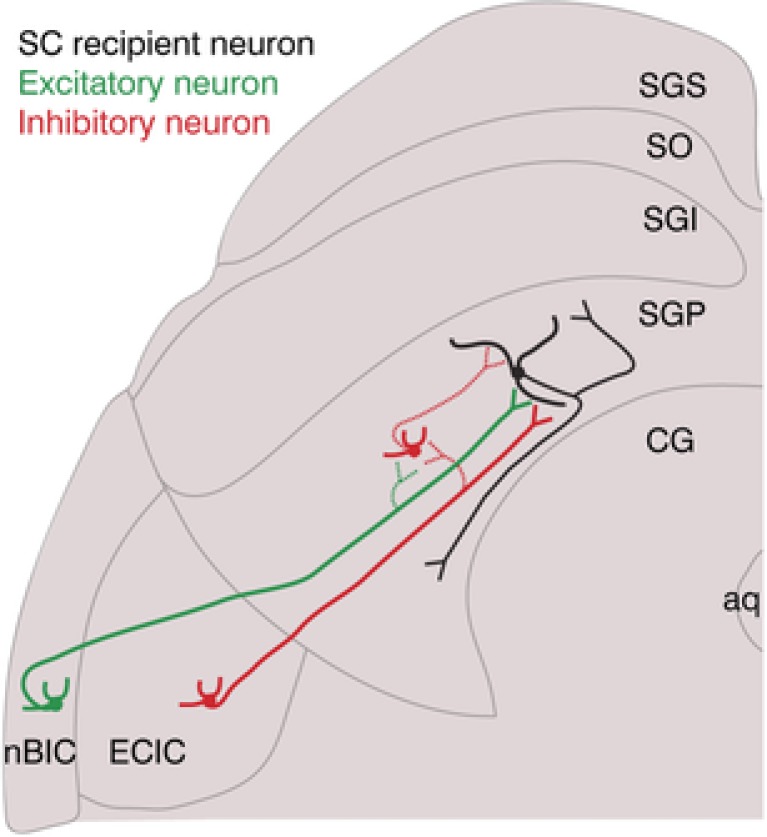
Abstract: The superior colliculus (SC) is a midbrain structure that integrates auditory, somatosensory and visual inputs to drive orientation movements. While much is known about how visual information is processed in the superficial layers of the SC, little is known about the SC circuits in the deep layers that process auditory inputs. We therefore characterized intrinsic neuronal properties in the auditory-recipient layer of the SC (stratum griseum profundum; SGP) and confirmed three electrophysiologically defined clusters of neurons, consistent with literature from other SC layers. To determine the types of inputs to the SGP, we expressed Channelrhodopsin-2 in the nucleus of the brachium of the inferior colliculus (nBIC) and external cortex of the inferior colliculus (ECIC) and optically stimulated these pathways while recording from SGP neurons. Probing the connections in this manner, we described a monosynaptic excitation that additionally drives feed-forward inhibition via circuits intrinsic to the SC. Moreover, we found a profound long-range monosynaptic inhibition in 100% of recorded SGP neurons, a surprising finding considering that only about 15% of SGP-projecting neurons in the nBIC/ECIC are inhibitory. Furthermore, we found spatial differences in the cell body locations as well as axon trajectories between the monosynaptic excitatory and inhibitory inputs, suggesting that these inputs may be functionally distinct. Taking this together with recent anatomical evidence suggesting an auditory excitation from the nBIC and a GABAergic multimodal inhibition from the ECIC, we propose that sensory integration in the SGP is more multifaceted than previously thought.

Keywords: Auditory pathways; Mouse; Neural circuits; Superior colliculus.


Figures

Figure 1
Figure 1. Identification of three SGP neuron types on the basis of their electrophysiological and morphological properties
A, confocal image of a brain slice stained for choline acetyltransferase (ChAT) showing the major divisions of the SC. The locations of all recorded SGP neurons are displayed by open symbols, where triangles correspond to the spike‐adapting neurons, stars to the late‐spiking neurons and squares to the fast‐spiking neurons. The filled symbols are the locations of the representative three SGP neurons shown in B. aq, aqueduct; CG, central grey; D, dorsal; L, lateral; SGI, stratum griseum intermediale; SGP, stratum griseum profundum; SGS, stratum griseum superficiale; SO, stratum opticum. B, example traces for representative SGP neurons in response to a 250 ms depolarizing (+500 pA) and a hyperpolarizing (−50 pA) current step. Insets show phase‐plane plots of the first fired AP. C, top, linkage distance of the hierarchical clustering as a function of the increasing cluster number. Arrow indicates the linkage distance for three clusters. Bottom, dendrogram plot of hierarchical binary cluster tree. Colour code in C applies to D, the background colour in E, and F. D, cluster‐wise plots of the following intrinsic parameters (from left to right): input resistance (R m), maximum firing frequency at the current step of +700 pA, ratio of the first to second inter‐spike intervals in a train of APs (ISI1/ISI2), time to first spike from the current onset at threshold traces, the half‐width of the first fired AP. Open circles represent individual neurons; filled circles represent the cluster mean ± SD. E, traced dendrites of three example neurons for each electrophysiologically defined cluster. Orientation axes (L, lateral; D, dorsal) are relative to the dorsal SC surface. F, arbour orientation indices (AOIs) of the defined clusters. Open circles represent individual neurons; filled circles represent the cluster mean ± SD. * P < 0.05; n.s., not significant (Kruskal–Wallis test).
Figure 2
Figure 2. Optical activation of ChR2‐positive neurons in the nBIC/ECIC
A, confocal image of a brain slice showing eYFP fluorescence in the nBIC/ECIC. An example ECIC neuron was partially traced (white lines, dendrites and soma; red line, axon). Locations of all nBIC (n = 5) and ECIC (n = 5) neurons are shown with open circles. Cyan asterisk shows the laser position for an example ECIC recording shown in B. B, example recording of local ChR2 stimulation. Voltage‐clamp (left, V holding = −70 mV) and current‐clamp (right) recordings of an ECIC neuron at low (top) and high (bottom) laser intensities. Cyan triangles indicate the laser onset. Grey and black traces represent individual trials and the average, respectively. C, two‐photon images of a recorded neuron located in the ECIC (white arrow) showing ChR2.eYFP fluorescence (left), Alexa Fluor 594 fluorescence (middle) filled via the patch pipette, and their overlay (right).
Figure 3
Figure 3. Optical activation of ChR2‐positive axons in the nBIC/ECIC–SGP circuit
A, confocal image of a brain slice showing ChR2.eYFP fluorescence in the nBIC/ECIC. Higher magnification reveals eYFP‐positive axons projecting into the SGP (inset). In presynaptic ChR2 stimulation, the locations of all recorded SGP neurons are shown by open circles. The filled circle denotes an SGP neuron whose voltage‐clamp recordings are presented in (B, left). Cyan asterisk shows the laser position. B, voltage‐clamp recordings of two SGP neurons and presynaptic ChR2 stimulation. An EPSC (green traces, V holding = −70 mV) and an IPSC (red traces, V holding = 0 mV) were recorded in control conditions (top), after NBQX and (R)‐CPP wash‐in (middle), and after picrotoxin wash‐in (bottom, right). Lighter and darker traces represent individual trials and averages, respectively. Cyan triangles indicate the laser onset. Key applies to both recordings. C, strength of direct inhibition on SGP neurons cell type‐wise and stimulation position‐wise. The open circles in the cell type‐wise plot (left) show average IPSC amplitude of a given SGP neuron, and the filled circles show the cell cluster mean ± SD. In the stimulation position‐wise plots (right), the open and filled circles denote the IPSC amplitude of a given stimulation position and their mean ± SD, respectively. * P < 0.05; n.s., not significant (two‐sample Kolmogorov–Smirnov test).
Figure 4
Figure 4. ChR2‐assisted circuit mapping of the nBIC/ECIC–SGP circuit
A, confocal eYFP image of a brain slice with the mapped area covering the nBIC/ECIC for the example SGP neuron recording in B. Each asterisk indicates a location of the laser stimulation grid. Recorded neurons were located at least 400 μm dorsomedially from the nearest stimulation point. B–D, excitatory (V holding = −70 mV, top) and inhibitory (V holding = 0 mV, bottom) input maps created from voltage‐clamp recordings for three example SGP neurons. Left and right maps were recorded in control conditions and in the presence of the drugs, respectively. All values are normalized to the maximum value of their respective control condition maps. Note that the post‐drugs excitatory maps (upper right map) are by definition zero as excitation was pharmacologically blocked.
Figure 5
Figure 5. Mapping the locations of the excitatory and the inhibitory nBIC/ECIC inputs to SGP neurons
A, montage of two Dodt gradient contrast images with direct inhibitory (left) and excitatory (right) input maps averaged for 10 SGP neurons. Each circle represents the mean (n = 10 neurons) of the non‐zero post‐drugs inhibitory responses (left, red colour scale) and control excitatory responses (right, green colour scale). An example traced neuron (white lines) in the SGP is shown for orientation. Note that in this case, the inhibition was normalized to the drugs condition. B, Dodt gradient contrast image with heat map of P‐values calculated by performing position‐wise Kruskal–Wallis tests on the direct inhibitory and excitatory values of data shown in A. C, quantification of the input distributions in the dorsoventral (left) and mediolateral (right) axes, averaged across 10 SGP neurons. Each point along the line is the mean ± SEM of the maximal response for one of the eight dorsoventral and mediolateral positions relative to the edge of the slice.
Figure 6
Figure 6. Retrogradely traced nBIC/ECIC neurons and their immunoreactivity for GAD67 and calretinin
A, confocal image of the Fluoro‐Gold injection site in the SGP of the mouse SC. Retrogradely filled neurons were counted in the example highlighted tiles roughly corresponding to the nBIC and the ECIC. B, higher magnification images of a region within the ECIC with Fluoro‐Gold filled neurons and their immunoreactivity for GAD67. Neuron highlighted by the arrow is shown in the inset. Data are summarized in Table 3. C, higher magnification images of a region within the nBIC with Fluoro‐Gold filled neurons and their immunoreactivity for calretinin and GAD67. Neuron highlighted by the arrow (positive for calretinin, negative for GAD67) is shown in the inset. Data are summarized in Table 4.
Figure 7
Figure 7. Proposed schema of the nBIC/ECIC projections into the mouse SC
In addition to a direct excitatory projection from the nBIC (green excitatory neuron) to the SGP‐residing neuron (black), a direct inhibitory connection originating in the ECIC (red inhibitory neuron) is also present. Secondly, a feed‐forward inhibitory connection is mediated by an axonal branch of the direct excitation (dotted green synapse) possibly involving an SGP‐residing inhibitory interneuron (dotted inhibitory connection within the SGP). Thirdly, a direct inhibitory synapse (dotted red synapse) onto an SGP‐residing inhibitory interneuron. Dotted synapses are only proposed. Note that the excitatory projection from the ECIC is not shown, and the inhibitory ECIC neuron presumably has more axonal collaterals than shown.

Similar articles

Cited by

References

    1. Ahmadlou M & Heimel JA (2015). Preference for concentric orientations in the mouse superior colliculus. Nat Commun 6, 6773. - PMC - PubMed
    1. Aitkin LM & Phillips SC (1984). The interconnections of the inferior colliculi through their commissure. J Comp Neurol 228, 210–216. - PubMed
    1. Appell PP & Behan M (1990). Sources of subcortical GABAergic projections to the superior colliculus in the cat. J Comp Neurol 302, 143–158. - PubMed
    1. Chevalier G & Mana S (2000). Honeycomb‐like structure of the intermediate layers of the rat superior colliculus, with additional observations in several other mammals: AChE patterning. J Comp Neurol 419, 137–153. - PubMed
    1. Covey E, Hall WC & Kobler JB (1987). Subcortical connections of the superior colliculus in the mustache bat, Pteronotus parnellii . J Comp Neurol 263, 179–197. - PubMed

Publication types