. 2018 Nov 1;29(22):2737-2750.
doi: 10.1091/mbc.E18-02-0131. Epub 2018 Sep 12.

Geometric partitioning of cohesin and condensin is a consequence of chromatin loops

Affiliations

Geometric partitioning of cohesin and condensin is a consequence of chromatin loops

Josh Lawrimore et al. Mol Biol Cell. .

Abstract

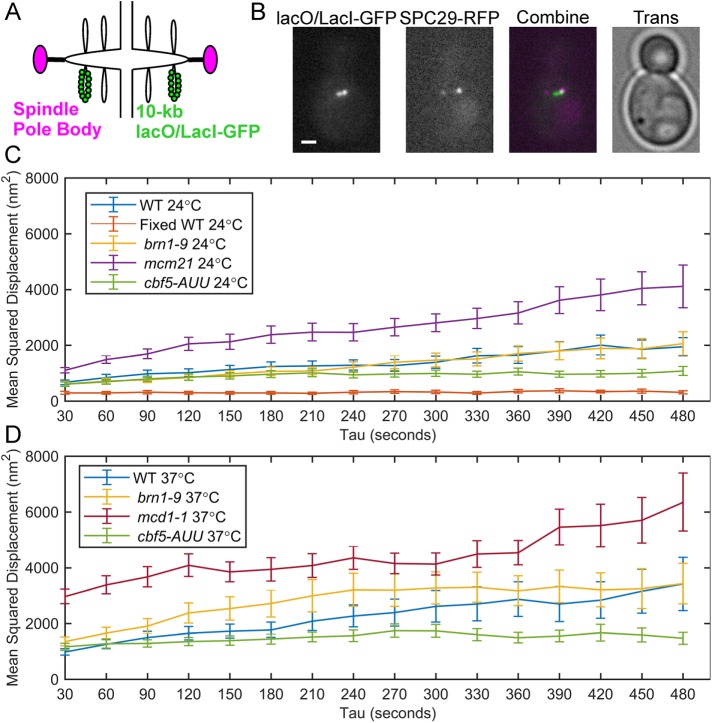
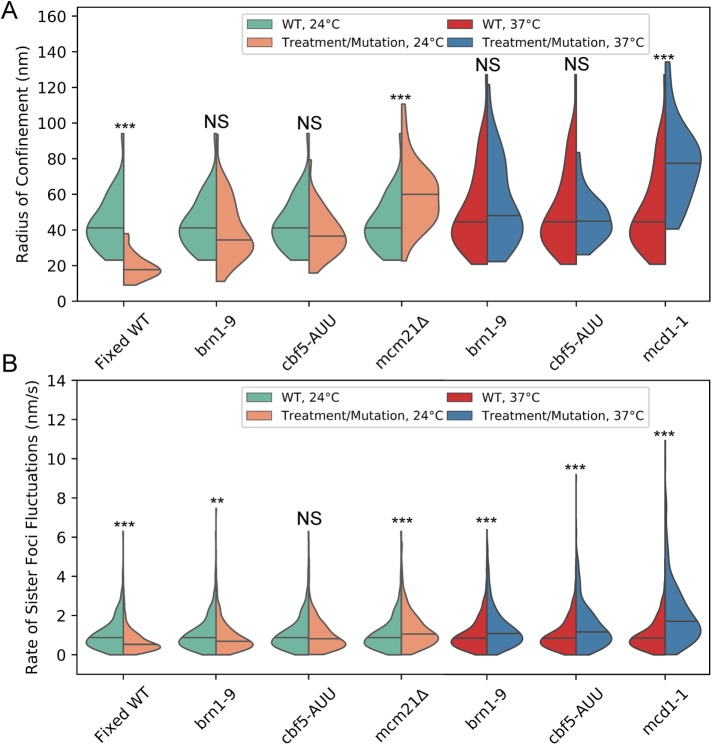
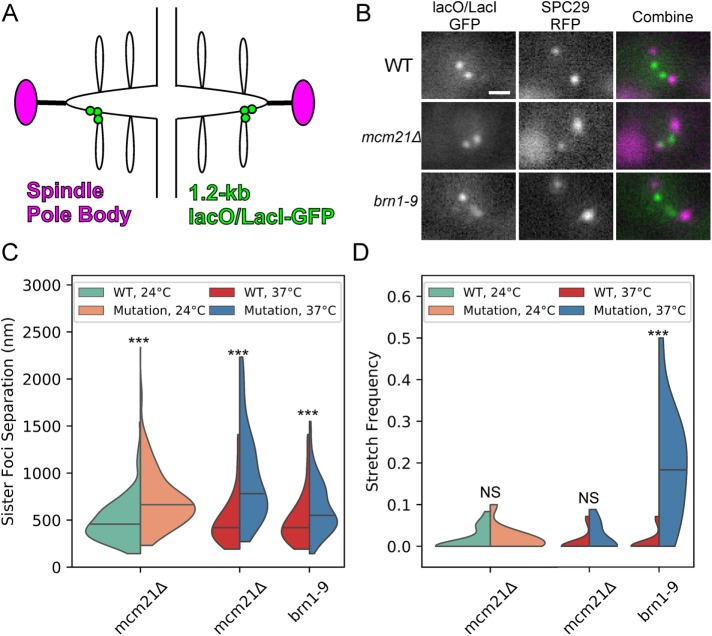
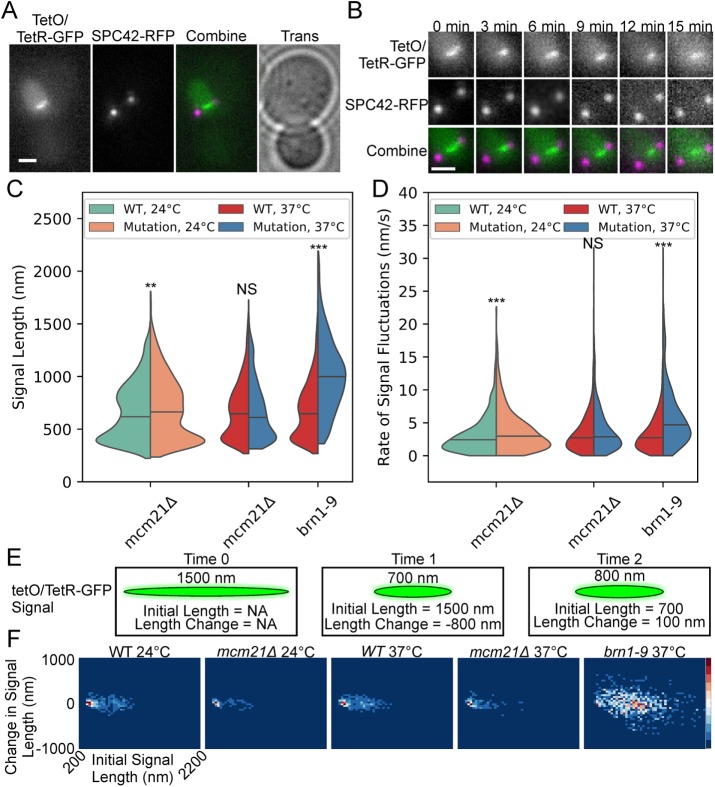
SMC (structural maintenance of chromosomes) complexes condensin and cohesin are crucial for proper chromosome organization. Condensin has been reported to be a mechanochemical motor capable of forming chromatin loops, while cohesin passively diffuses along chromatin to tether sister chromatids. In budding yeast, the pericentric region is enriched in both condensin and cohesin. As in higher-eukaryotic chromosomes, condensin is localized to the axial chromatin of the pericentric region, while cohesin is enriched in the radial chromatin. Thus, the pericentric region serves as an ideal model for deducing the role of SMC complexes in chromosome organization. We find condensin-mediated chromatin loops establish a robust chromatin organization, while cohesin limits the area that chromatin loops can explore. Upon biorientation, extensional force from the mitotic spindle aggregates condensin-bound chromatin from its equilibrium position to the axial core of pericentric chromatin, resulting in amplified axial tension. The axial localization of condensin depends on condensin's ability to bind to chromatin to form loops, while the radial localization of cohesin depends on cohesin's ability to diffuse along chromatin. The different chromatin-tethering modalities of condensin and cohesin result in their geometric partitioning in the presence of an extensional force on chromatin.


Figures

FIGURE 1:
FIGURE 1:
Motion analysis of pericentric sister-chromatid foci in ATP-depleted metaphase cells. (A) Schematic of the 10-kb lacO/LacI-GFP array in the pericentric region during metaphase. (B) Representative images (in-focus planes) of ATP-depleted (sodium azide and deoxy-glucose treated) budding yeast cells in metaphase containing lacO/LacI-GFP (green) and SPC29-RFP (magenta). Scale bar is 1 µm. Mean-squared displacement curves of sister lacO/LacI-GFP foci in ATP-depleted, metaphase cells at 24°C (C) and at 37°C (D). Fixed WT 24° are WT cells that were grown at 24°C and fixed with formaldehyde. WT 24°C, n = 36; fixed WT 24°C, n = 42; brn1-9 24°C, n = 46; mcm21Δ 24°C, n = 40; cbf5-AUU 24°C, n = 36; WT 37°C, n = 49; and brn1-9 37°C, n = 42; mcd1-1 37°C, n = 39; and cbf5-AUU 37°C, n = 48 time lapses. Error bars are SEM.
FIGURE 2:
FIGURE 2:
Cohesin confines pericentric chromatin while both cohesin and condensin limit rate of sister foci fluctuations. (A) Violin plot of the radii of confinement of the 10-kb lacO/LacI-GFP array in the pericentric region during metaphase (generated from the same data as Figure 1, B and C). The black line represents the median and the colored shapes are a smoothed histogram of the distribution of each strain’s radii of confinement. Wilcoxon rank-sum test (two-sided) p values compared with WT at corresponding temperature: Fixed WT 24°C = 2 × 10⁻¹², brn1-9 24°C = 0.2, cbf5-AUU 24°C = 0.1, mcm21Δ 24°C = 2 × 10⁻⁵, brn1-9 37°C = 0.4, cbf5-AUU 37°C = 0.8, and mcd1-1 37°C = 7 × 10⁻⁷. (B) Violin plot of the rate of sister foci fluctuations. WT 24°C, n = 459; fixed WT 24°C, n = 538, brn1-9 24°C, n = 546; cbf5-AUU 24°C, n = 447; mcm21Δ 24°C, n = 459; WT 37°C, n = 605; and brn1-9 37°C n = 543, cbf5-AUU 37°C, n = 620; and mcd1-1, 37°C, n = 482; persistent motion events. Wilcoxon rank-sum test (two-sided) p values compared with WT at corresponding temperature: Fixed WT 24°C = 1 × 10⁻¹⁵, brn1-9 24°C = 0.002, cbf5-AUU 24°C = 0.4, mcm21Δ 24°C = 9 × 10⁻⁶, brn1-9 37°C = 2 × 10⁻⁸, cbf5-AUU 37°C = 6 × 10⁻¹², and mcd1-1 37°C = 8 × 10−41. Multiple comparisons of WT data (four for 24°C and three for 37°C) to mutants was corrected using the Bonferroni correction (see Materials and Methods) such that NS is p ≥ 0.05/number of comparisons, ** is p < 0.01/number of comparisons, and *** is p < 0.001/number of comparisons.
FIGURE 3:
FIGURE 3:
Condensin, not cohesin, stiffens endogenous pericentric chromatin. (A) Schematic of the 1.2-kb lacO/LacI-GFP array in pericentric region during metaphase. (B) Representative images of lacO/LacI-GFP array (green in Combine) and SPB protein SPC29-RFP (magenta in Combine). Scale bar is 1 µm. (C) Violin plot of mean sister foci separation. The black line is the median of the distribution and the colored shapes are smoothed histograms of the distribution of sister foci separation for each strain. WT 24°C, n = 164; mcm21Δ 24°C, n = 156; WT 37°C, n = 74; mcm21Δ 37°C, n = 84; and brn1-9 37°C, n = 97 cells. Wilcoxon rank-sum test (two-sided) p values compared with WT at corresponding temperature: mcm21Δ 24°C = 5 × 10⁻¹⁴, mcm21Δ 37°C = 5 × 10⁻¹³, and brn1-9 37°C = 3 × 10⁻⁴. (D) Violin plot of mean stretch frequency. The black line is the median of the distribution and the colored shapes are smoothed histograms of the distribution of signal stretch frequency for each strain. WT 24°C, n = 18; mcm21Δ 24°C, n = 11; WT 37°C, n = 16; mcm21Δ 37°C, n = 11; and brn1-9 37°C, n = 16 image sets. Wilcoxon rank-sum test (two-sided) p values compared with WT at corresponding temperature: mcm21Δ 24°C = 0.6, mcm21Δ 37°C = 0.2, and brn1-9 37°C = 1 × 10⁻⁵. Multiple comparisons of WT 37°C to mutants was corrected using Bonferroni correction.
FIGURE 4:
FIGURE 4:
Condensin condenses and stiffens pericentric chromatin via loop formation. Representative image (A) and montage (B) of a cell containing the fluorescently labeled, conditional dicentric plasmid pT431 and SPB protein SPC42-RFP. The tetO/TetR-GFP image (green in Combine) and the SPC42-RFP image (magenta in Combine) are maximum intensity projections. The Trans image (A) is the in-focus plane. Scale bars are 1 µm. (C) Violin plot of signal lengths of tetO/TetR-GFP array from time lapses. The black line is the median of the distribution and the colored shapes are smoothed histograms of the distribution of signal length for each strain. WT 24°C, n = 1732; mcm21Δ 24°C, n = 1455; mcm21Δ 37°C, n = 1171; WT 37°C, n = 1887; and brn1-9 37°C, n = 838 plasmid signals. Wilcoxon rank-sum test (two-sided) p values compared with WT at corresponding temperature: mcm21Δ 24°C = 0.01, mcm21Δ 24°C = 0.3, and brn1-9 37°C = 3 × 10−121. (D) Violin plot of the rates of signal fluctuations of tetO/TetR-GFP array from time lapses. The black line is the median of the distribution and the colored shapes are smoothed histograms of the distribution of the rates of signal fluctuations for each strain. WT 24°C, n = 1041; mcm21Δ 24°C, n = 881; mcm21Δ 37°C, n = 666; WT 37°C, n = 1101; and brn1-9 37°C, n = 495 extension/compaction events. Wilcoxon rank-sum test (two-sided) p values compared with WT at corresponding temperature: mcm21Δ 24°C = 1 × 10⁻⁵, mcm21Δ 37°C = 0.05, and brn1-9 37°C = 3 × 10⁻³¹. (E) Illustration of three frames of a time lapse of the tetO/TetR-GFP array on the dicentric plasmid pT431. The signal length at the current time point is displayed above the signal. The initial signal is the length of the signal of the previous time point (X axis in panel F). The length change is the difference between the signal length at the current time point and the previous time point (Y axis in panel F). (F) Probability density maps of change in signal length as a function of initial signal length. Red is most dense; blue is least dense.
FIGURE 5:
FIGURE 5:
ChromoShake simulations and corresponding simulated fluorescent images of the dicentric plasmid pT431. Three-dimensional visualizations of simulated dicentric plasmids without condensin (A), with static condensin (white beads; B), and dynamic condensin (white beads; C). (D–F) Simulation visualizations overlaid with simulated fluorescent images of the tetO/TetR-GFP array generated by Microscope Simulator 2.
FIGURE 6:
FIGURE 6:
Static and dynamic condensin-mediated loops compact and alter fluctuation rate of simulated dicentric plasmids. (A) Violin plot of simulated signal lengths. The black line is the median of the distribution and the colored shapes are smoothed histograms of the distribution of simulated signal length for each simulation type. Each simulation type was repeated 10 times using different random seeds. A simulated image stack was generated every 30 s from each simulation (assuming a nuclear viscosity of 141 P; see Materials and Methods) and the signal length was measured using the same analysis as for the experimental images. None, n = 470; three static condensins, n = 470; three dynamic condensins, n = 478; six static condensins, n = 470; and six dynamic condensins, n = 480 simulated plasmid signals. Wilcoxon rank-sum test (two-sided) p values compared with none: three static condensins = 1 × 10⁻¹³, three dynamic condensins = 1 × 10⁻¹⁷, six static condensins = 4 × 10−113, and six dynamic condensins = 2 × 10⁻¹⁶. (B) Violin plot of simulated rates of signal fluctuations. The black line is the median of the distribution and the colored shapes are smoothed histograms of the distribution of the rates of signal fluctuations for each simulation type. None, n = 261; three static condensins, n = 310; three dynamic condensins, n = 342; six static condensins, n = 337; and six dynamic condensins, n = 360 fluctuation rates. Wilcoxon rank-sum test (two-sided) p values compared with none: three static condensins = 1 × 10⁻⁶, three dynamic condensins = 0.001, six static condensins = 2 × 10⁻¹⁹, and six dynamic condensins = 0.005. Bonferroni correction applied to simulation comparisons. (C) Probability density maps of change in simulated signal length as a function of initial simulated signal length.
FIGURE 7:
FIGURE 7:
Condensin creates two force regimes in chromatin. (A) ChromoShake simulations of pericentromeres with or without cohesin and condensin. Initial configurations are in the top panel. Centromeres, the leftmost and rightmost beads, are separated by 800 nm. Middle panels correspond to timepoints indicated by black arrows in B. The bottom panels correspond to final timepoints in B. Each panel is also shown without DNA for clarity. Condensin-binding sites are in white and are shown in each panel. (B) Line plots of radius of gyration of condensin -binding sites over simulation time. Black arrows indicate timepoints before attachment to kinetochore microtubules is introduced. (C) Violin plot of inward force in pericentromere simulations with permanent attachment to kinetochore microtubules with or without cohesin and/or condensin. The black line is the median of the distribution and the colored shapes are smoothed histograms of the distribution of the inward forces for each simulation type. All simulations contained n = 16 sister centromere pairs. Wilcoxon rank-sum test (two-sided) p values as compared with simulation with condensin and with cohesin: without condensin and with cohesin = 2 × 10⁻⁶, with condensin and without cohesin = 5 × 10⁻⁵, and without condensin and without cohesin = 2 × 10⁻⁶. (D) Initial configurations of pericentromere simulations with permanent attachment to kinetochore microtubules where DNA beads are colored based on the mean tension on that bead after the simulation has run for 0.05 s of simulation time. The bead with the most tension in each simulation is white, whereas the bead with the lowest tension is black. The leftmost and rightmost beads are not shown.
FIGURE 8:
FIGURE 8:
Models of WT, mcm21Δ, and brn1-9 pericentric regions. Models of the pericentric region during metaphase (sister strands are gray and black) labeled with the 1.2-kb lacO/LacI-GFP array (green) centered 1.7 kb from the centromere (blue) with either both cohesin (red) and condensin (purple; A), depleted cohesin (B), or disrupted condensin (C).

Similar articles

Cited by

References

    1. Chacon JM, Mukherjee S, Schuster BM, Clarke DJ, Gardner MK. (2014). Pericentromere tension is self-regulated by spindle structure in metaphase. J Cell Biol , 313–324. - PMC - PubMed
    1. Cohen J. (1988). Statistical Power Analysis for the Behavioral Sciences, Hillsdale, NJ: L. Erlbaum Associates.
    1. D’Ambrosio C, Schmidt CK, Katou Y, Kelly G, Itoh T, Shirahige K, Uhlmann F. (2008). Identification of cis-acting sites for condensin loading onto budding yeast chromosomes. Genes Dev , 2215–2227. - PMC - PubMed
    1. Dewar H, Tanaka K, Nasmyth K, Tanaka TU. (2004). Tension between two kinetochores suffices for their bi-orientation on the mitotic spindle. Nature , 93–97. - PubMed
    1. Eckert CA, Gravdahl DJ, Megee PC. (2007). The enhancement of pericentromeric cohesin association by conserved kinetochore components promotes high-fidelity chromosome segregation and is sensitive to microtubule-based tension. Genes Dev , 278–291. - PMC - PubMed

Publication types

MeSH terms

LinkOut - more resources