. 2018 Nov 1;29(22):2644-2655.
doi: 10.1091/mbc.E18-04-0255. Epub 2018 Sep 12.

Layers of regulation of cell-cycle gene expression in the budding yeast Saccharomyces cerevisiae

Affiliations

Layers of regulation of cell-cycle gene expression in the budding yeast Saccharomyces cerevisiae

Christina M Kelliher et al. Mol Biol Cell. .

Abstract

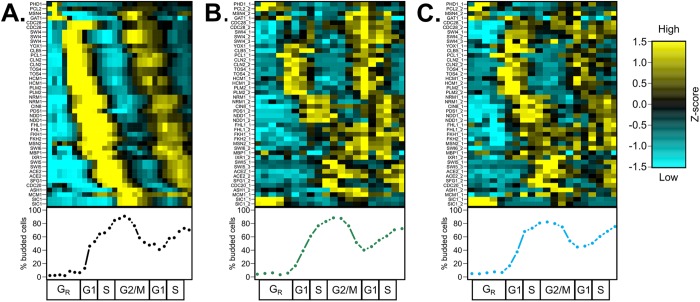
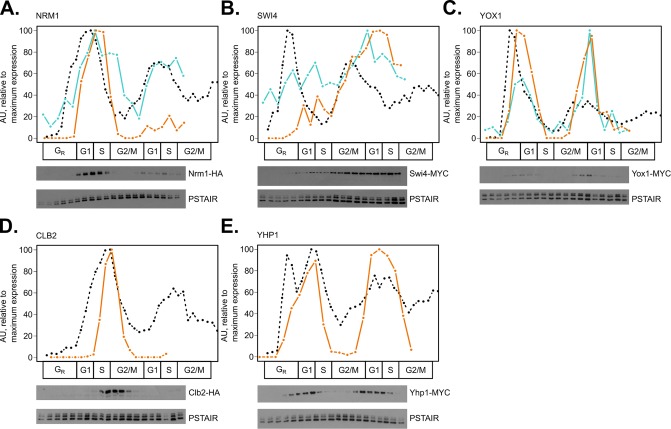
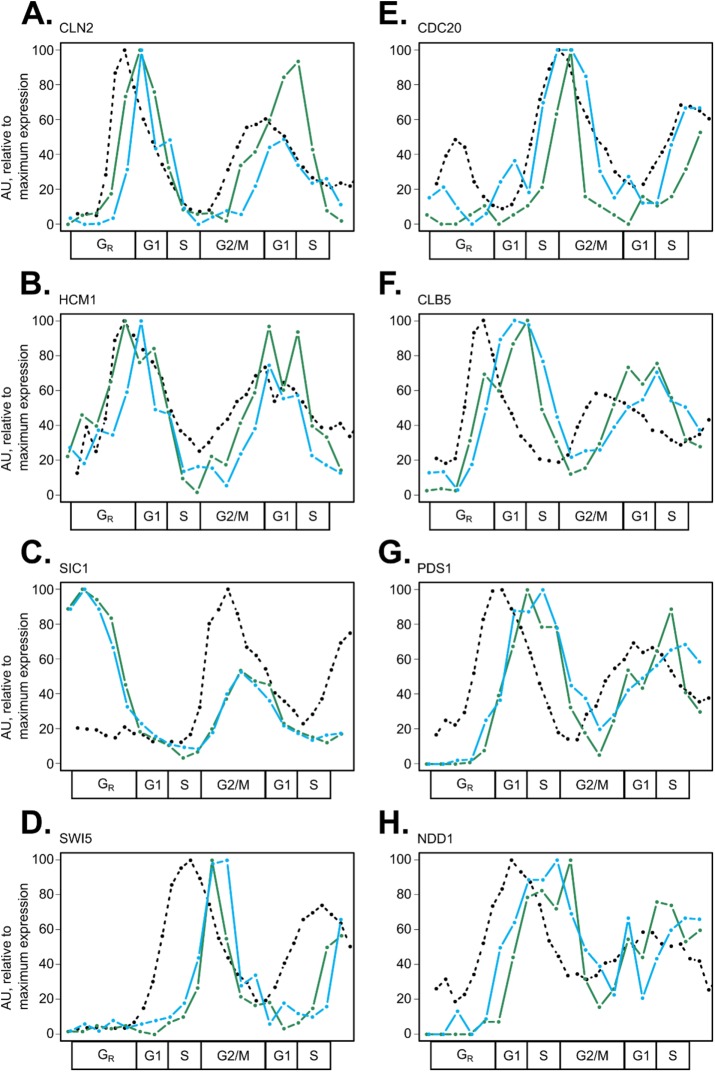
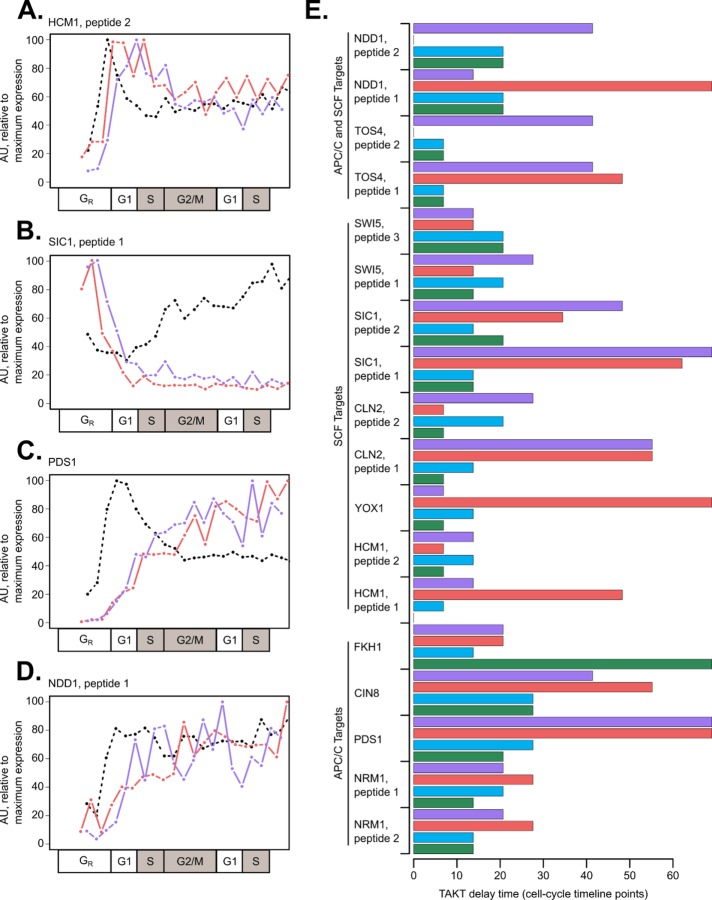
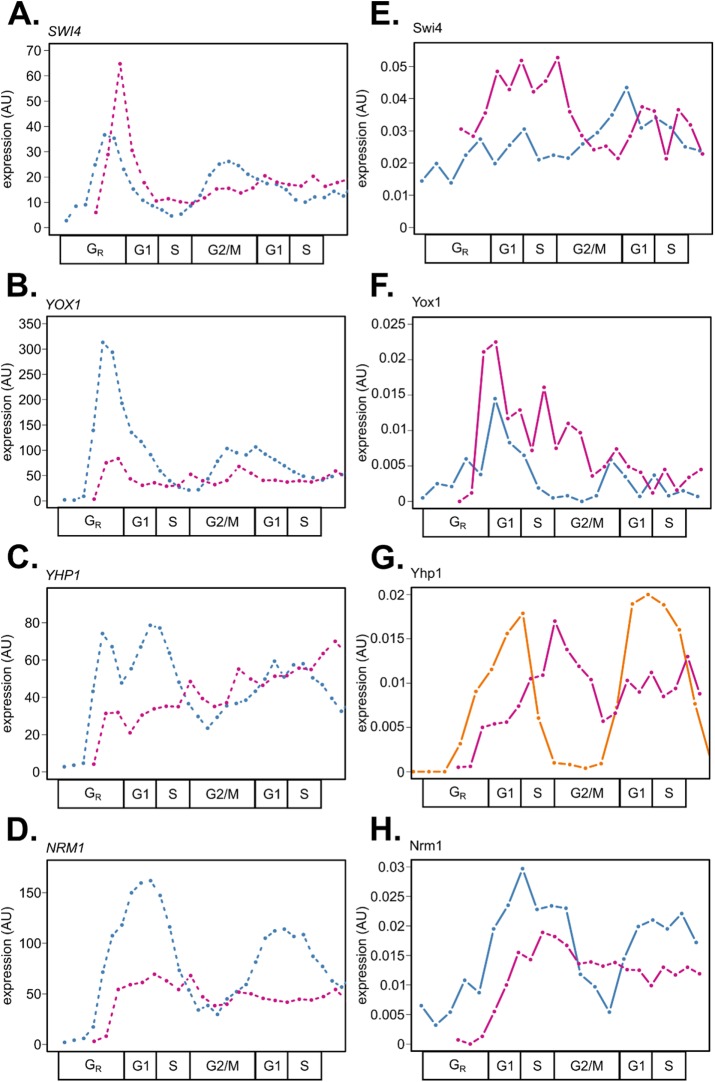
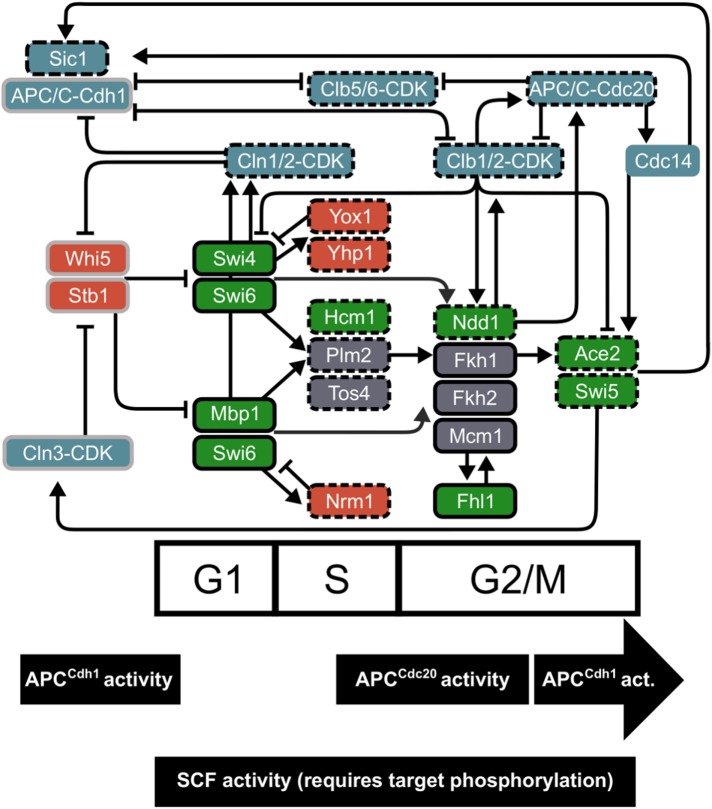
In the budding yeast Saccharomyces cerevisiae, transcription factors (TFs) regulate the periodic expression of many genes during the cell cycle, including gene products required for progression through cell-cycle events. Experimental evidence coupled with quantitative models suggests that a network of interconnected TFs is capable of regulating periodic genes over the cell cycle. Importantly, these dynamical models were built on transcriptomics data and assumed that TF protein levels and activity are directly correlated with mRNA abundance. To ask whether TF transcripts match protein expression levels as cells progress through the cell cycle, we applied a multiplexed targeted mass spectrometry approach (parallel reaction monitoring) to synchronized populations of cells. We found that protein expression of many TFs and cell-cycle regulators closely followed their respective mRNA transcript dynamics in cycling wild-type cells. Discordant mRNA/protein expression dynamics was also observed for a subset of cell-cycle TFs and for proteins targeted for degradation by E3 ubiquitin ligase complexes such as SCF (Skp1/Cul1/F-box) and APC/C (anaphase-promoting complex/cyclosome). We further profiled mutant cells lacking B-type cyclin/CDK activity ( clb1-6) where oscillations in ubiquitin ligase activity, cyclin/CDKs, and cell-cycle progression are halted. We found that a number of proteins were no longer periodically degraded in clb1-6 mutants compared with wild type, highlighting the importance of posttranscriptional regulation. Finally, the TF complexes responsible for activating G1/S transcription (SBF and MBF) were more constitutively expressed at the protein level than at periodic mRNA expression levels in both wild-type and mutant cells. This comprehensive investigation of cell-cycle regulators reveals that multiple layers of regulation (transcription, protein stability, and proteasome targeting) affect protein expression dynamics during the cell cycle.


Figures

FIGURE 1:
FIGURE 1:
Proteome dynamics of cell-cycle regulators follow the transcriptome with delay during the cell cycle in S. cerevisiae. Wild-type budding yeast cells were grown in 2% YEPD rich media, synchronized by alpha-factor mating pheromone, released into YEPD, and monitored over ∼2 cell cycles. Samples were collected every 5 min for RNA sequencing (Kelliher et al., 2016) (A) or every 7 min for total protein extraction (B, C). Population synchrony was monitored by counting at least 200 cells per time point for the presence or absence of a bud (bottom). A total of 31 high-confidence proteins (44 total peptides) are shown, with multiple high-confidence peptides per protein for Cdc28, Swi4, Cln2, Tos4, Hcm1, Plm2, Nrm1, Ndd1, Fhl1, Swi5, Ace2, and Sic1. Genes and proteins were ordered on the y-axis by peak time of mRNA expression (A). Transcript and protein levels are depicted as z-score changes relative to expression mean in the respective data sets, where values represent the number of standard deviations away from the mean. Each column represents a lifeline point on a common cell-cycle timeline determined by the CLOCCS algorithm (Supplemental File 1). Individual line plots from Figure 1 are shown for core cell-cycle TFs (Supplemental Figure 1), non-strongly-cycling regulators (Supplemental Figure 2), and periodic regulators (Supplemental Figure 3). Eleven regulators (Gat1, Cdc28, Swi4, Fhl1, Fkh1, Fkh2, Msn2, Swi6, Mbp1, Ixr1, and Mcm1) were somewhat constitutively expressed, and 20 regulators (Phd1, Pcl2, Msn4, Yox1, Clb5, Pcl1, Cln2, Tos4, Hcm1, Plm2, Nrm1, Cin8, Pds1, Ndd1, Swi5, Ace2, Sfg1, Cdc20, Ash1, and Sic1) appeared to be cycling.
FIGURE 2:
FIGURE 2:
Method validation and supplementation of targeted mass spectrometry in comparison with time series immunoblots. Line plots for mRNA expression (black, dashed), representative Western blot protein expression (orange, solid), and representative PRM peptide expression (blue, solid) were aligned on a common cell-cycle timeline using CLOCCS and plotted. Wild-type cells expressing Nrm1-HA3 (A), Swi4-13MYC (B), Yox1-13MYC (C), Clb2-HA (D), or Yhp1-13MYC (E) were grown in 2% YEPD media, synchronized by alpha-factor mating pheromone, released into YEPD, and monitored over ∼2 cell cycles. Samples were collected every 7 min for total protein extraction. Protein immunoblots were normalized to Cdc28/Pho85 (PSTAIR; constitutive levels over the cell cycle) with ImageJ. One representative Western blot is shown for each triplicate set of experiments (orange lines). To assess reproducibility between PRM and immunoblotting, Western blot data were compared with targeted mass spectrometry peptide data (blue lines) for NRM1_1 from PRM replicate 2, A; SWI4_1 from PRM replicate 1, B; and YOX1_1 from PRM replicate 1, C. Transcript expression, peptide light/heavy ratios, and Western blot data were scaled to maximum expression for each gene or protein ([0, 100] linear scale).
FIGURE 3:
FIGURE 3:
Cell-cycle proteins targeted for destruction by E3 ubiquitin ligases have unique expression features in wild-type cells. RNA expression and peptide light/heavy ratios were scaled to the maximum value for each gene or protein ([0, 100] linear scale). Line plots for mRNA expression (black, dashed) and biological replicates of wild-type peptide expression (replicate 1 in green, replicate 2 in blue) are shown for canonical SCF targets: CLN2_1 (A), HCM1_1 (B), SIC1_1 (C), and SWI5_3 (D) or APC/C targets: CDC20_1 (E), CLB5_1 (F), PDS1_2 (G), and NDD1_1 (H). When multiple peptides per protein were detected (Figure 1), the peptide with lowest noise levels was selected (Supplemental Table 2).
FIGURE 4:
FIGURE 4:
E3 ubiquitin ligase targets display altered dynamics and RNA-to-protein delay times in clb1-6 mutant cells. RNA expression and peptide light/heavy ratios were scaled to the maximum value for each gene or protein ([0, 100] linear scale). Line plots for mRNA expression (black, dashed) and biological replicates of clb1-6 mutant peptide expression (replicate 1 in red, replicate 2 in purple) are shown for canonical SCF targets: HCM1_2 (A), SIC1_1 (B) or APC/C targets: PDS1_2 (C), and NDD1_1 (D). When multiple peptides per protein were detected, the peptide with lower noise levels was selected (Supplemental Table 2). In the cell-cycle timeline for clb1-6 cells, S and G2/M phases are shown as gray boxes to indicate that B-cyclin mutant cells are physically arrested at the G1/S border. RNA-to-peptide delay times were calculated using the TAKT algorithm and shown in cell-cycle timeline points (wild-type replicates: green and blue bars; clb1-6 replicates: red and purple bars) (E). RNA–protein pairs are grouped based on putative targeted degradation mechanism (Supplemental Table 4). The average time delay for peptides shown in clb1-6 mutant cells was 33.7 ± 22.0 cell-cycle points, compared with 16.5 ± 11.3 cell-cycle points in wild-type cells (E).
FIGURE 5:
FIGURE 5:
Gene expression dynamics of G1/S TFs in wild-type and clb1-6 mutant cells reveal that repressor proteins are more dynamically expressed than activators. RNA and protein expression data sets were aligned on a common cell-cycle timeline using CLOCCS. Line plots for mRNA expression (dashed) and representative peptide expression (solid lines; wild type in blue and clb1-6 mutant in purple) are shown. mRNA expression values (fpkm units) on the y-axes were normalized together for the two data sets (A–D). Peptide expression values (light/heavy ratios) on the y-axes are comparable between the time series data sets because a constant amount of SIL peptides was used in all experiments (EH). Representative peptides from PRM experiments are SWI4_1 from wild-type replicate 1 and clb1-6 replicate 2, E; YOX1_1 from wild-type replicate 2 and clb1-6 replicate 2, F; YHP1_5 from clb1-6 replicate 2, G; and NRM1_1 from wild-type replicate 2 and clb1-6 replicate 2, H. Yhp1-13MYC protein expression levels in wild-type cells were taken from Figure 2 (G, orange line). The immunoblotting data were scaled relative to the maximum value for the experiment ([0, 100] linear scale) followed by scaling to the maximum value to match the PRM data from clb1-6 cells ([0, 0.02] linear scale, arbitrary units; G).
FIGURE 6:
FIGURE 6:
An integrated cell-cycle network includes windows of targeted E3 ubiquitin ligase activity. Cell-cycle ordering is maintained by cyclin/CDK activity, an interconnected network of transcription factors, and E3 ubiquitin ligase activity. Approximate windows of peak degradation machinery are shown based on wild-type data (Figure 3). Periodic TFs (activators in green, repressors in red) are placed on the cell-cycle timeline approximately by peak mRNA expression. In blue, G1 (Cln) and B-type (Clb) cyclin/CDKs, APC/C, Cdc14, and Sic1 regulate each other and TFs in the network. Edges from TFs represent evidence for transcriptional regulation: ChIP-chip data for TF binding and/or genetic evidence for regulation type (compiled in Orlando et al., 2008; McGoff et al., 2016; Cho et al., 2017a). Edges between regulatory proteins and TFs represent protein-level modifications (e.g., phosphorylation or ubiquitination). Pointed arrows indicate activation, and blunted arrows mark repression or protein degradation. Proteins outlined in black were detected with high confidence in our study (Supplemental Table 2), and gray indicates low-confidence peptides. Dashed outlines mark periodic cell-cycle regulators, and solid boxes represent more stable TF expression. Paralogues from the whole genome duplication include Yhp1 and Yox1, Plm2 and Tos4, Fkh1 and Fkh2, and Ace2 and Swi5. Complexes of TFs include SBF (Swi4 and Swi6), MBF (Mbp1 and Swi6), and SFF (Mcm1, Fkh1-2, and Ndd1).

Similar articles

Cited by

References

    1. Amon A, Tyers M, Futcher B, Nasmyth K. (1993). Mechanisms that help the yeast cell cycle clock tick: G2 cyclins transcriptionally activate G2 cyclins and repress G1 cyclins. Cell , 993–1007. - PubMed
    1. Ball DA, Adames NR, Reischmann N, Barik D, Franck CT, Tyson JJ, Peccoud J. (2013). Measurement and modeling of transcriptional noise in the cell cycle regulatory network. Cell Cycle , 3203–3218. - PMC - PubMed
    1. Ball DA, Marchand J, Poulet M, Baumann WT, Chen KC, Tyson JJ, Peccoud J. (2011). Oscillatory dynamics of cell cycle proteins in single yeast cells analyzed by imaging cytometry. PLoS One , e26272. - PMC - PubMed
    1. Bertoli C, Skotheim JM, de Bruin RAM. (2013). Control of cell cycle transcription during G1 and S phases. Nat Rev Mol Cell Biol , 518–528. - PMC - PubMed
    1. Breitkreutz A, Choi H, Sharom JR, Boucher L, Neduva V, Larsen B, Lin ZY, Breitkreutz BJ, Stark C, Liu G, et al. (2010). A global protein kinase and phosphatase interaction network in yeast. Science , 1043–1046. - PMC - PubMed

Publication types

MeSH terms