. 2018 Nov 1;29(22):2720-2736.
doi: 10.1091/mbc.E18-07-0424. Epub 2018 Sep 12.

Tracking yeast pheromone receptor Ste2 endocytosis using fluorogen-activating protein tagging

Affiliations

Tracking yeast pheromone receptor Ste2 endocytosis using fluorogen-activating protein tagging

Anita Emmerstorfer-Augustin et al. Mol Biol Cell. .

Abstract

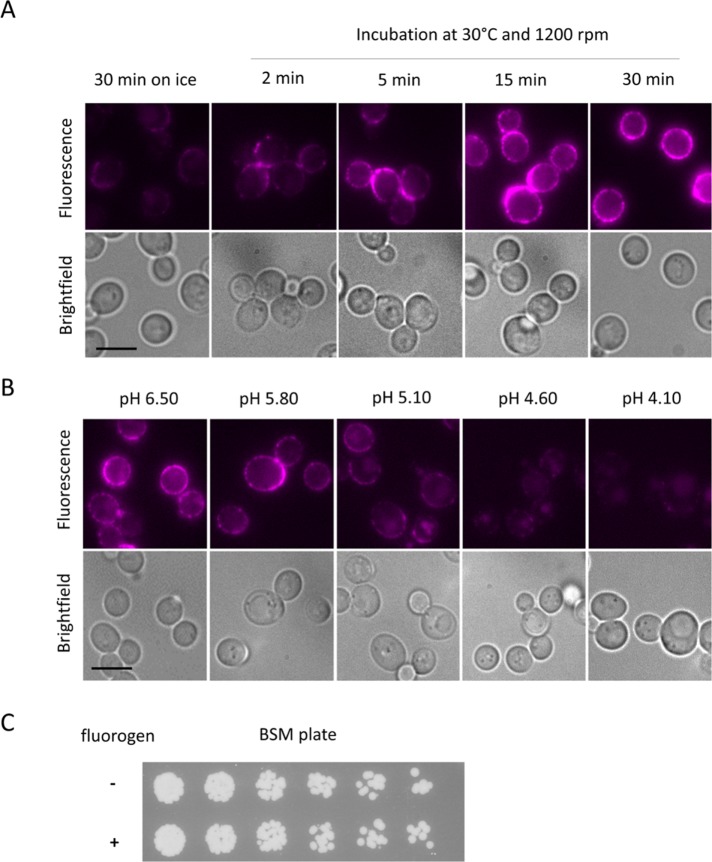
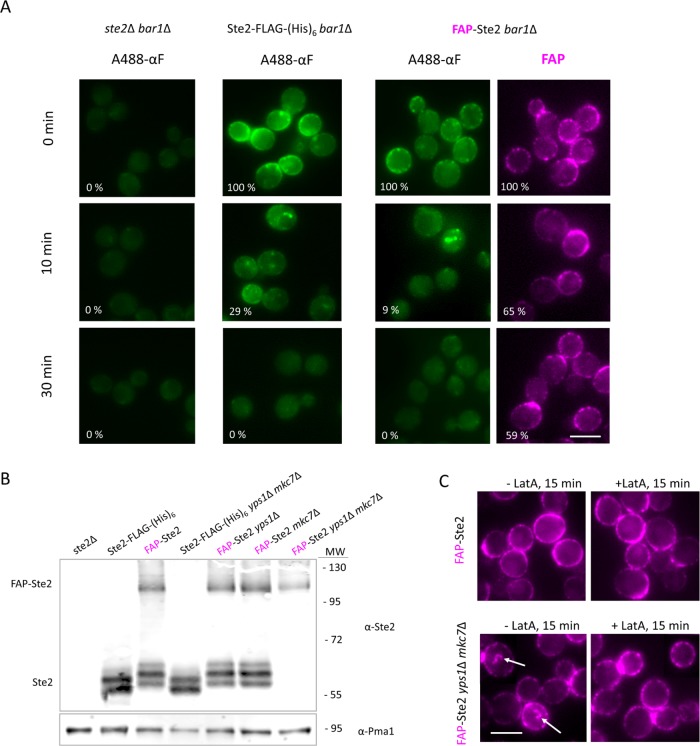
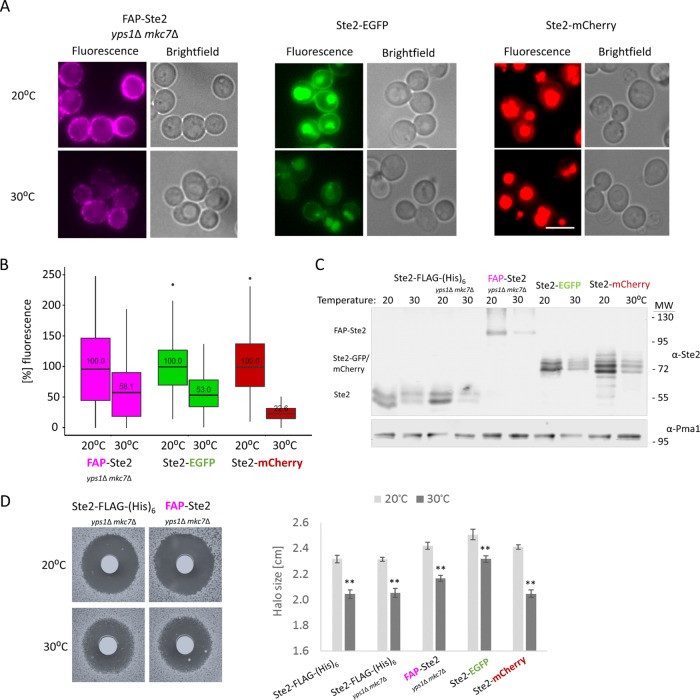
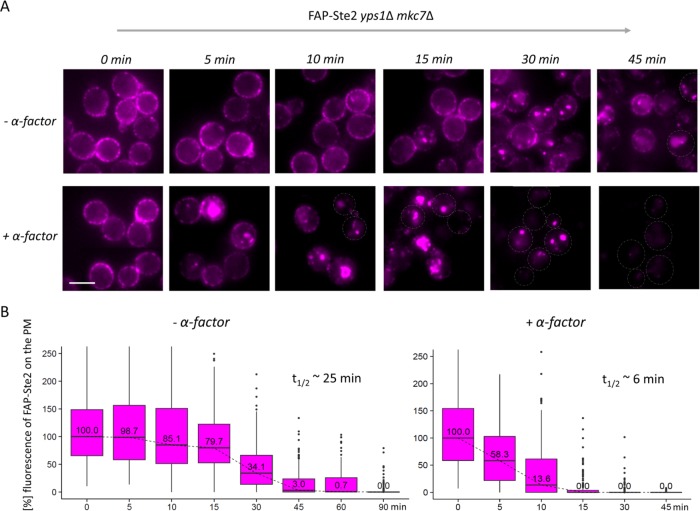
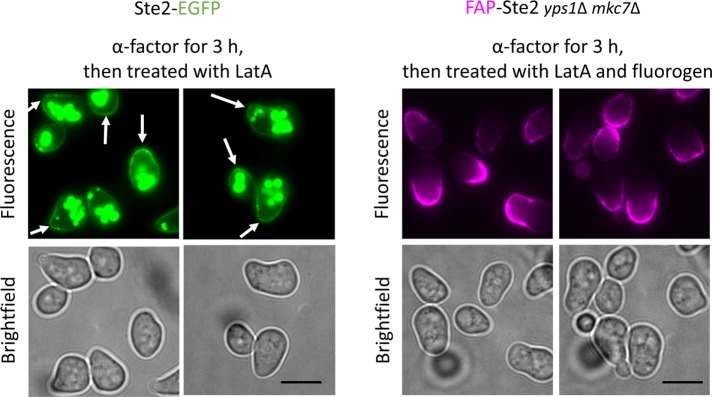
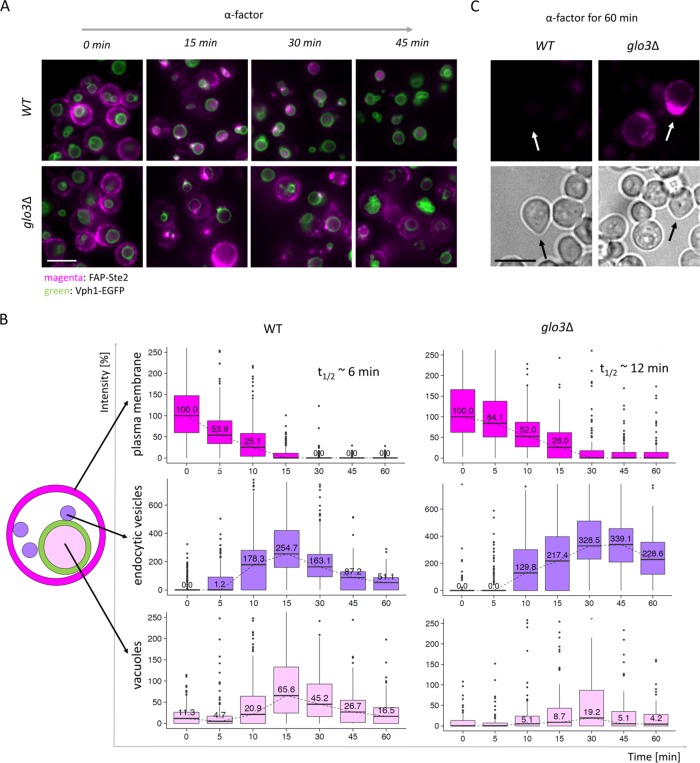
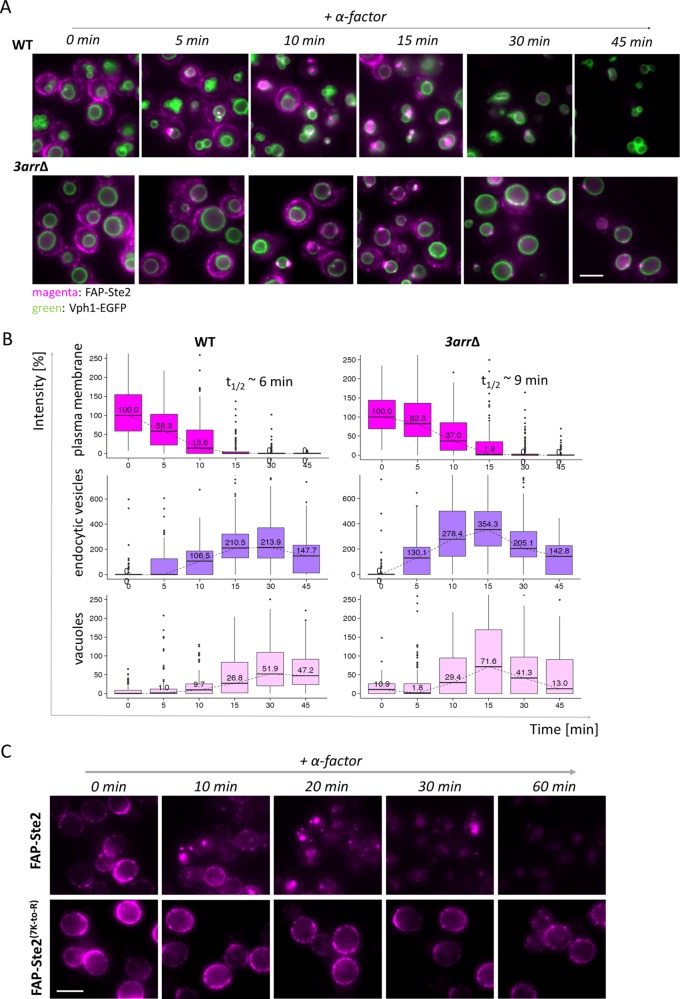
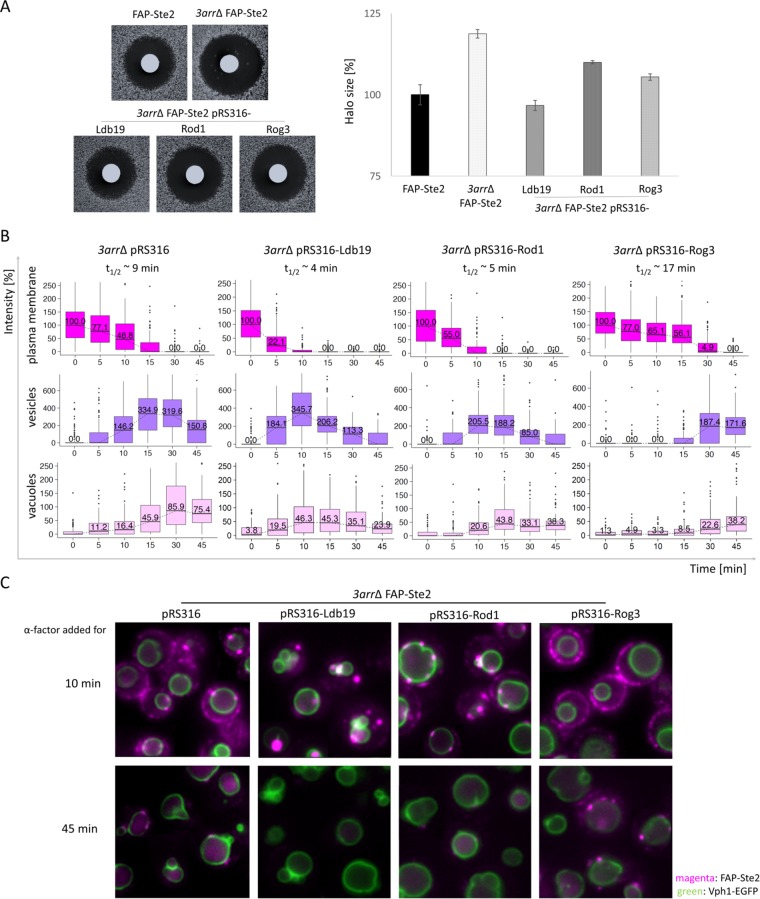
To observe internalization of the yeast pheromone receptor Ste2 by fluorescence microscopy in live cells in real time, we visualized only those molecules present at the cell surface at the time of agonist engagement (rather than the total cellular pool) by tagging this receptor at its N-terminus with an exocellular fluorogen-activating protein (FAP). A FAP is a single-chain antibody engineered to bind tightly a nonfluorescent, cell-impermeable dye (fluorogen), thereby generating a fluorescent complex. The utility of FAP tagging to study trafficking of integral membrane proteins in yeast, which possesses a cell wall, had not been examined previously. A diverse set of signal peptides and propeptide sequences were explored to maximize expression. Maintenance of the optimal FAP-Ste2 chimera intact required deletion of two, paralogous, glycosylphosphatidylinositol (GPI)-anchored extracellular aspartyl proteases (Yps1 and Mkc7). FAP-Ste2 exhibited a much brighter and distinct plasma membrane signal than Ste2-GFP or Ste2-mCherry yet behaved quite similarly. Using FAP-Ste2, new information was obtained about the mechanism of its internalization, including novel insights about the roles of the cargo-selective endocytic adaptors Ldb19/Art1, Rod1/Art4, and Rog3/Art7.


Figures

FIGURE 1:
FIGURE 1:
Optimization of fluorogen binding to FAP-Ste2. (A) Cells (yAEA152) expressing FAP-Ste2 from the endogenous STE2 locus were grown to mid–exponential phase in BSM, incubated with fluorogen (0.4 mM final concentration) either on ice without agitation or at 30°C with agitation (1200 rpm) for the time periods indicated, washed and collected by brief centrifugation, and viewed by fluorescence microscopy (top panels) and bright field microscopy (bottom panels), as described under Materials and Methods. Scale bar, 5 μm. (B) As in A, except the cells were propagated in BSM buffered at the indicated pH values (with either 100 mM phosphate or 50 mM succinate, as appropriate), incubated with fluorogen for 15 min at 30°C, and then imaged. (C) Portions of the same culture as in A were incubated for 15 min at 30°C in the absence (–) or presence (+) of fluorogen, and then samples of a set of fivefold serial dilutions were spotted using a multiprong inoculator on an agar plate containing BSM, and, after incubation for 48 h at 30°C, the resulting growth was recorded.
FIGURE 2:
FIGURE 2:
Absence of yapsins preserves full-length endocytosis-competent FAP-Ste2. (A) Strain DK102 (ste2Δ bar1Δ) or otherwise isogenic derivatives expressing from the endogenous STE2prom, either Ste2-FLAG-(His)6 (yAEA265) or FAP-Ste2 (yAEA261), were incubated with A488-αF on ice for 1.5 h in medium lacking glucose and then washed and shifted to glucose-containing medium at 30°C, and samples were removed at the indicated times and viewed by fluorescence microscopy. The cells expressing FAP-Ste2 were prelabeled with fluorogen under standard conditions (0.4 mM dye; 15 min, 30°C, pH 6.5) prior to incubation with A488-αF. Value (%) in the bottom left corner of each image represents the average pixel intensity (n ≥ 200 cells per sample) of A488-αF or FAP-Ste2 at the cell periphery, relative to the starting intensity for each strain, quantified using CellProfiler, as described under Materials and Methods. Scale bar, 5 μm. (B) Strain JTY4470 (ste2∆) and otherwise isogenic yps1∆ or mkc7∆ single mutant derivatives or a yps1∆ mkc7∆ double mutant derivative (Table 1), expressing from the endogenous STE2prom either Ste2-FLAG-(His)6 or FAP-Ste2, as indicated, were grown to early exponential phase at 20°C, harvested, and lysed, and membrane proteins were extracted, resolved by SDS–PAGE, and analyzed by immunoblotting with anti-Ste2 antibody, as described under Materials and Methods. Loading control, Pma1 detected on the same immunoblots using anti-Pma1 antibody. MW, marker proteins (kDa). (C) Samples of a YPS1+ MKC7+ strain (yAEA152) or an otherwise isogenic yps1Δ mkc7Δ strain (yAEA359), each expressing FAP-Ste2, were treated, as indicated, with either vehicle alone (ethanol) or LatA in ethanol (100 μM final concentration) and then exposed to fluorogen as in A and viewed by fluorescence microscopy. Arrows, internalized vesicles containing FAP-Ste2. Scale bar, 5 μm.
FIGURE 3:
FIGURE 3:
Comparison of FAP-Ste2 to Ste2-EGFP and Ste2-mCherry at two different temperatures. (A) A MATa yps1Δ mkc7Δ strain (yAEA359) expressing FAP-Ste2 from the STE2 locus, and a MATa strain expressing Ste2-EGFP (JTY6757) and a MATa strain expressing Ste2-mCherry (YEL014) in the same manner were cultivated at either 20°C or 30°C. After incubation with fluorogen (0.4 mM dye; 15 min; pH 6.5), the cell populations were examined and compared by fluorescence microscopy. Representative images are shown for each strain and condition. Scale bar, 5 μm. (B) For the cell samples in A, PM-localized fluorescence was quantified (n > 250 cells each) using CellProfiler, and the values obtained were plotted in box-and-whisker format. Box represents the interquartile range (IQR) between lower quartile (25%) and upper quartile (75%); horizontal black line represents the median value; whisker ends represent the lowest and highest data points still within 1.5 IQR of the lower and upper quartiles, respectively; dot, a single cell that exhibited a fluorescence intensity higher than the upper quartile. For each strain, the initial median fluorescence intensity value at the PM obtained at 20°C was set to 100%. (C) The strains in A, as well as wild-type cells expressing Ste2-FLAG-(His)6 (yAEA201) and an otherwise isogenic yps1Δ mkc7Δ strain expressing Ste2-FLAG-(His)6 (yAEA361), were cultivated at either 20°C or 30°C, and extracts were prepared and samples (6 μg total protein) analyzed as in Figure 2B. (D) Left, the pheromone responsiveness of the indicated cultures from C was assessed using an agar diffusion (halo) bioassay to measure α-factor-induced growth arrest on BSM medium (15 μg α-factor spotted on each filter disk). Plates were incubated at the indicated temperature. Right, quantification of the average difference in halo diameter for the indicated strains (two biological and three technical replicates were performed for each) at 20° and 30°C. Error bars, SEM; **p value < 0.0001, determined by two-tailed Student’s t test.
FIGURE 4:
FIGURE 4:
Direct visualization of basal and ligand-induced receptor internalization. (A) A MATa yps1Δ mkc7Δ strain expressing FAP-Ste2 (yAEA359) was grown at 20°C to early exponential phase, treated with LatA, incubated with fluorogen (0.4 mM dye; 15 min; pH 6.5), and deposited onto the glass bottoms of imaging chambers, and then internalization was initiated by washing out the LatA and excess fluorogen, as described under Materials and Methods, followed by either immediate addition of α-factor in H2O (5 μM final concentration) (+α-factor) or an equivalent of water (–α-factor), and the cells were monitored by fluorescence microscopy at the indicated times over the course of 45–90 min. A representative image is shown for each time point. Scale bar, 5 μm. (B) The fluorescence intensity at the cell periphery in cells from the images (n = 5–6 per time point) from A were quantified using CellProfiler and plotted in box-and-whisker format, as in Figure 3B. For each strain, the initial median fluorescence intensity value at the PM was set to 100%. Insets, calculated times (t1/2) for 50% decrease in PM fluorescence.
FIGURE 5:
FIGURE 5:
Cells expressing FAP-Ste2 exhibit a normal morphological response to α-factor and insert newly made receptors at the shmoo tip. MATa cells expressing Ste2-EGFP (JTY6765) (left) and MATa yps1Δ mkc7Δ cells expressing FAP-Ste2 (yAEA359) (right) were treated with 10 μM α-factor for 3 h, incubated with LatA (and, in case of FAP-Ste2, then with fluorogen), and examined by fluorescence microscopy. Scale bar, 5 μm. Arrows, very slight enrichment of Ste2-GFP at shmoo tips (as compared with the prominent FAP-Ste2 fluoresence at shmoo tips).
FIGURE 6:
FIGURE 6:
Delivery of Ste2 to the vacuole is defective in cells lacking Glo3. (A) Pheromone-induced endocytosis of FAP-Ste2 expressed in isogenic GLO3+(yAEA380) (top panels) and glo3∆ (yAEA382) (bottom panels) MATa yps1Δ mkc7Δ Vph1-EGFP cells was conducted as in Figure 4. A representative image is shown for each strain at each time point. Scale bar, 5 μm. (B) The fluorescence intensity at the cell periphery (magenta), in endocytic vesicles (purple), and in the lumen of the vacuole (pink), as indicated in the schematic cell illustration to the left, in cells (n ≥ 250) from the images (n = 5–6 per time point) from A were quantified using CellProfiler and plotted in box-and-whisker format, as in Figure 3B. Insets, calculated times (t1/2) for 50% decrease in PM fluorescence. For each strain, the initial median fluorescence intensity value at the PM was set to 100%. (C) The strains in A were grown to early exponential phase at 20°C, incubated with LatA and fluorogen, as described under Materials and Methods, washed, incubated with 10 μM α-factor in liquid medium for 60 min, and examined by fluorescence microscopy. Arrows, cells that have commenced forming shmoo tips. Scale bar, 5 μm.
FIGURE 7:
FIGURE 7:
Absence of α-arrestins Ldb19, Rod1, and Rog3 delays internalization and delivery of endocytosed FAP-Ste2 to the vacuole. (A) Otherwise isogenic MATa (yAEA380) and MATa 3arr∆ (yAEA381) cells expressing FAP-Ste2 and Vph1-EGFP were cultivated and incubated with 5 μM α-factor to initiate pheromone-induced endocytosis as described in Figure 6A. A representative image is shown for each strain at each time point. Scale bar, 5 μm. (B) The data in A were quantified and plotted as described in Figure 6B. The initial intensities of FAP-Ste2 on the PM (i.e., at time 0) were quite similar for both strains, and their median values were set to 100%. (C) MATa yps1Δ mkc7Δ cells expressing either FAP-Ste2 (yAEA359) or FAP-Ste2(7K-to-R) (yAEA397) were grown at 20 °C to early exponential phase, treated with LatA, incubated with fluorogen (0.4 mM dye; 15 min; pH 6.5), and deposited onto the glass bottoms of imaging chambers, and then internalization was initiated by washing out the LatA and excess fluorogen, as described under Materials and Methods, followed by immediate addition of α-factor in H2O (5 μM final concentration), and the cells were monitored by fluorescence microscopy at the indicated times over the course of 60 min. A representative image is shown for each time point. Scale bar, 5 μm.
FIGURE 8:
FIGURE 8:
Ldb19, Rod1, and Rog3 have distinct roles in Ste2 down-regulation. (A) Left, the halo bioassay for pheromone-induced growth arrest was used to assess the relative pheromone sensitivity of a MATa yps1Δ mkc7Δ FAP-Ste2 Vph1-EGFP strain (yAEA380) and an otherwise isogenic 3arr∆ derivative (yAEA389), both carrying empty vector (pRS316) (top panels), as well as the same 3arr∆ strain expressing LDB19, ROD1, or ROG3, as indicated, from the same vector (bottom panels), as in Figure 3D, except that the medium was BSM-Ura and 15 μg α-factor were spotted on the filter disks. Right, results of independent experiments (n = 6) are plotted as a bar graph, as in Figure 3D. (B) The same strains as in A were labeled with fluorogen, exposed to α-factor, and examined by fluorescence microscopy, as in Figure 3A, and the data were analyzed and plotted as in Figure 6B. The initial intensities of FAP-Ste2 on the PM (i.e., at time 0) were very similar for all four strains, and their median values were set to 100%; t1/2, calculated time for 50% decrease in PM fluorescence. (C) Representative images for the strains in B at the indicated time points. Scale bar, 2.5 μm.

Similar articles

Cited by

References

    1. Alvaro CG, Aindow A, Thorner J. (2016). Differential phosphorylation provides a switch to control how α-arrestin Rod1 down-regulates mating pheromone response in Saccharomyces cerevisiae . Genetics , 299–317. - PMC - PubMed
    1. Alvaro CG, O’Donnell AF, Prosser DC, Augustine AA, Goldman A, Brodsky JL, Cyert MS, Wendland B, Thorner J. (2014). Specific α-arrestins negatively regulate Saccharomyces cerevisiae pheromone response by down-modulating the G-protein-coupled receptor Ste2. Mol Cell Biol , 2660–2681. - PMC - PubMed
    1. Alvaro CG, Thorner J. (2016). Heterotrimeric G protein-coupled receptor signaling in yeast mating pheromone response. J Biol Chem , 7788–7795. - PMC - PubMed
    1. Amberg DC, Burke DJ, Strathern JN. (2005). Methods in Yeast Genetics, Cold Spring Harbor, NY: Cold Spring Harbor Laboratory Press.
    1. Arkowitz RA. (1999). Responding to attraction: chemotaxis and chemotropism in Dictyostelium and yeast. Trends Cell Biol , 20–27. - PubMed

Publication types

MeSH terms