. 2018 Nov 15;29(23):2821-2834.
doi: 10.1091/mbc.E18-07-0425. Epub 2018 Sep 12.

A balance of deubiquitinating enzymes controls cell cycle entry

Affiliations

A balance of deubiquitinating enzymes controls cell cycle entry

Claudine E Mapa et al. Mol Biol Cell. .

Abstract

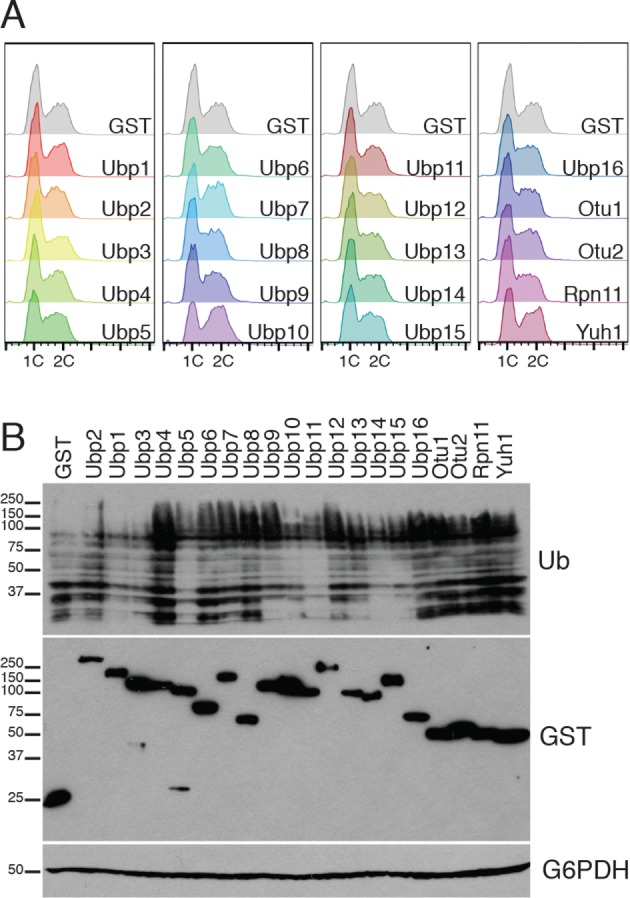
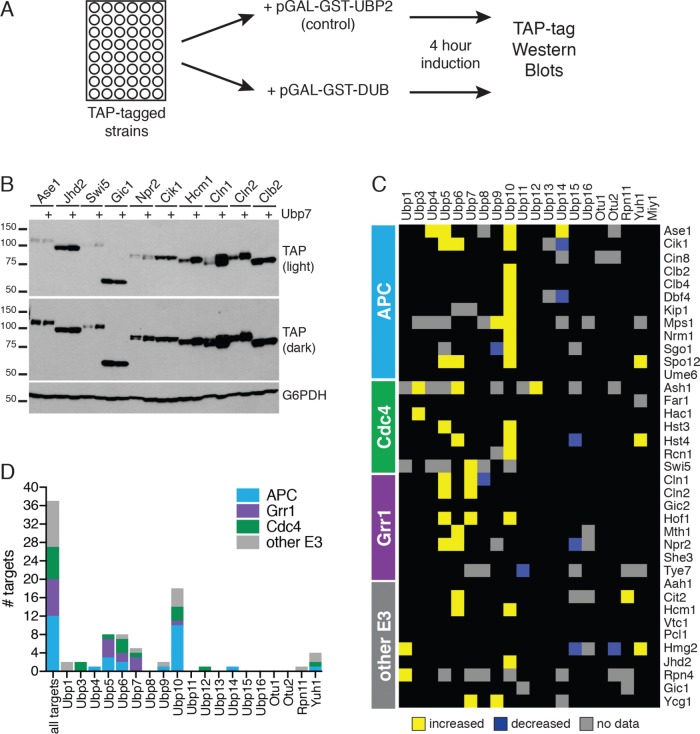
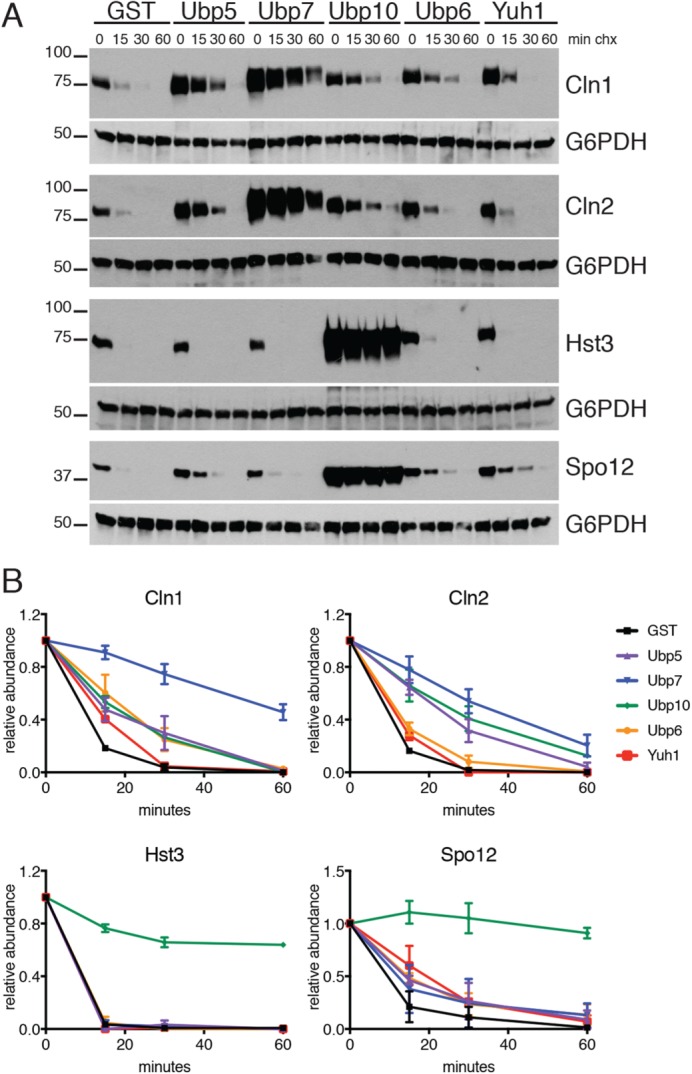
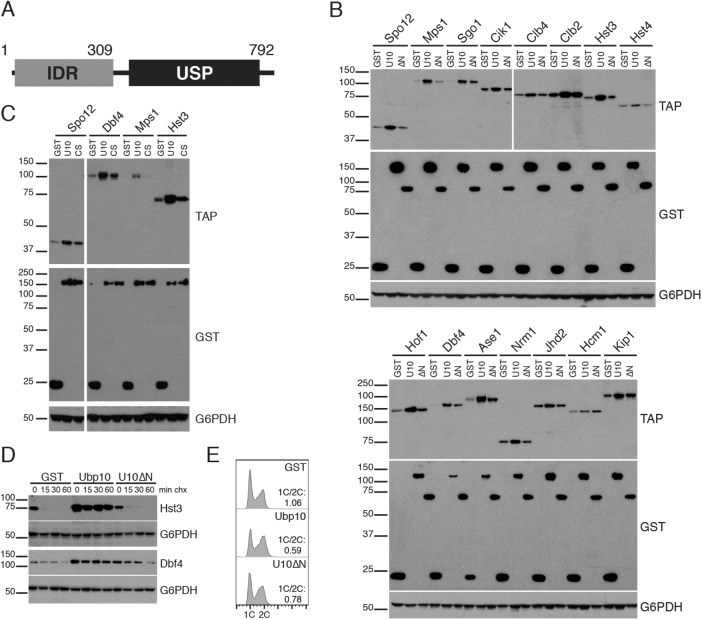
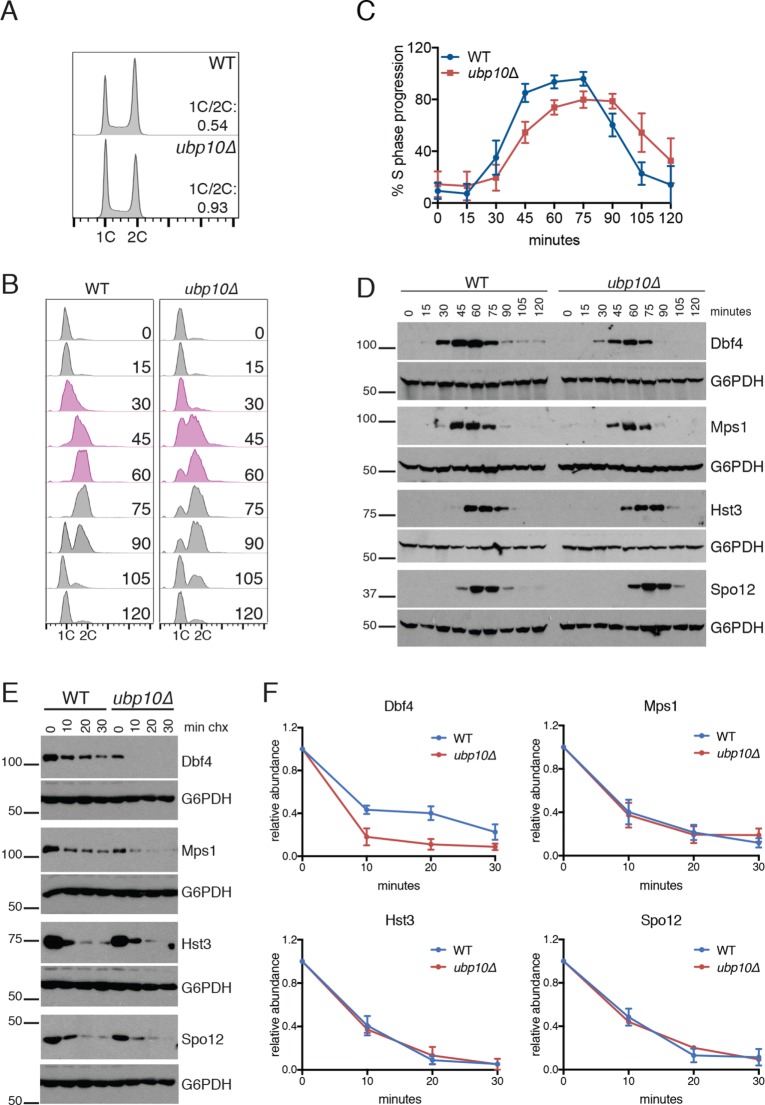
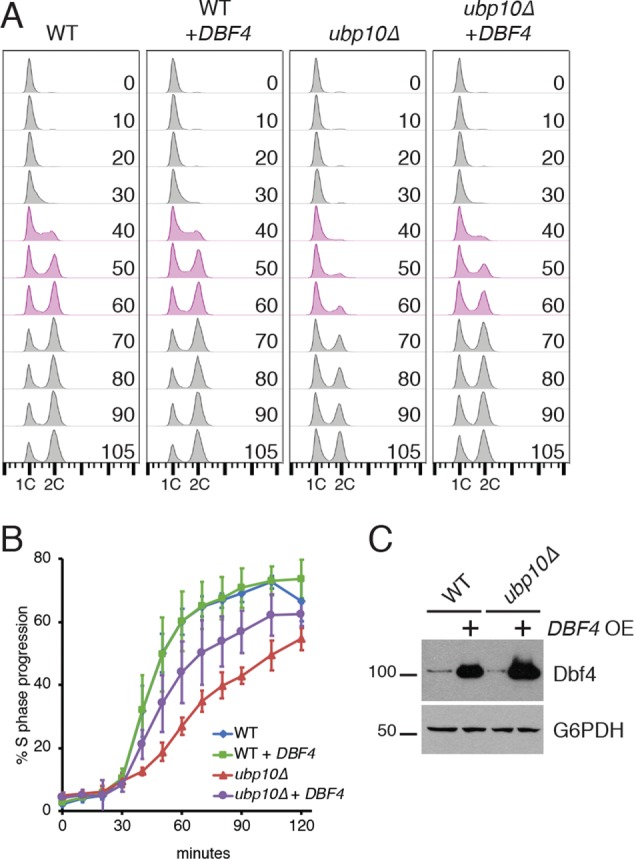
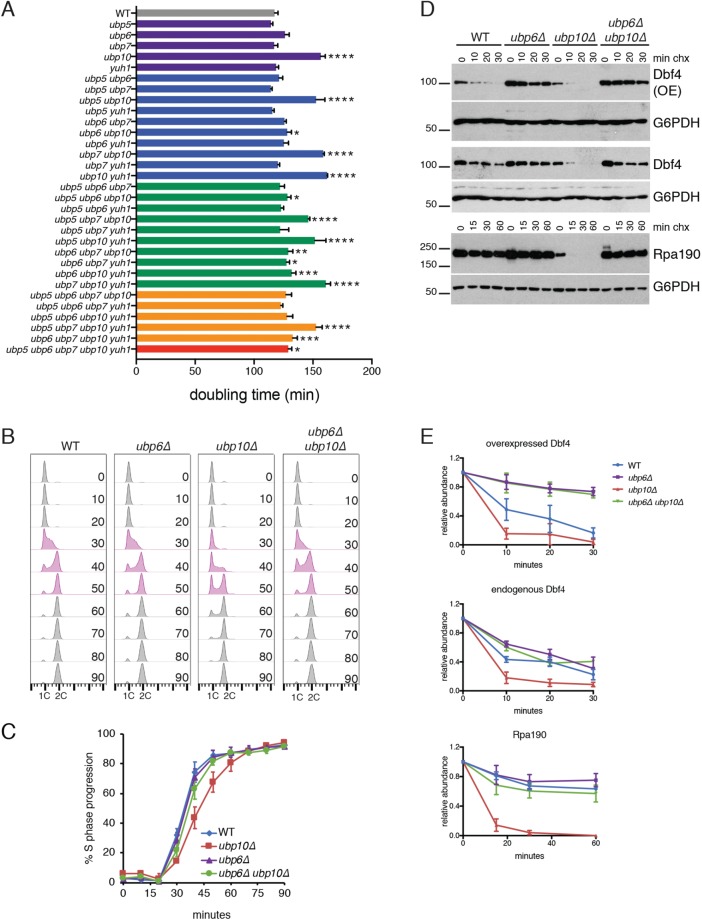
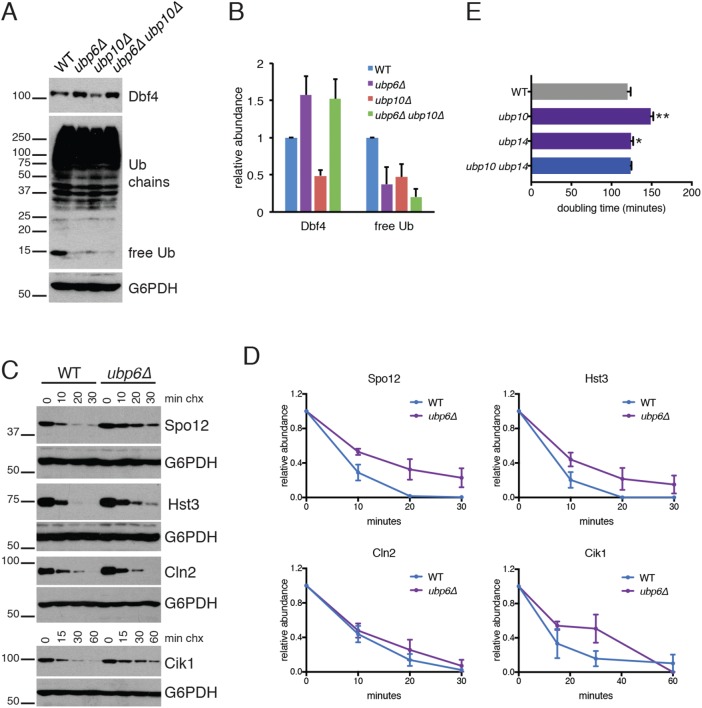
Protein degradation during the cell cycle is controlled by the opposing activities of ubiquitin ligases and deubiquitinating enzymes (DUBs). Although the functions of ubiquitin ligases in the cell cycle have been studied extensively, the roles of DUBs in this process are less well understood. Here, we used an overexpression screen to examine the specificities of each of the 21 DUBs in budding yeast for 37 cell cycle-regulated proteins. We find that DUBs up-regulate specific subsets of proteins, with five DUBs regulating the greatest number of targets. Overexpression of Ubp10 had the largest effect, stabilizing 15 targets and delaying cells in mitosis. Importantly, UBP10 deletion decreased the stability of the cell cycle regulator Dbf4, delayed the G1/S transition, and slowed proliferation. Remarkably, deletion of UBP10 together with deletion of four additional DUBs restored proliferation to near-wild-type levels. Among this group, deletion of the proteasome-associated DUB Ubp6 alone reversed the G1/S delay and restored the stability of Ubp10 targets in ubp10Δ cells. Similarly, deletion of UBP14, another DUB that promotes proteasomal activity, rescued the proliferation defect in ubp10Δ cells. Our results suggest that DUBs function through a complex genetic network in which their activities are coordinated to facilitate accurate cell cycle progression.


Figures

FIGURE 1:
FIGURE 1:
Acute overexpression of DUBs does not arrest the cell cycle. (A) Cell cycle analysis following DUB overexpression. Expression of GST-tagged DUBs was induced from the GAL1 promoter for 4 h and DNA content quantified by flow cytometry. (B) Western blots for ubiquitin chains (Ub) and GST-DUB proteins following a 4-h induction. G6PDH is shown as a loading control.
FIGURE 2:
FIGURE 2:
DUBs up-regulate specific subsets of cell cycle proteins. (A) Design of overexpression screen to identify DUBs that target specific cell cycle regulators for degradation. (B) Representative data from DUB overexpression screen. Western blots show levels of 10 TAP-tagged target proteins (light and dark exposures are shown) and G6PDH following 4 h of induction of a control (Ubp2) or Ubp7. (C) Summary heat map of DUB overexpression screen. DUBs are in columns, targets in rows. Targets are grouped by their corresponding E3 ubiquitin ligase (left). Yellow indicates the target increased at least twofold in two replicates of the screen, blue indicates the target decreased at least twofold in two replicates. Gray indicates no data. All primary data are reported in Supplemental Data S2. (D) Comparison of the number of targets up-regulated by each DUB. Bars are color-coded to group targets by their regulatory E3.
FIGURE 3:
FIGURE 3:
DUBs differentially stabilize substrates. (A) Cycloheximide-chase assays of the indicated targets following 4 h of overexpression of GST, Ubp5, Ubp7, Ubp10, Ubp6, or Yuh1. Western blots of TAP-tagged targets and G6PDH (loading control) are shown. (B) Quantitation of cycloheximide-chase assays from (A). Shown are the average of n = 2 experiments; errors bars represent the SEM.
FIGURE 4:
FIGURE 4:
The catalytic activity and N-terminal IDR of Ubp10 contribute to target stabilization. (A) Diagram of domains in Ubp10. (B) Validation of Ubp10 candidate targets and analysis of the contribution of the IDR. Western blots showing levels of the indicated TAP-tagged candidate targets following 2-h induction of GST, Ubp10, or Ubp10Δ2-309 (ΔN) proteins with 0.5% galactose. GST blots show similar expression of GST and DUBs; G6PDH blots confirm equal loading. (C) Ubp10 catalytic function is important for stabilization of substrates. Western blot showing levels of the indicated TAP-tagged candidate targets following overexpression of GST, Ubp10, or Ubp10-C371S (CS) as in B. GST and G6PDH blots are shown as controls. (D) Cycloheximide-chase assays of Hst3 and Dbf4 following overexpression of GST, Ubp10, or Ubp10Δ2-309 (ΔN) as in B. Western blots of TAP-tagged Dbf4 and Hst3 are shown. G6PDH blot confirms equal loading. (E) FACS profiles showing DNA content of cells overexpressing GST, Ubp10, or Ubp10Δ2-309 (U10ΔN) as in B. 1C:2C ratio is shown to highlight the increased 2C population upon Ubp10 overexpression. Also see Supplemental Figure S4.
FIGURE 5:
FIGURE 5:
Ubp10 regulates entry into the cell cycle. (A) FACS profiles showing DNA content of asynchronous wild-type (WT) and ubp10Δ cells growing in rich medium. 1C:2C ratio is shown to highlight increased 1C population upon deletion of UBP10. (B) S phase is delayed in ubp10Δ cells. Wild-type (WT) and ubp10Δ cells growing in rich medium were arrested in G1 with alpha factor and released into the cell cycle. Additional alpha factor was added back after 30 min to arrest cells in the subsequent G1 phase. Representative FACS plots are shown; S-phase time points are highlighted in purple. (C) Progression through S phase was calculated as described in Materials and Methods. An average of n = 8 experiments is shown. Error bars represent standard deviations. The eight replicates include two experiments each performed in WT and ubp10Δ strains with the four different TAP-tagged candidates shown in D. (D) Expression of Ubp10 candidate targets are reduced and/or delayed in ubp10Δ cells. Strains expressing TAP-tagged candidate targets were followed over the cell cycle, as in B. TAP and G6PDH Western blots are shown. (E) Cycloheximide-chase assays showing the half-life of candidate targets in WT and ubp10Δ cells. Western blots for TAP-tagged targets and G6PDH are shown. (F) Quantitation of cycloheximide-chase assays from E. Shown are the average of n = 8 (Dbf4), n = 5 (Mps1), or n = 3 (Spo12, Hst3) experiments; errors bars represent the SEM.
FIGURE 6:
FIGURE 6:
Dbf4 overexpression partially restores S-phase timing in ubp10Δ cells. (A) Strains expressing DBF4 from its own promoter in a 2μ plasmid (DBF4 OE) or an empty vector control were grown in synthetic medium lacking uracil, arrested in G1 with alpha factor for 3 h, and then released into medium without alpha factor. Nocodazole was added to the cultures after 30 min to arrest cells in the following mitosis. Samples were taken for FACS at 10–30-min intervals. A representative experiment is shown; time points that exhibit the greatest differences between strains are highlighted in purple. (B) Progression through S phase was calculated as described in Materials and Methods. Shown is an average of n = 5 experiments. Error bars represent standard deviations. (C) Western blot of TAP-tagged Dbf4 in asynchronous cells from A. G6PDH is shown as a loading control.
FIGURE 7:
FIGURE 7:
Deletion of UBP6 restores cell cycle timing in ubp10Δ strains. (A) Doubling times of strains with deletions of the indicated DUBs. Colors represent the number of deletions: single mutants, purple; double mutants, blue; triple mutants, green; quadruple mutants, orange; quintuple mutant, red. Shown are average doubling times for n = 2–6 independently derived strains of each genotype. Error bars represent SD. Asterisks indicate strains that are significantly different from wild type (WT) as measured by one-way ANOVA (*, p < 0.05; **, p < 0.005; ***, p < 0.0005; ****, p < 0.0001). All data are included in Supplemental Table S1. (B) G1 arrest-release of strains with the indicated genotypes, growing in rich medium. Cells were arrested in G1 with alpha factor and released into medium without alpha factor. Nocodazole was added to the medium 30 min after release to arrest cells in the following mitosis. Representative FACS plots are shown; time points that exhibit the greatest differences between strains are highlighted in purple. (C) Progression through S phase was calculated as described in Materials and Methods. Averages of n = 3 biological replicates are shown. Error bars represent SD. (D) Cycloheximide-chase assays of Dbf4-TAP and Rpa190-TAP in the indicated strains. In the top panels Dbf4 was overexpressed from a 2μ plasmid (as in Figure 6); the middle and lower panels represent Dbf4 and Rpa190 expressed from their genomic loci. TAP and G6PDH (loading control) Western blots are shown. (E) Quantitation of cycloheximide-chase assays from A. Shown are average of n = 3 (Dbf4 OE), n = 8 (endogenous Dbf4 in WT and ubp10Δ), or n = 4 (endogenous Dbf4 in ubp6Δ and ubp6Δ ubp10Δ, Rpa190) experiments; error bars represent the SEM.
FIGURE 8:
FIGURE 8:
Deletion of DUBs that promote proteasome function rescue ubp10Δ phenotypes. (A) Representative Western blot of Dbf4-TAP and ubiquitin in asynchronous cells. G6PDH is shown as a loading control. (B) Quantitation of Western blots in part A. Dbf4-TAP and free ubiquitin levels were normalized to G6PDH. Shown is an average of n = 3 experiments; error bars represent SD. (C) Cycloheximide-chase assay of TAP-tagged UPS targets in wild-type (WT) and ubp10Δ cells as indicated. TAP and G6PDH blots are shown. (D) Quantitation of cycloheximide-chase assays from C. Shown is an average of n = 3 experiments; error bars represent the SEM. (E) Doubling time of strains with deletions in the indicated DUBs. Shown is the average of n = 4 replicates; error bars represent SD. Asterisks indicate strains that are significantly different from wild type (WT) as measured by one-way ANOVA (*, p < 0.05; **, p < 0.005).

Similar articles

Cited by

References

    1. Abdul Rehman SA, Kristariyanto YA, Choi S-Y, Nkosi PJ, Weidlich S, Labib K, Hofmann K, Kulathu Y. (2016). MINDY-1 is a Member of an evolutionarily conserved and structurally distinct new family of deubiquitinating enzymes. Mol Cell , 146–155. - PMC - PubMed
    1. Albuquerque CP, Smolka MB, Payne SH, Bafna V, Eng J, Zhou H. (2008). A multidimensional chromatography technology for in-depth phosphoproteome analysis. Mol Cell Proteomics , 1389–1396. - PMC - PubMed
    1. Amerik AY, Hochstrasser M. (2004). Mechanism and function of deubiquitinating enzymes. Biochim Biophys Acta , 189–207. - PubMed
    1. Amerik AY, Li SJ, Hochstrasser M. (2000). Analysis of the deubiquitinating enzymes of the yeast Saccharomyces cerevisiae. Biol Chem , 981–992. - PubMed
    1. Amerik A, Sindhi N, Hochstrasser M. (2006). A conserved late endosome-targeting signal required for Doa4 deubiquitylating enzyme function. J Cell Biol , 825–835. - PMC - PubMed

Publication types

MeSH terms

LinkOut - more resources