

Force localization modes in dynamic epithelial colonies
- PMID: 30207837
- PMCID: PMC6249864
- DOI: 10.1091/mbc.E18-05-0336
Force localization modes in dynamic epithelial colonies
Abstract
Collective cell behaviors, including tissue remodeling, morphogenesis, and cancer metastasis, rely on dynamics among cells, their neighbors, and the extracellular matrix. The lack of quantitative models precludes understanding of how cell-cell and cell-matrix interactions regulate tissue-scale force transmission to guide morphogenic processes. We integrate biophysical measurements on model epithelial tissues and computational modeling to explore how cell-level dynamics alter mechanical stress organization at multicellular scales. We show that traction stress distribution in epithelial colonies can vary widely for identical geometries. For colonies with peripheral localization of traction stresses, we recapitulate previously described mechanical behavior of cohesive tissues with a continuum model. By contrast, highly motile cells within colonies produce traction stresses that fluctuate in space and time. To predict the traction force dynamics, we introduce an active adherent vertex model (AAVM) for epithelial monolayers. AAVM predicts that increased cellular motility and reduced intercellular mechanical coupling localize traction stresses in the colony interior, in agreement with our experimental data. Furthermore, the model captures a wide spectrum of localized stress production modes that arise from individual cell activities including cell division, rotation, and polarized migration. This approach provides a robust quantitative framework to study how cell-scale dynamics influence force transmission in epithelial tissues.
Figures
 , and
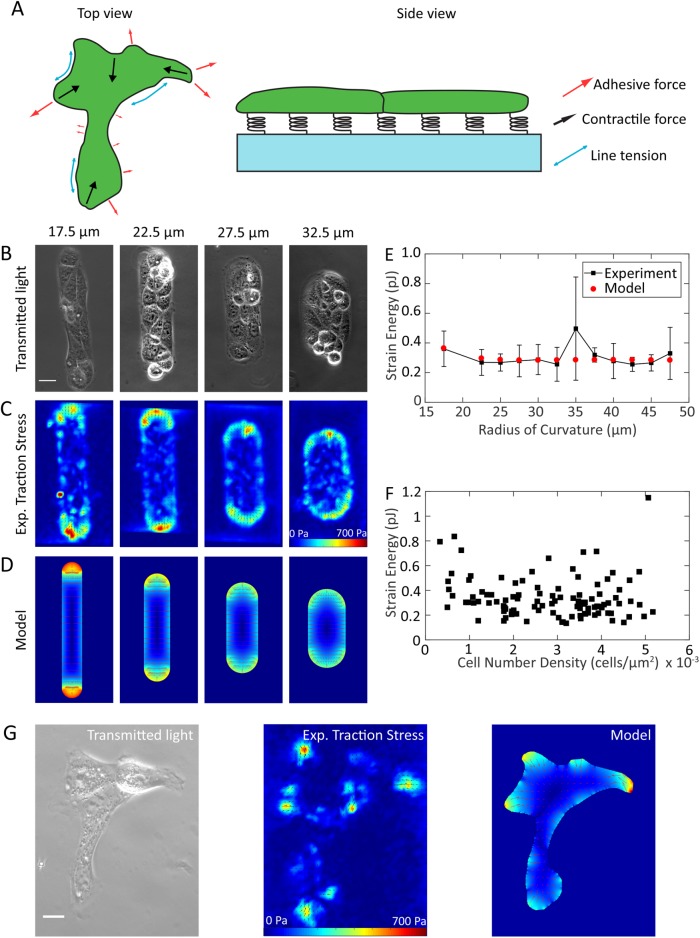
, and  . (E) Colony strain energy is independent of colony shape. Each data point represents the average over n = 4–9 colonies. (F) Strain energy does not depend on the number density of cells within a colony. (G) Traction stress organization in unconstrained MDCK colonies can also be described by the continuum model. Left to right, phase contrast, experimental traction map, and continuum model traction map images for an adherent colony on an unpatterned substrate. Model parameters are the same as in D. All scale bars = 25 μm.
 ,
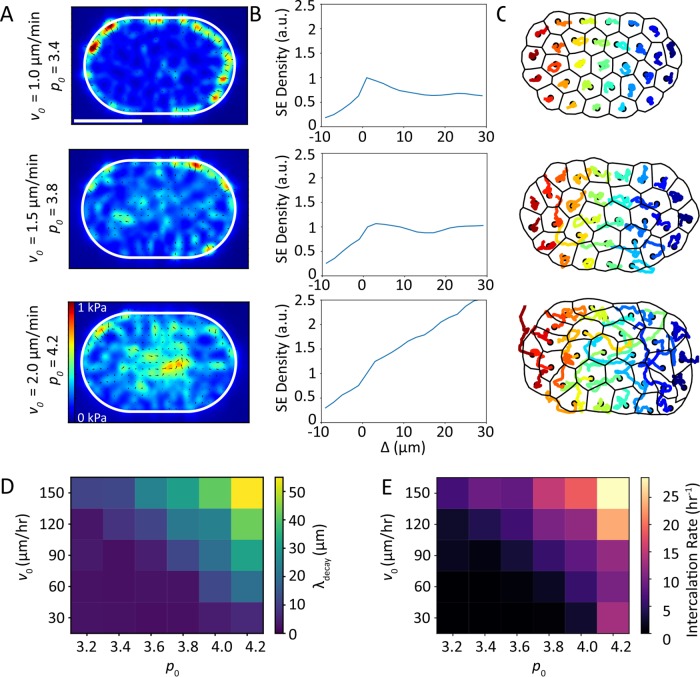
,  (top), medium motility cells,
  ,
,  (middle), and high motility cells,
  ,
,  (bottom). Δ is the distance from the boundary and is defined as negative outside of the cell colony and positive inside the cell colony. Scale bar represents 50 µm. (D) Traction stress decay length λ and (E) rate of cell neighbor exchanges (intercalations) for varying cell motility speed and cell shape index. The decay length λ is measured by fitting
  to the relevant strain energy density profiles.
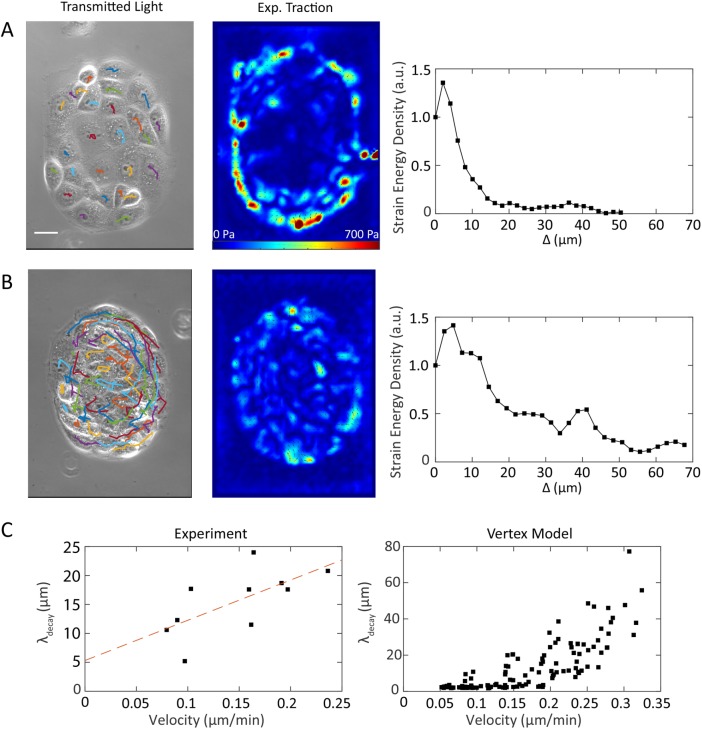
 ,
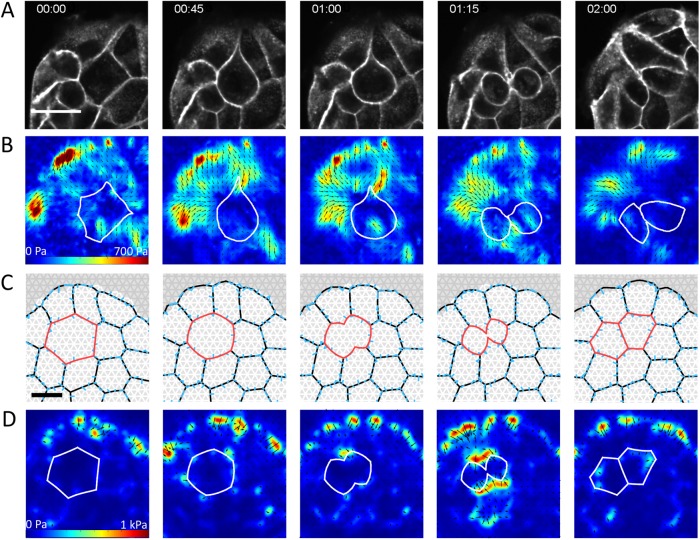
,  . The dividing cell is highlighted in red. Full details of the cell division implementation are given in the Supplemental Material. (D) Traction maps corresponding to C. All scale bars = 10 µm.
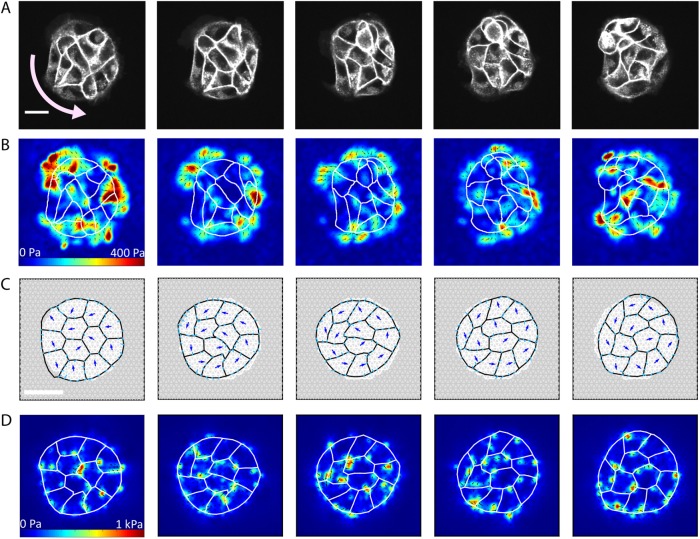
 ,
,  . Blue arrows show the direction of cell motion. Cell polarities align with cell velocity with time scale
  min and turn away from the micropattern boundary with time scale
  min. Full details can be found in the Supplemental Material. (D) Traction maps corresponding to C. All scale bars = 25 µm.
Similar articles
-
Regulation of epithelial cell organization by tuning cell-substrate adhesion.Integr Biol (Camb). 2015 Oct;7(10):1228-41. doi: 10.1039/c5ib00196j. Epub 2015 Sep 24. Integr Biol (Camb). 2015. PMID: 26402903 Free PMC article.
-
A hybrid model of intercellular tension and cell-matrix mechanical interactions in a multicellular geometry.Biomech Model Mechanobiol. 2020 Dec;19(6):1997-2013. doi: 10.1007/s10237-020-01321-8. Epub 2020 Mar 20. Biomech Model Mechanobiol. 2020. PMID: 32193709 Free PMC article.
-
Finite element analysis of traction force microscopy: influence of cell mechanics, adhesion, and morphology.J Biomech Eng. 2013 Jul 1;135(7):71009. doi: 10.1115/1.4024467. J Biomech Eng. 2013. PMID: 23720059 Free PMC article.
-
Mechanobiology of collective cell behaviours.Nat Rev Mol Cell Biol. 2017 Dec;18(12):743-757. doi: 10.1038/nrm.2017.98. Epub 2017 Nov 8. Nat Rev Mol Cell Biol. 2017. PMID: 29115298 Review.
-
Implementing vertex dynamics models of cell populations in biology within a consistent computational framework.Prog Biophys Mol Biol. 2013 Nov;113(2):299-326. doi: 10.1016/j.pbiomolbio.2013.09.003. Epub 2013 Oct 9. Prog Biophys Mol Biol. 2013. PMID: 24120733 Review.
Cited by
-
Cell-Matrix Elastocapillary Interactions Drive Pressure-based Wetting of Cell Aggregates.Phys Rev X. 2022 Jul-Sep;12(3):031027. doi: 10.1103/physrevx.12.031027. Epub 2022 Aug 17. Phys Rev X. 2022. PMID: 38009085 Free PMC article.
-
Extracellular matrix micropatterning technology for whole cell cryogenic electron microscopy studies.J Micromech Microeng. 2019 Nov;29(11):115018. doi: 10.1088/1361-6439/ab419a. Epub 2019 Sep 26. J Micromech Microeng. 2019. PMID: 32879557 Free PMC article.
-
From energy to cellular forces in the Cellular Potts Model: An algorithmic approach.PLoS Comput Biol. 2019 Dec 11;15(12):e1007459. doi: 10.1371/journal.pcbi.1007459. eCollection 2019 Dec. PLoS Comput Biol. 2019. PMID: 31825952 Free PMC article.
-
Mechanosensitive Junction Remodeling Promotes Robust Epithelial Morphogenesis.Biophys J. 2019 Nov 5;117(9):1739-1750. doi: 10.1016/j.bpj.2019.09.027. Epub 2019 Sep 28. Biophys J. 2019. PMID: 31635790 Free PMC article.
-
Nanofiber-microwell cell culture system for spatially patterned differentiation of pluripotent stem cells in 3D.Mater Today Bio. 2024 Jun 1;26:101109. doi: 10.1016/j.mtbio.2024.101109. eCollection 2024 Jun. Mater Today Bio. 2024. PMID: 38883422 Free PMC article.
References
-
- Banerjee S, Marchetti MC. (2012). Contractile stresses in cohesive cell layers on finite-thickness substrates. Phys Rev Lett , 108101. - PubMed
-
- Bi D, Lopez J, Schwarz J, Manning ML. (2015). A density-independent rigidity transition in biological tissues. Nat Phys , 1074.
Publication types
MeSH terms
Grants and funding
LinkOut - more resources
Full Text Sources
Other Literature Sources
