Case Reports
. 2018 Sep 13;379(11):1042-1049.
doi: 10.1056/NEJMoa1800024.

Essential Role of BRCA2 in Ovarian Development and Function

Affiliations
Case Reports

Essential Role of BRCA2 in Ovarian Development and Function

Ariella Weinberg-Shukron et al. N Engl J Med. .

Abstract

The causes of ovarian dysgenesis remain incompletely understood. Two sisters with XX ovarian dysgenesis carried compound heterozygous truncating mutations in the BRCA2 gene that led to reduced BRCA2 protein levels and an impaired response to DNA damage, which resulted in chromosomal breakage and the failure of RAD51 to be recruited to double-stranded DNA breaks. The sisters also had microcephaly, and one sister was in long-term remission from leukemia, which had been diagnosed when she was 5 years old. Drosophila mutants that were null for an orthologue of BRCA2 were sterile, and gonadal dysgenesis was present in both sexes. These results revealed a new role for BRCA2 and highlight the importance to ovarian development of genes that are critical for recombination during meiosis. (Funded by the Israel Science Foundation and others.).


Figures
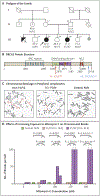
Figure 1.
Figure 1.. Gene Discovery and Characterization.
Panel A shows the pedigree of the family; the arrow indicates the proband. Circles indicate female family members, and squares male family members; the number 3 inside the square and circle indicates the numbers of brothers and sisters, respectively. The current ages are shown below the circles or squares. The slash denotes a deceased family member. Asterisks indicate the family members who were enrolled in the study, from whom the samples were obtained. Solid circles indicate the two sisters who had a normal female karyo-type (46,XX), ovarian dysgenesis, microcephaly (head circumferences of 48.7 cm in family member III-2 when she was 19 years of age and 47.5 cm in family member III-4 when she was 14 years of age), and café au lait spots. The older sister (III-2) also had received a diagnosis of leukemia at 5 years of age. The half-solid square indicates the brother who died from acute promyelocytic leukemia at 13 years of age. The gray circle indicates fetal death. V1 denotes the BRCA2 c.7579delG variant, V2 the BRCA2 c.9693delA variant, and N normal. Panel B is a depiction of the BRCA2 protein. The RAD51-binding domain includes eight repeated motifs called BRC repeats (blue). The DNA-binding domain contains a helical domain (H, green), three oligonucleotide binding folds (OB, purple), and a tower domain (T, orange). The nuclear localization signal (NLS) is near the C-terminal of the protein (red). The red arrow indicates the position of V1 and the blue arrow the position of V2 on the BRCA2 protein. BRCA2 p.V2527X is predicted to lack most of the DNA-binding domain and the NLS. BRCA2 p.S3231fs16*, with a predicted truncation of 171 residues, retains these domains. Panel C shows chromosomal breakage in the peripheral lymphocytes obtained from the pro-band (III-2 [V1/V2]), the mother (II-1 [V1/N]), and an unrelated control (N/N). Representative chromosomal breaks (Br) are marked by red arrows. Triradial (Tra), quadriradial (Qra), and complex rearrangements (cRa) are marked by dashed red arrows. Panel D shows the effect of increasing exposure to mitomycin C on chromosomal breaks in the cells of the two affected sisters (III-2 and III-4), the mother (II-1), a healthy sister (III-3), and an unrelated control (N/N). Chromosomes were first exposed to mitomycin C at increasing concentrations of 0 nM, 150 nM, and 300 nM according to a standard protocol. Because of the large number of chromosomal breaks observed at the 150 nM and 300 nM concentrations, the chromosomes were also exposed to mitomycin C at concentrations of 50 nM and 100 nM. Asterisks indicate more than 100 breaks per cell. The P values in the bottom row are comparisons between the affected sisters and V1/N persons (the mother and a healthy sister), and the P values in the top row are comparisons between the affected sisters and a control (Table S3 in the Supplementary Appendix).
Figure 2.
Figure 2.. Characterization of the Effect of BRCA2 Mutations in the Cells from the Enrolled Persons.
Panel A shows the results of the quantitative real-time reverse-transcriptase–polymerase-chain-reaction (RT-PCR) assays of BRCA2 transcripts. The bars represent the mean levels of BRCA2 RNA expression (shown as the percentage of wild-type) for each genotype from six RT-PCR assays performed in each person; T bars indicate the standard deviations. The results show that BRCA2 expression was significantly lower in the cells of the affected sisters (III-2 and III-4 [V1/V2]) than in those of their unaffected relatives (II-1 and III-3 [V1/N] and II-2 and III-5 [V2/N]) and of unrelated controls (N/N). NS denotes not significant. Panel B shows the quantification of Western blots of BRCA2 protein, with the use of the ImageJ image processing program from the National Institutes of Health; representative images are shown in Fig. S2 in the Supplementary Appendix. Lysates were obtained from lymphoblasts of all the enrolled family members and unrelated controls. The bars represent the mean levels of BRCA2 protein expression (shown as the percentage of wild-type) from six Western blot analyses performed for each person; T bars indicate the standard deviations. The results show that the levels of BRCA2 protein expression differed significantly among the compound heterozygotes (V1/V2), the heterozygotes (V1/N and V2/N), and the unrelated controls (N/N). The levels of BRCA2 protein expression in the samples from the compound heterozygotes were lower — by a factor of more than seven — than those in the samples from the controls who had no BRCA2 mutation. Panel C shows the effect of DNA damage induction by exposure to neocarzinostatin. Fibroblasts from an unrelated control (i though iv), from the mother (v through viii), and from the proband (ix through xii) were stained by immunofluorescence. Nuclei were stained with 4′,6-diamidino-2-phenylindole (DAPI) (blue [i, v, and ix]). γ-H2AX was detected with anti-phospho-Histone H2A.X (JBW301, Millipore) (green [ii, vi, and x]). RAD51 was detected with anti-RAD51 (N1C2, GeneTex) (red [iii, vii, and xi]). Merged staining of DAPI, γ-H2AX, and RAD51 is shown in iv, viii, and xii. Cells were visualized with the use of an Olympus fluorescent microscope with a ×60 objective lens. Panel D shows quantification of RAD51 foci formation after neocarzinostatin exposure (shown in Panel C). Bars represent the proportion of RAD51-positive γ-H2AX foci in mutant and nonmutant cells. T bars indicate the standard deviations. Foci were counted by a person who was unaware of the cellular genotype. The number of RAD51-positive foci was lower in the compound heterozygote cells (V1/V2) than in the cells from a carrier (V1/N) and in normal cells (N/N) by a factor of at least six.
Figure 3.
Figure 3.. Drosophila Model of the BRCA2-Null Genotype.
Panel A shows that homozygous deletion of the drosophila orthologue of BRCA2 leads to sterility in female and male flies. Female and male Dmbrca2−/− flies were crossed with wild-type controls to evaluate egg and progeny production. The results are presented as the mean daily number of eggs and progeny produced by each of the crosses indicated below the x axis (as averaged across three to five replicates per cross); T bars indicate the standard deviations. Eggs and progeny were counted daily for 3 days. The mean daily number of eggs laid by Dmbrca2-null female flies (−/− female) crossed with wild-type control male flies (yw male) was lower than the mean daily number of eggs laid by wild-type female flies (yw female) crossed with wild-type male flies (yw male) by a factor of 19.5 (mean daily number, 22 vs. 428, P = 0.001). In comparison with the mean daily number of eggs hatched when wild-type female flies were crossed with wild-type male flies (388 of 428 eggs hatched [91%]), only 1 of a total of 214 eggs hatched among the Dmbrca2-null female flies that were crossed with wild-type male flies and 1 of a total of 2116 eggs hatched among the Dmbrca2-null male flies that were crossed with wild-type female flies. Panel B shows the percentages of abnormal ovary and testes phenotypes in Dmbrca2-null flies. Among 62 female flies tested, most ovarioles (69%) were severely dysgenic, 27% were moderately abnormal, and 4% were mildly abnormal. Among 59 male flies tested, nearly all testes (92%) were severely or moderately abnormal; 8% were mildly abnormal. Panel C shows the morphologic features and immunostaining of the drosophila ovaries and testes. The panels on the left for the wild-type control flies show normal, healthy morphologic features of both the ovaries and testes, as compared with the panels on the left for the Dmbrca2-null flies that show shrunken, underdeveloped ovaries and testes. The panels on the right for both the wild-type control flies and the Dmbrca2-null flies show the results of immunostaining. Nuclear DNA is green, actin is blue, and cleaved caspase-3 (indicating apoptosis) is red. Dmbrca2+/− (Fig. S4 in the Supplementary Appendix) and wild-type control flies had normal ovarioles, with normal nuclear DNA and actin and no staining of cleaved caspase-3. Dmbrca2-null flies had ovarioles with disintegrated egg chambers, as indicated by nuclear DNA condensation, disappearance of actin structures, and marked staining of cleaved caspase-3. Dmbrca2+/− (Fig. S4 in the Supplementary Appendix) and wild-type control flies had normal testes, with normal appearance of cleaved caspase-3 in differentiating spermatids. Dmbrca2-null flies had abnormal testes without differentiation of spermatids and with abnormal appearance of cleaved caspase-3.

Comment in

  • BRCA2 in Ovarian Development and Function.
    Qin Y, Zhang F, Chen ZJ. Qin Y, et al. N Engl J Med. 2019 Mar 14;380(11):1086. doi: 10.1056/NEJMc1813800. N Engl J Med. 2019. PMID: 30865812 No abstract available.
  • BRCA2 in Ovarian Development and Function.
    Turchetti D, Zuntini R, Tricarico R, Bellacosa A. Turchetti D, et al. N Engl J Med. 2019 Mar 14;380(11):1086-1087. doi: 10.1056/NEJMc1813800. N Engl J Med. 2019. PMID: 30865813 No abstract available.

Similar articles

Cited by

References

    1. Rossetti R, Ferrari I, Bonomi M, Persani L. Genetics of primary ovarian insufficiency. Clin Genet 2017;91: 183–98. - PubMed
    1. Tenenbaum-Rakover Y, Weinberg-Shukron A, Renbaum P, et al. Minichromosome maintenance complex component 8 (MCM8) gene mutations result in primary gonadal failure. J Med Genet 2015; 52: 391–9. - PubMed
    1. Smirin-Yosef P, Zuckerman-Levin N, Tzur S, et al. A biallelic mutation in the homologous recombination repair gene SPIDR is associated with human gonadal dysgenesis. J Clin Endocrinol Metab 2017; 102: 681–8. - PubMed
    1. Eggers S, Ohnesorg T, Sinclair A. Genetic regulation of mammalian gonad development. Nat Rev Endocrinol 2014; 10: 673–83. - PubMed
    1. Navon Elkan P, Pierce SB, Segel R, et al. Mutant adenosine deaminase 2 in a polyarteritis nodosa vasculopathy. N Engl J Med 2014; 370: 921–31. - PubMed

Publication types

MeSH terms