. 2018 Sep 12;16(9):e2005903.
doi: 10.1371/journal.pbio.2005903. eCollection 2018 Sep.

Lso2 is a conserved ribosome-bound protein required for translational recovery in yeast

Affiliations

Lso2 is a conserved ribosome-bound protein required for translational recovery in yeast

Yinuo J Wang et al. PLoS Biol. .

Abstract

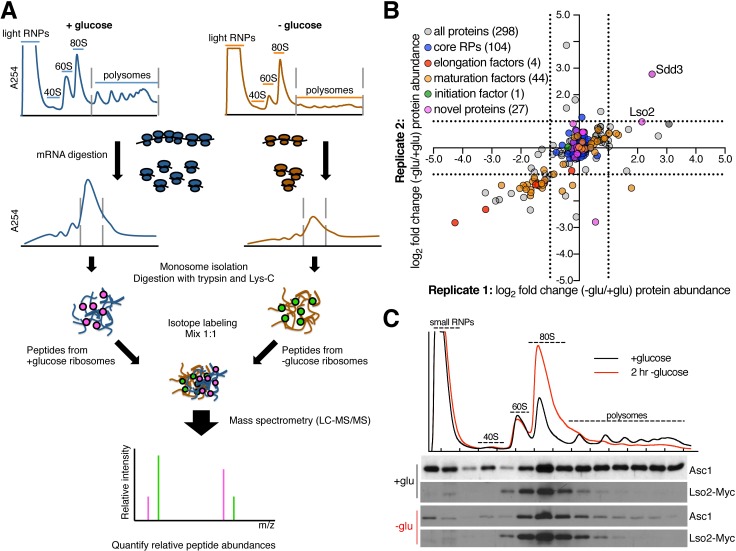
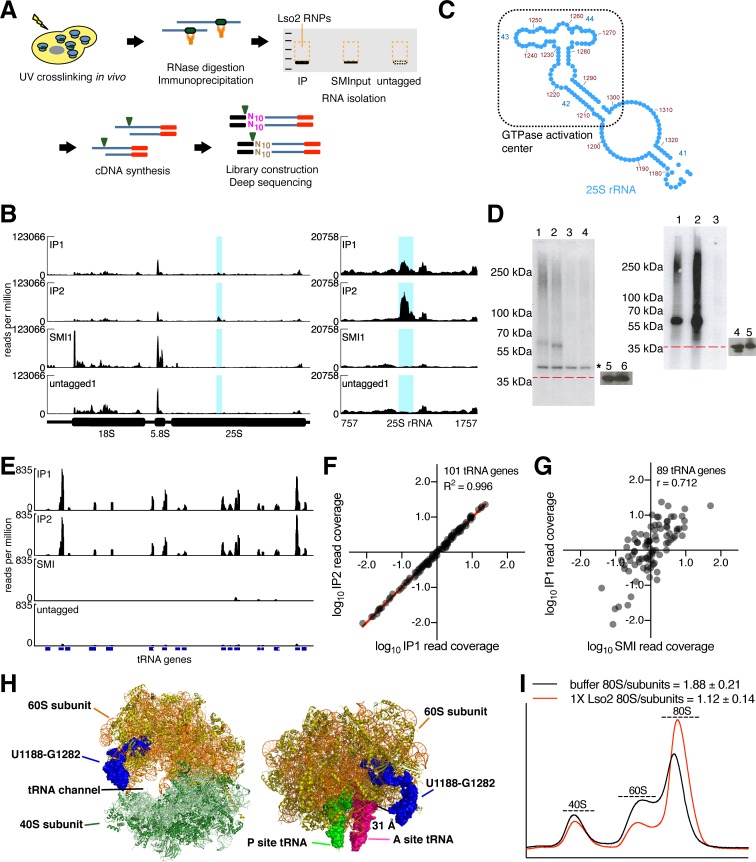
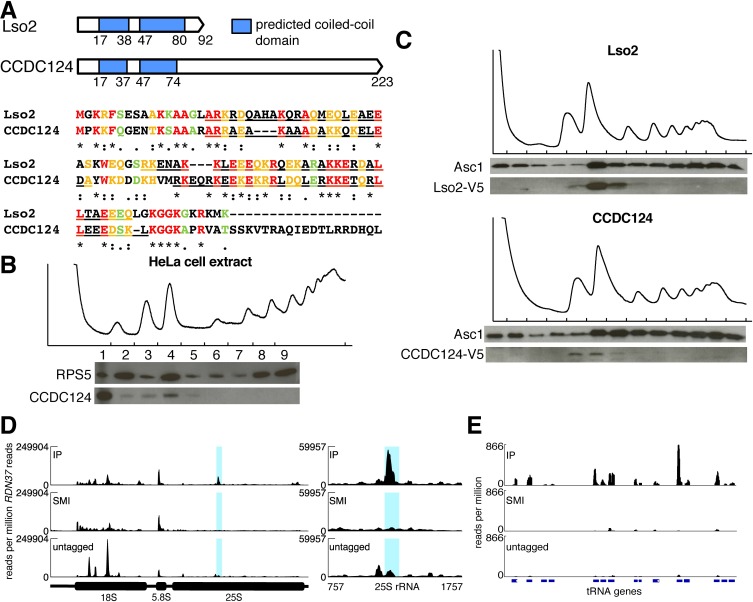
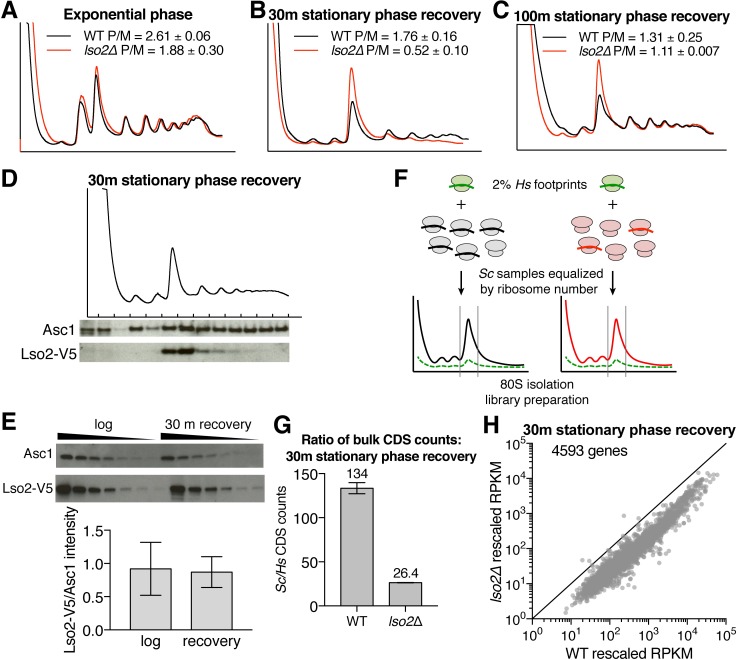
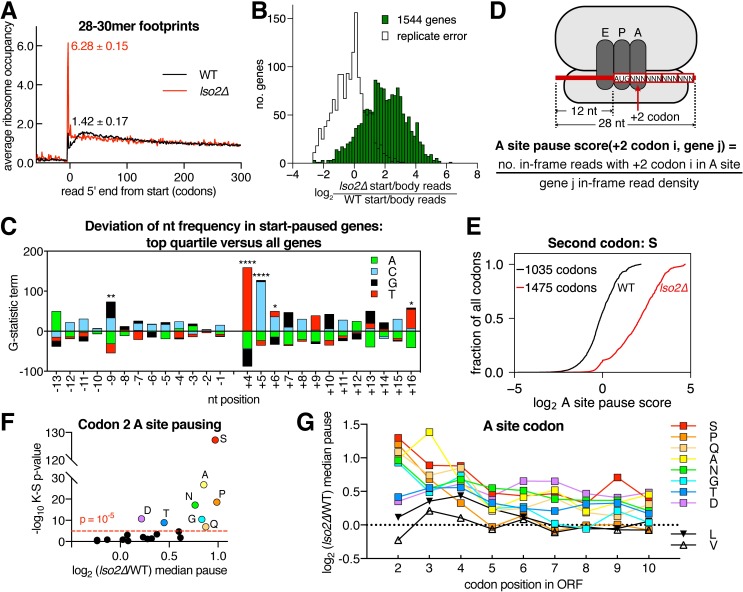
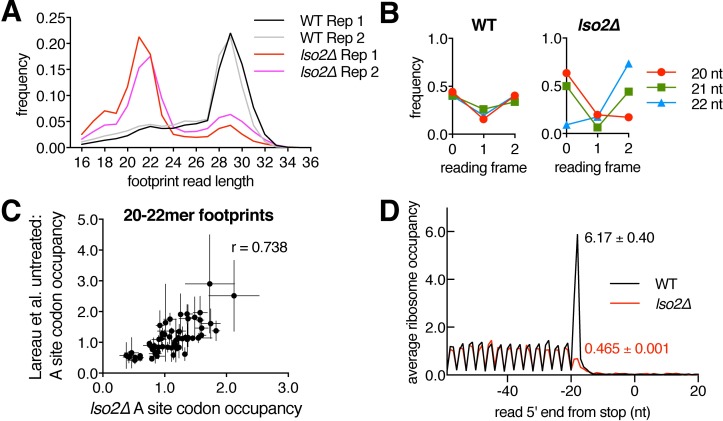
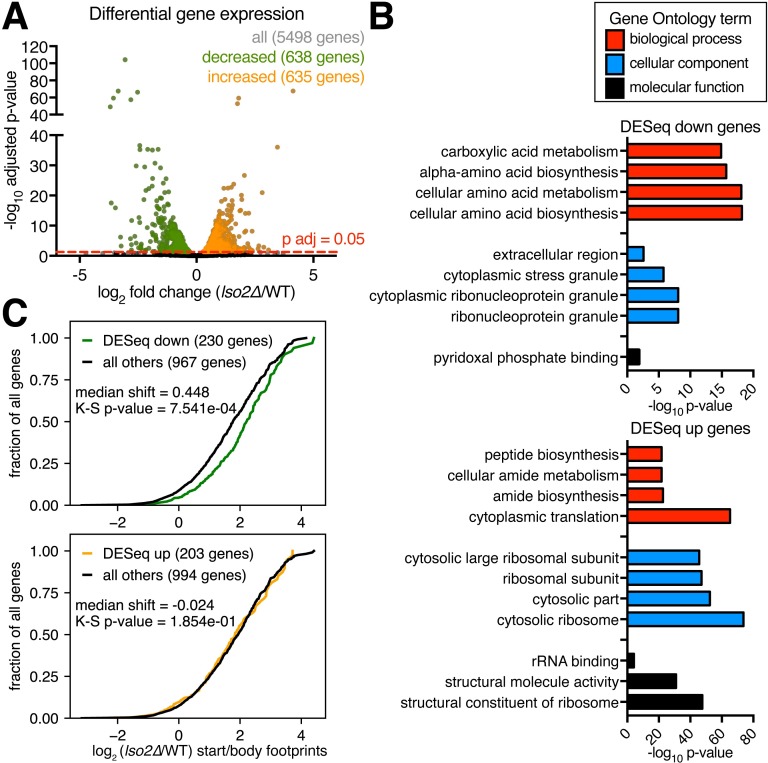
Ribosome-binding proteins function broadly in protein synthesis, gene regulation, and cellular homeostasis, but the complete complement of functional ribosome-bound proteins remains unknown. Using quantitative mass spectrometry, we identified late-annotated short open reading frame 2 (Lso2) as a ribosome-associated protein that is broadly conserved in eukaryotes. Genome-wide crosslinking and immunoprecipitation of Lso2 and its human ortholog coiled-coil domain containing 124 (CCDC124) recovered 25S ribosomal RNA in a region near the A site that overlaps the GTPase activation center. Consistent with this location, Lso2 also crosslinked to most tRNAs. Ribosome profiling of yeast lacking LSO2 (lso2Δ) revealed global translation defects during recovery from stationary phase with translation of most genes reduced more than 4-fold. Ribosomes accumulated at start codons, were depleted from stop codons, and showed codon-specific changes in occupancy in lso2Δ. These defects, and the conservation of the specific ribosome-binding activity of Lso2/CCDC124, indicate broadly important functions in translation and physiology.


Conflict of interest statement

The authors have declared that no competing interests exist.

Figures

Fig 1
Fig 1. Lso2 associates with yeast ribosomes in two growth conditions.
(A) Overview of method for purifying yeast ribosomes from glucose-replete and glucose-starved conditions for analysis by mass spectrometry. (B) Abundance changes in the ribo-proteome upon glucose starvation. Each axis, which represents 1 of 2 biological replicates, shows the log2 fold change in protein abundance at 2 hours of glucose starvation versus during log phase. The core RPs as a cohort are clustered at the origin, which enables quantification of changes in the stoichiometry of other proteins relative to the ribosome. The dashed lines demarcate abundance changes greater than 2-fold. (C) A Myc-tagged LSO2 strain was grown to log phase in YPAD (+glucose) or to log phase in YPAD and then shifted to YPA (lacking glucose) for 2 hours (2 hr -glucose). Cells were harvested for fractionation through a sucrose gradient, and fractions were probed for the Myc epitope and for the core 40S protein Asc1 as a loading control. See also S1 Fig and S1 Table. LC-MS/MS, liquid chromatography–tandem mass spectrometry; Lso2, late-annotated short open reading frame 2; RNP, ribonucleoprotein; RP, ribosomal protein; Sdd3, suppressor of degenerative death 3; YPA, yeast extract, peptone, adenine medium; YPAD, YPA with glucose.
Fig 2
Fig 2. Lso2 crosslinks to 25S rRNA near the A site and to tRNAs.
(A) Overview of ePAR-CLIP library construction. (B) (Left) Normalized read coverage across the RDN37 locus in ePAR-CLIP libraries prepared with 1:20,000,000 RNase I. The y-axis is reads per million reads in the entire library. Two untagged IP libraries and 2 SMI libraries, each strain-matched to an IP replicate, were the controls in this set. One SMI and 1 untagged library are shown for clarity. Blue bars indicate the region that was significantly enriched (fold-enrichment > 4, p < 10−5) in both IP replicates relative to its paired SMI, as well as to the 2 untagged libraries. (Right) Inset of normalized read coverage across the enriched region in RDN25. (C) Secondary structure of the subregion of 25S rRNA [47] containing the Lso2 crosslink cluster. Helices 42, 43, and 44 comprise the GTPase activation center. (D) (Left) Diagnostic electrophoresis membrane of radiolabeled Lso2-RNPs from ePAR-CLIP libraries prepared with 1:20,000,000 RNase I. The red line indicates the position of Lso2-Myc alone (without crosslinked RNAs), based on the positions of protein markers. Lanes 1 and 2, IP replicates; lanes 3 and 4, untagged replicates; lanes 5 and 6, western blots of Lso2-Myc in 0.5% of the input and in 13% of the IP, respectively. The region from 50 kDa to approximately 130 kDa was excised for each sample. Asterisk indicates a nonspecific labeled RNA species present in all libraries. (Right) As in left, except from ePAR-CLIP libraries prepared with 1:2,000,000 RNase I. Lanes 1 and 2, IP replicates; lane 3, untagged; lanes 4 and 5, western blots of Lso2-Myc in 0.5% of the input and in 13% of the IP, respectively. The region from 35 kDa to 100 kDa was excised for each sample. (E) Normalized read coverage across a series of negative strand tRNA features in ePAR-CLIP libraries prepared with 1:2,000,000 RNase I. The y-axis is reads per million reads in the entire library. Blocks represent exons, while thin lines represent introns. (F) Correlation of tRNA read densities between the IP replicates made with 1:2,000,000 RNase I. Read density values were median centered and log10 transformed. R2 of linear fit is indicated. (G) Correlation of tRNA read densities between IP replicate 1 versus the SMI for ePAR-CLIP libraries made with 1:2,000,000 RNase I. Read density values were median centered and log10 transformed. (H) (Left) The rRNA crosslink cluster from (B) on the crystal structure of the 80S ribosome ([48], PDB 4V88). (Right) The identical cluster on a cryo-EM structure of the 60S subunit containing P and A site tRNAs in the classic state ([49], PDB 5GAK). (I) Lso2 stabilizes ribosomal subunit association in vitro. One μM each (100 pmol) of 40S subunits and 60S subunits purified from yeast lso2Δ was mixed with 1 μM (100 pmol) of purified recombinant Lso2 or with an equivalent volume of buffer. The mixture was incubated at 37°C for 10 minutes before fractionation through a sucrose gradient. The ratio of 80S ribosomes to the sum of 40S and 60S subunits was quantified. n = 3 technical replicates; mean ± S.D. See also S2 Fig and S2 Table. EM, electron microscopy; ePAR-CLIP, photoactivatable ribonucleoside crosslinking and immunoprecipitation and an enhanced method of CLIP library preparation; IP, immunoprecipitation; Lso2, late-annotated short open reading frame 2; Lso2-Myc, yeast strains expressing Myc-tagged Lso2 at endogenous levels; PDB, Protein Data Bank; RNP, ribonucleoprotein; rRNA, ribosomal RNA; SMI, size-matched input.
Fig 3
Fig 3. The ribosome-binding activity of yeast Lso2 is conserved in its human ortholog.
(A) (Top) Schematic of coiled-coil domains in Lso2 and CCDC124. (Bottom) Protein sequence alignment of yeast Lso2 with human CCDC124. (B) HeLa cell extract was fractionated through a sucrose gradient containing 5 mM magnesium. Equivalent fraction volumes were TCA precipitated and loaded in each lane. Fractions were probed for RPS5 and for endogenous CCDC124. (C) For both strains, cell extracts were fractionated through a sucrose gradient and the fractions probed for Asc1 and V5. (Top) The yeast LSO2 gene was tagged with V5 in a marker-free insertion. (Bottom) The yeast LSO2 gene was swapped with V5-tagged CCDC124 in a marker-free replacement. (D) (Left) Internally normalized read coverage across the RDN37 locus in CCDC124-Myc ePAR-CLIP libraries. The y-axis is reads per million reads mapping to RDN37. The blue region is the 25S rRNA cluster that reproducibly crosslinked to Lso2-Myc (Fig 2B). (Right) Inset of RDN37-normalized read coverage across the RDN25 region crosslinking to Lso2-Myc. (E) Normalized read coverage across a series of negative-strand tRNA features in CCDC124-Myc ePAR-CLIP libraries. Y-axis is reads per million reads in the entire library. See also S3 Fig and S3 Table. CCDC124, coiled-coil domain containing 124; ePAR-CLIP, photoactivatable ribonucleoside crosslinking and immunoprecipitation and an enhanced method of CLIP library preparation; IP, immunoprecipitation; Lso2, late-annotated short open reading frame 2; Lso2-Myc, yeast strains expression Myc-tagged Lso2 at endogenous levels; RPS5, ribosomal protein S5; TCA, trichloroacetic acid.
Fig 4
Fig 4. Lso2 is required for global translation during recovery from stationary phase.
(A) Gradient profiling of WT and lso2-null strains during exponential phase, with quantification of the polysome-to-monosome ratios (“P/M”). n = 3 biological replicates; mean ± S.D. (B) WT and lso2Δ were grown in YPAD for 4 days and then transferred to fresh YPAD for 30 minutes before harvesting for gradient profiling. The polysome-to-monosome ratios of each strain are quantified. n ≥ 2 biological replicates; mean ± S.D. (C) As in (B), except that WT and lso2Δ were recovered for 100 minutes in YPAD following stationary phase. n = 2 biological replicates; mean ± S.D. (D) V5-tagged LSO2 strains were grown in YPAD for 4 days and then transferred to fresh YPAD for 30 minutes before harvesting for gradient profiling. Gradient fractions were probed for the V5 epitope and for Asc1. Shown are representative data from 2 biological replicates. (E) V5-tagged LSO2 strains were grown either to log phase or for 4 days followed by 30 minutes of recovery in fresh YPAD. Extracts from each sample were loaded in a 2-fold dilution series and probed for the V5 epitope and for Asc1. The slope of signal intensity versus dilution factor was used as the abundance of each protein (Materials and methods). n ≥ 1 technical replicate for each of 2 biological replicates; mean ± S.D. (F) Overview of ribosome profiling method using internal standards for absolute comparisons of mRNA abundances between conditions. (G) The ratio of all unique yeast to all unique human CDS-mapping read counts in each condition, which is a measure of global protein synthesis. n = 2 biological replicates; mean ± S.D. (H) Yeast RPKMs from each library were rescaled using the slope of the linear regression of human RPKMs from that library versus the normalizing library (fixed as lso2Δ replicate 1). Plotted are the averages of rescaled RPKMs from the 2 lso2Δ replicates versus the averages of rescaled RPKMs from the 2 WT replicates. See also S4 Fig. CDS, coding sequence; Lso2, late-annotated short open reading frame 2; RPKM, read per kilobase per million reads; WT, wild type; YPAD, yeast extract, peptone, adenine medium with glucose.
Fig 5
Fig 5. Absence of Lso2 perturbs early elongation.
(A) Metaribosome occupancy in a window around the start codon for 28–30 mer footprints. Numbers indicate the respective start codon occupancy in WT and lso2Δ. n = 2 biological replicates; mean ± S.D. (B) Histogram of change in the ratio of start codon to ORF body footprints in lso2Δ versus WT for each gene with ≥64 reads. Black trace (replicate error) indicates the same comparison for WT replicate 1 versus replicate 2. (C) Nucleotide usage bias in the top quartile of genes shown in (B). −1 and +4 indicate the first nucleotide upstream and downstream of the start codon, respectively. At each position, the G-statistic contribution of nucleotide N was calculated as 2ONln(ONEN), where ON is the observed counts of N usage in the top quartile, and EN is the expected counts based on the usage frequency of all genes analyzed. Bonferroni-corrected p-values are indicated by asterisks. *, p < 0.05; **, p < 0.01; ***, p < 0.001, ****, p < 0.0001. (D) Anatomy of ribosome footprint used to calculate pause scores of codon 2 in the A site. The number of read 5′ ends was divided by the density of all in-frame reads within the encoding gene. (E) Empirical cumulative distribution of pausing at +2 serine codons in the A site, which are challenging to translate in lso2Δ. Each trace is from merged WT and lso2Δ replicates, respectively. (F) For each indicated +2 codon in the A site, empirical cumulative distributions of pause scores were computed for WT and lso2Δ as in (E). The K-S p-value and median shift of lso2Δ versus WT pause-score distributions are plotted. The 8 most challenging +2 codons (median increase > 1.78-fold, p-value < 10−6) are highlighted. (G) For the 8 challenging +2 codons highlighted in (F), the median pause shift was also calculated in the same manner for each of codon positions +3 to +10. Calculations are based on the specified codon filling the A site. K-S, Kolmogorov-Smirnov; Lso2, late-annotated short open reading frame 2; WT, wild type.
Fig 6
Fig 6. Absence of Lso2 leads to pervasive changes in global elongation and termination.
(A) Distribution of footprint read lengths from all CDS regions in WT and lso2Δ libraries. (B) Reading frame analysis of 20–22 mer footprints from WT and lso2Δ libraries based on 5′ ends. (C) Correlation of 20–22 mer codon occupancies from lso2Δ versus 20–22 mer codon occupancies from the WT untreated condition of [73]. Plotted are the means ± S.D. of 2 lso2Δ and 3 untreated biological replicates. (D) As in Fig 5A, except that read 5′ end is relative to the stop codon. Numbers indicate the respective stop codon occupancies in WT and lso2Δ. See also S5 Fig. CDS, coding sequence; Lso2, late-annotated short open reading frame 2; WT, wild type.
Fig 7
Fig 7. Differential gene expression in lso2Δ correlates with start codon pausing.
(A) Benjamini-Hochberg-corrected p-value versus fold change in footprints for lso2Δ versus WT, as determined by DESeq2. Decreased or increased genes with adjusted p-value < 0.05 are highlighted. LSO2 (log2 fold change = −9.61, p-adjusted = 3.00E-18) is omitted for space. (B) Gene Ontology annotations and p-values of enrichment for the DESeq-decreased and DESeq-increased categories, respectively. (C) Empirical cumulative distribution plots of the change in start codon to body read ratio for DESeq-decreased (top) and DESeq-increased (bottom) genes, respectively. Only genes with ≥64 reads were included. See also S6 Fig and S4 Table. K-S, Kolmogorov-Smirnov; rRNA, ribosomal RNA; WT, wild type.

Similar articles

Cited by

References

    1. Doma MK, Parker R. Endonucleolytic cleavage of eukaryotic mRNAs with stalls in translation elongation. Nature. 2006;440(7083):561–4. 10.1038/nature04530 - DOI - PMC - PubMed
    1. Ge Z, Mehta P, Richards J, Karzai AW. Non-stop mRNA decay initiates at the ribosome. Molecular Microbiology. 2010;78(5):1159–70. 10.1111/j.1365-2958.2010.07396.x - DOI - PMC - PubMed
    1. Tsuboi T, Kuroha K, Kudo K, Makino S, Inoue E, Kashima I, et al. Dom34:hbs1 plays a general role in quality-control systems by dissociation of a stalled ribosome at the 3' end of aberrant mRNA. Molecular Cell. 2012;46(4):518–29. 10.1016/j.molcel.2012.03.013 - DOI - PubMed
    1. Brandman O, Hegde RS. Ribosome-associated protein quality control. Nature Structural & Molecular Biology. 2016;23(1):7–15. - PMC - PubMed
    1. Brandman O, Stewart-Ornstein J, Wong D, Larson A, Williams CC, Li G-W, et al. A ribosome-bound quality control complex triggers degradation of nascent peptides and signals translation stress. Cell. 2012;151(5):1042–54. 10.1016/j.cell.2012.10.044 - DOI - PMC - PubMed

Publication types

MeSH terms