Phenological responses of 215 moth species to interannual climate variation in the Pacific Northwest from 1895 through 2013
- PMID: 30208046
- PMCID: PMC6135373
- DOI: 10.1371/journal.pone.0202850
Phenological responses of 215 moth species to interannual climate variation in the Pacific Northwest from 1895 through 2013
Abstract
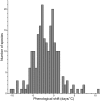
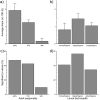
Climate change has caused shifts in the phenology and distributions of many species but comparing responses across species is challenged by inconsistencies in the methodology and taxonomic and temporal scope of individual studies. Natural history collections offer a rich source of data for examining phenological shifts for a large number of species. We paired specimen records from Pacific Northwest insect collections to climate data to analyze the responses of 215 moth species to interannual climate variation over a period of 119 years (1895-2013) during which average annual temperatures have increased in the region. We quantified the effects of late winter/early spring temperatures, averaged annually across the region, on dates of occurrence of adults, taking into account the effects of elevation, latitude, and longitude. We assessed whether species-specific phenological responses varied with adult flight season and larval diet breadth. Collection dates were significantly earlier in warmer years for 36.3% of moth species, and later for 3.7%. Species exhibited an average phenological advance of 1.9 days/°C, but species-specific shifts ranged from an advance of 10.3 days/°C to a delay of 10.6 days/°C. More spring-flying species shifted their phenology than summer- or fall-flying species. These responses did not vary among groups defined by larval diet breadth. The highly variable phenological responses to climate change in Pacific Northwest moths agree with other studies on Lepidoptera and suggest that it will remain difficult to accurately forecast which species and ecological interactions are most likely to be affected by climate change. Our results also underscore the value of natural history collections as windows into long-term ecological trends.
Conflict of interest statement
The authors have declared that no competing interests exist.
Figures


Similar articles
-
Spring- and fall-flowering species show diverging phenological responses to climate in the Southeast USA.Int J Biometeorol. 2019 Apr;63(4):481-492. doi: 10.1007/s00484-019-01679-0. Epub 2019 Feb 8. Int J Biometeorol. 2019. PMID: 30734127
-
Ecological traits explain long-term phenological trends in solitary bees.J Anim Ecol. 2023 Feb;92(2):285-296. doi: 10.1111/1365-2656.13778. Epub 2022 Aug 2. J Anim Ecol. 2023. PMID: 35839142
-
Changes in urban plant phenology in the Pacific Northwest from 1959 to 2016: anthropogenic warming and natural oscillation.Int J Biometeorol. 2018 Sep;62(9):1675-1684. doi: 10.1007/s00484-018-1567-6. Epub 2018 Jun 18. Int J Biometeorol. 2018. PMID: 29911283
-
Temperature-sensitive development shapes insect phenological responses to climate change.Curr Opin Insect Sci. 2022 Aug;52:100897. doi: 10.1016/j.cois.2022.100897. Epub 2022 Mar 5. Curr Opin Insect Sci. 2022. PMID: 35257968 Review.
-
Predicted responses of arctic and alpine ecosystems to altered seasonality under climate change.Glob Chang Biol. 2014 Oct;20(10):3256-69. doi: 10.1111/gcb.12568. Epub 2014 Jun 2. Glob Chang Biol. 2014. PMID: 24599697 Review.
Cited by
-
Forecasting the seasonal phenology of Agrotis ipsilon in Oregon grass seed and vegetable agroecosystems.Front Insect Sci. 2025 Jan 17;4:1505524. doi: 10.3389/finsc.2024.1505524. eCollection 2024. Front Insect Sci. 2025. PMID: 39896271 Free PMC article.
-
Phenological responses to climate change based on a hundred years of herbarium collections of tropical Melastomataceae.PLoS One. 2021 May 7;16(5):e0251360. doi: 10.1371/journal.pone.0251360. eCollection 2021. PLoS One. 2021. PMID: 33961684 Free PMC article.
-
Monitoring of adult emergence in the pine processionary moth between 1970 and 1984 in Mont Ventoux, France.Biodivers Data J. 2021 Feb 17;9:e61086. doi: 10.3897/BDJ.9.e61086. eCollection 2021. Biodivers Data J. 2021. PMID: 33654450 Free PMC article.
-
Species' traits modulate rapid changes in flight time in high-Arctic muscid flies under climate change.Proc Biol Sci. 2025 Jul;292(2050):20250970. doi: 10.1098/rspb.2025.0970. Epub 2025 Jul 9. Proc Biol Sci. 2025. PMID: 40628477 Free PMC article.
-
Climate change effects on animal ecology: butterflies and moths as a case study.Biol Rev Camb Philos Soc. 2021 Oct;96(5):2113-2126. doi: 10.1111/brv.12746. Epub 2021 May 30. Biol Rev Camb Philos Soc. 2021. PMID: 34056827 Free PMC article. Review.
References
-
- Parmesan C. Ecological and evolutionary responses to recent climate change. Annu Rev Ecol Evol Syst 2006; 37: 637–669.
Publication types
MeSH terms
Associated data
LinkOut - more resources
Full Text Sources
Other Literature Sources
Medical

