

Malaria intensity in Colombia by regions and populations
- PMID: 30208075
- PMCID: PMC6135511
- DOI: 10.1371/journal.pone.0203673
Malaria intensity in Colombia by regions and populations
Abstract
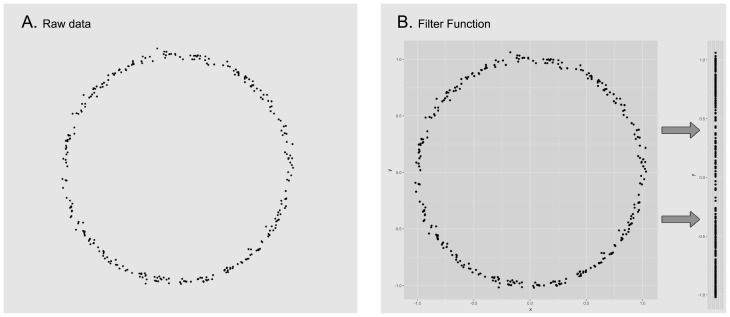
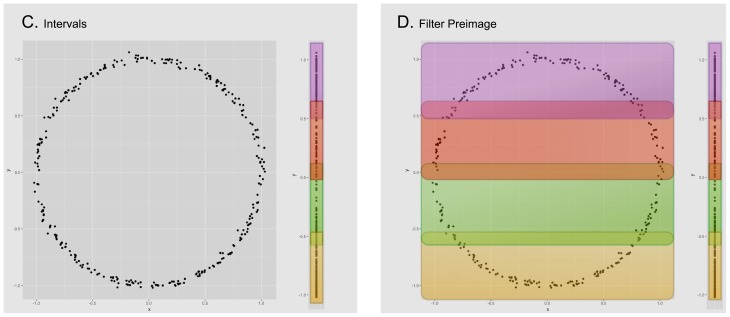
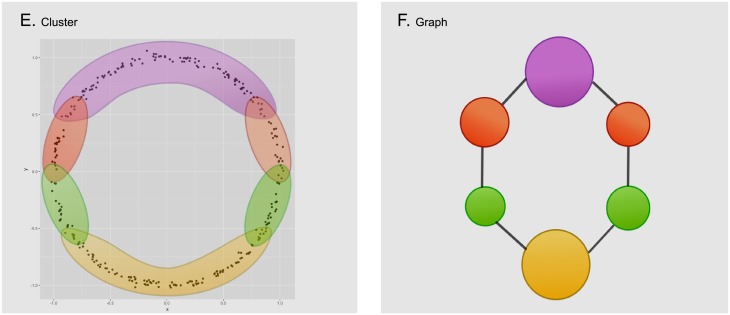
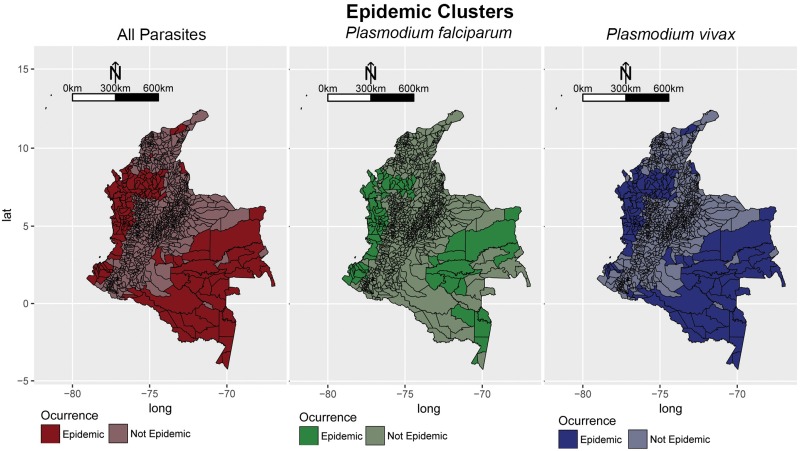
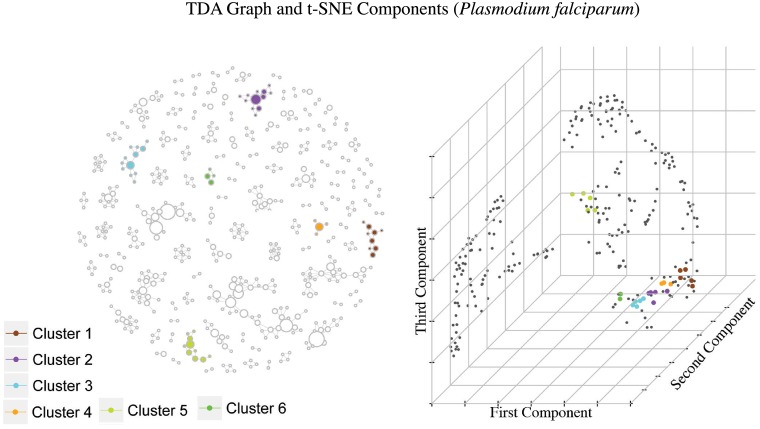
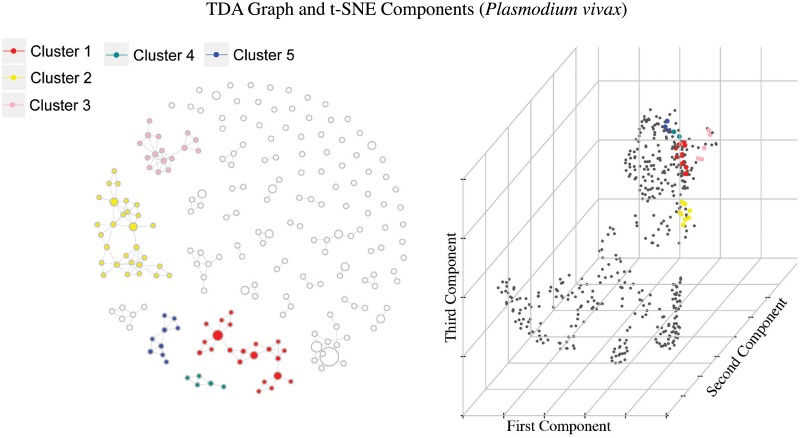
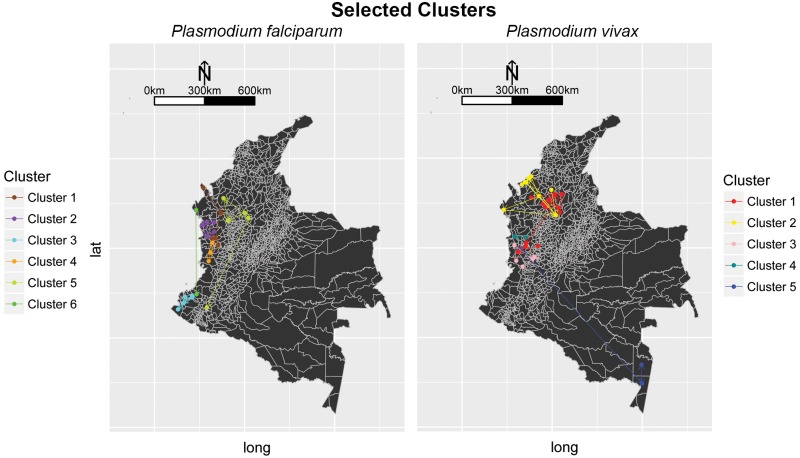
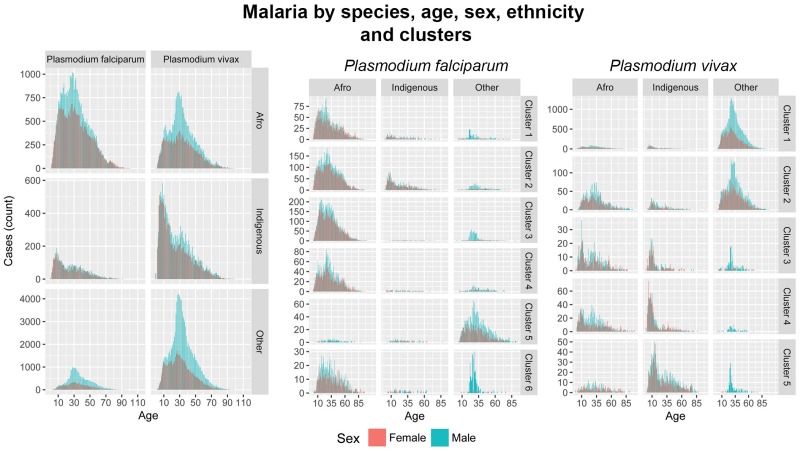
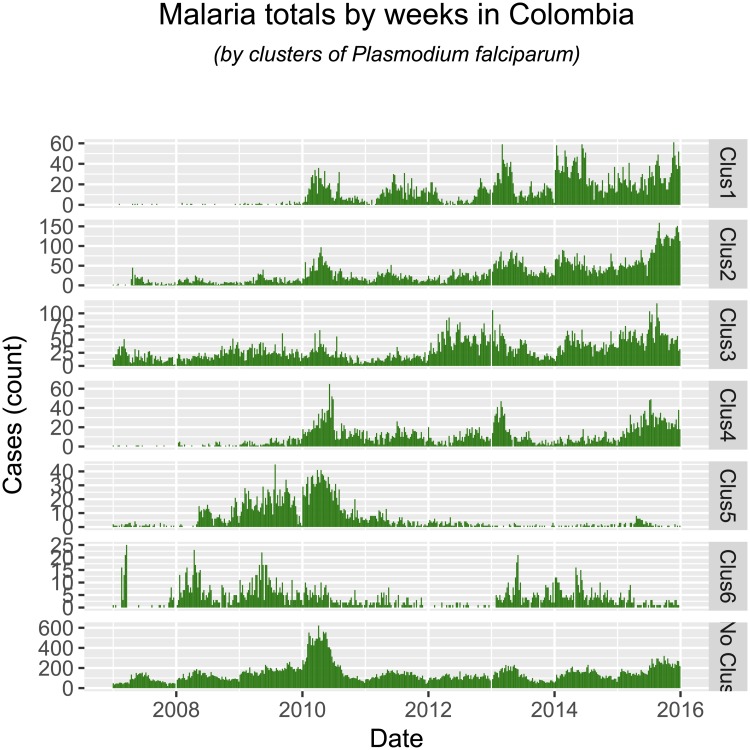
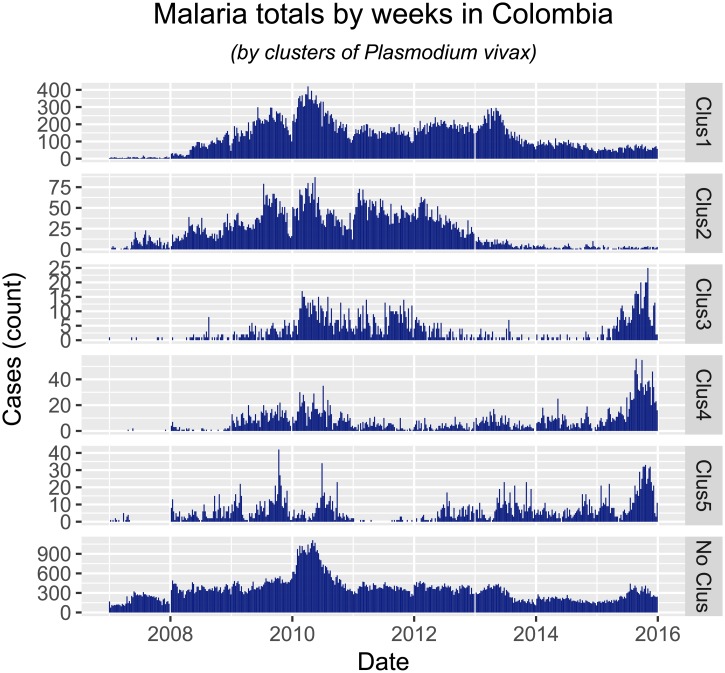
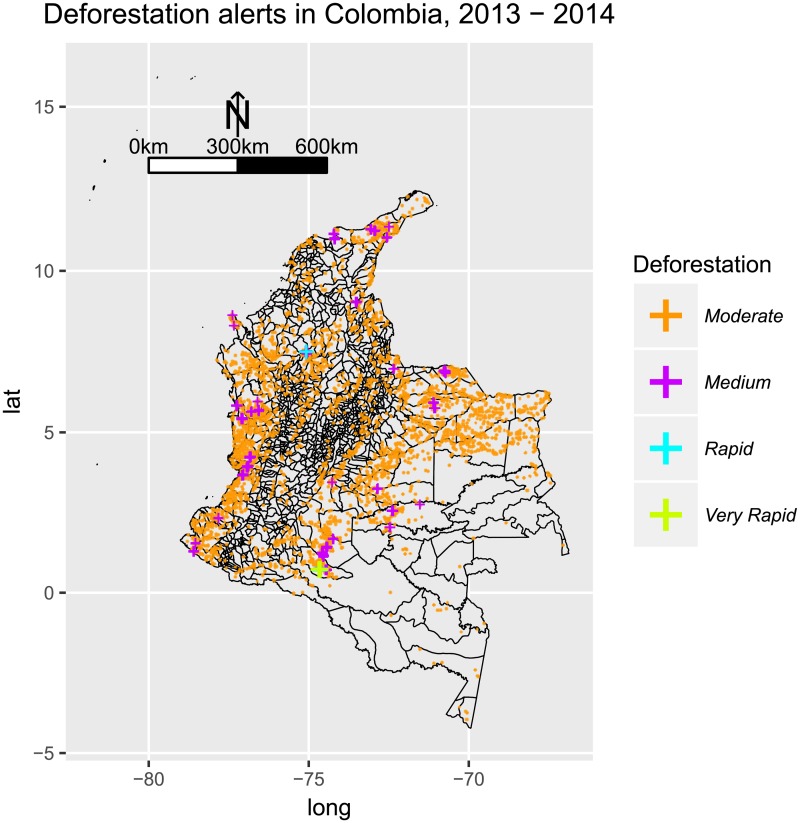
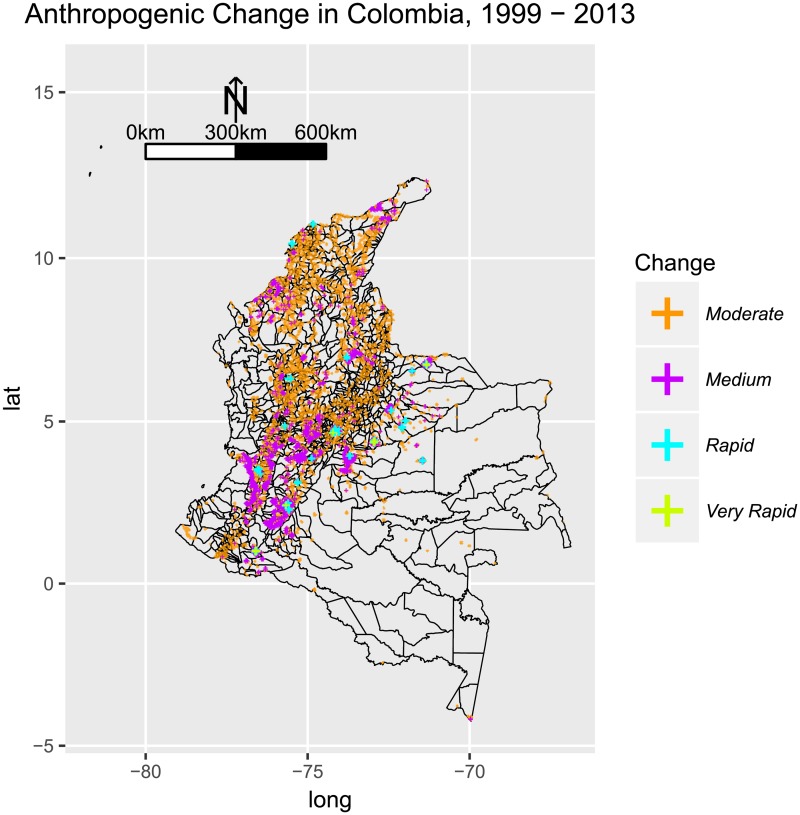
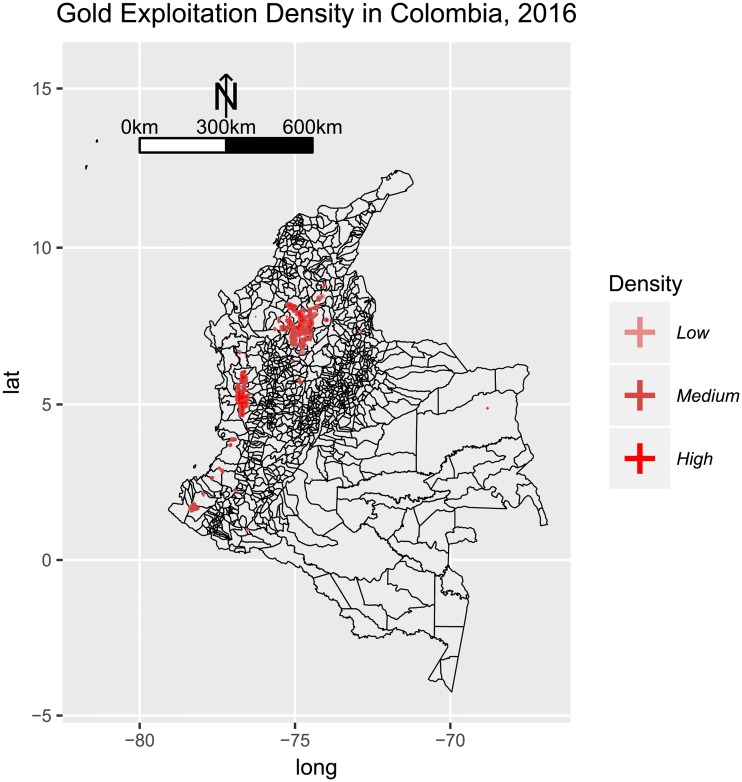
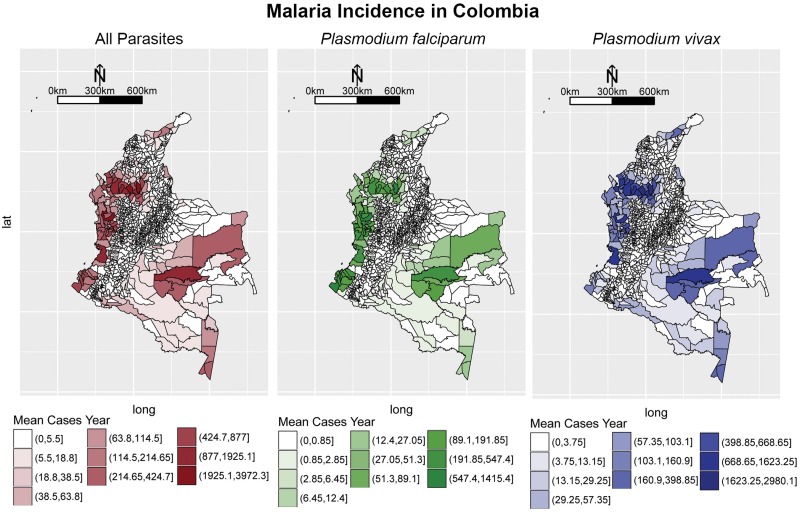
Determining the distribution of disease prevalence among heterogeneous populations at the national scale is fundamental for epidemiology and public health. Here, we use a combination of methods (spatial scan statistic, topological data analysis and epidemic profile) to study measurable differences in malaria intensity by regions and populations of Colombia. This study explores three main questions: What are the regions of Colombia where malaria is epidemic? What are the regions and populations in Colombia where malaria is endemic? What associations exist between epidemic outbreaks between regions in Colombia? Plasmodium falciparum is most prevalent in the Pacific Coast, some regions of the Amazon Basin, and some regions of the Magdalena Basin. Plasmodium vivax is the most prevalent parasite in Colombia, particularly in the Northern Amazon Basin, the Caribbean, and municipalities of Sucre, Antioquia and Cordoba. We find an acute peak of malarial infection at 25 years of age. Indigenous and Afrocolombian populations experience endemic malaria (with household transmission). We find that Plasmodium vivax decreased in the most important hotspots, often with moderate urbanization rate, and was re-introduced to locations with moderate but sustained deforestation. Infection by Plasmodium falciparum, on the other hand, steadily increased in incidence in locations where it was introduced in the 2009-2010 generalized epidemic. Our findings suggest that Colombia is entering an unstable transmission state, where rapid decreases in one location of the country are interconnected with rapid increases in other parts of the country.
Conflict of interest statement
The funder Walmartlabs provided support in the form of salaries for the author Camilo Rivera, but did not have any additional role in the study design, data collection and analysis, decision to publish, or preparation of the manuscript. This does not alter our adherence to PLOS ONE policies on sharing data and materials.
Figures
Similar articles
-
Characterization of a malaria outbreak in Colombia in 2010.Malar J. 2013 Sep 17;12:330. doi: 10.1186/1475-2875-12-330. Malar J. 2013. PMID: 24044437 Free PMC article.
-
High prevalence of sub-microscopic infections in Colombia.Malar J. 2015 May 15;14:201. doi: 10.1186/s12936-015-0711-6. Malar J. 2015. PMID: 25971594 Free PMC article.
-
Household clustering of asymptomatic malaria infections in Xepon district, Savannakhet province, Lao PDR.Malar J. 2016 Oct 18;15(1):508. doi: 10.1186/s12936-016-1552-7. Malar J. 2016. PMID: 27756391 Free PMC article.
-
Clinical profile of Plasmodium falciparum and Plasmodium vivax infections in low and unstable malaria transmission settings of Colombia.Malar J. 2015 Apr 11;14:154. doi: 10.1186/s12936-015-0678-3. Malar J. 2015. PMID: 25889074 Free PMC article.
-
A systematic review of mixed studies on malaria in Colombia 1980-2022: what the "bifocal vision" discovers.BMC Public Health. 2023 Jun 17;23(1):1169. doi: 10.1186/s12889-023-16098-5. BMC Public Health. 2023. PMID: 37330477 Free PMC article.
Cited by
-
Resolving drug selection and migration in an inbred South American Plasmodium falciparum population with identity-by-descent analysis.PLoS Pathog. 2022 Dec 21;18(12):e1010993. doi: 10.1371/journal.ppat.1010993. eCollection 2022 Dec. PLoS Pathog. 2022. PMID: 36542676 Free PMC article.
-
Frequency of gestational malaria and maternal-neonatal outcomes, in Northwestern Colombia 2009-2020.Sci Rep. 2022 Jun 29;12(1):10944. doi: 10.1038/s41598-022-15011-1. Sci Rep. 2022. PMID: 35768619 Free PMC article.
-
Malaria, relationship with climatic variables and deforestation in Colombia, Latin America and the Caribbean from 2000 to 2020: a systematic review.Malar J. 2024 Nov 18;23(1):347. doi: 10.1186/s12936-024-05140-5. Malar J. 2024. PMID: 39558332 Free PMC article.
-
Identification and Pilot Evaluation of Salivary Peptides from Anopheles albimanus as Biomarkers for Bite Exposure and Malaria Infection in Colombia.Int J Mol Sci. 2020 Jan 21;21(3):691. doi: 10.3390/ijms21030691. Int J Mol Sci. 2020. PMID: 31973044 Free PMC article.
-
Plasmodium vivax in Children: Hidden Burden and Conspicuous Challenges, a Narrative Review.Infect Dis Ther. 2023 Jan;12(1):33-51. doi: 10.1007/s40121-022-00713-w. Epub 2022 Nov 15. Infect Dis Ther. 2023. PMID: 36378465 Free PMC article. Review.
References
-
- Sáenz R, Molina JA, Quiñones ML, Brochero HL, Olano VA. Mapas preliminares de la distribución de especies de Anopheles vectores de malaria en Colombia. Biomédica. 2001;21(4):402–408.
-
- Carmona-Fonseca J. La malaria en Colombia, Antioquia y las zonas de Urabá y Bajo Cauca: panorama para interpretar la falla terapéutica antimalárica. Parte 2. Iatreia. 2004;17(1):34–53.
-
- Alexander N, Rodriguez M, Perez L, Caicedo J, Cruz C, Prieto G, et al. Case-control study of mosquito nets against malaria in the Amazon Region of Colombia. American Journal of Tropical Medicine and Hygiene. 2005;73(1):140–148. - PubMed
Publication types
MeSH terms
Associated data
LinkOut - more resources
Full Text Sources
Other Literature Sources
Medical
