

Computational prediction of changes in brain metabolic fluxes during Parkinson's disease from mRNA expression
- PMID: 30208076
- PMCID: PMC6135490
- DOI: 10.1371/journal.pone.0203687
Computational prediction of changes in brain metabolic fluxes during Parkinson's disease from mRNA expression
Abstract
Background: Parkinson's disease is a widespread neurodegenerative disorder which affects brain metabolism. Although changes in gene expression during disease are often measured, it is difficult to predict metabolic fluxes from gene expression data. Here we explore the hypothesis that changes in gene expression for enzymes tend to parallel flux changes in biochemical reaction pathways in the brain metabolic network. This hypothesis is the basis of a computational method to predict metabolic flux changes from post-mortem gene expression measurements in Parkinson's disease (PD) brain.
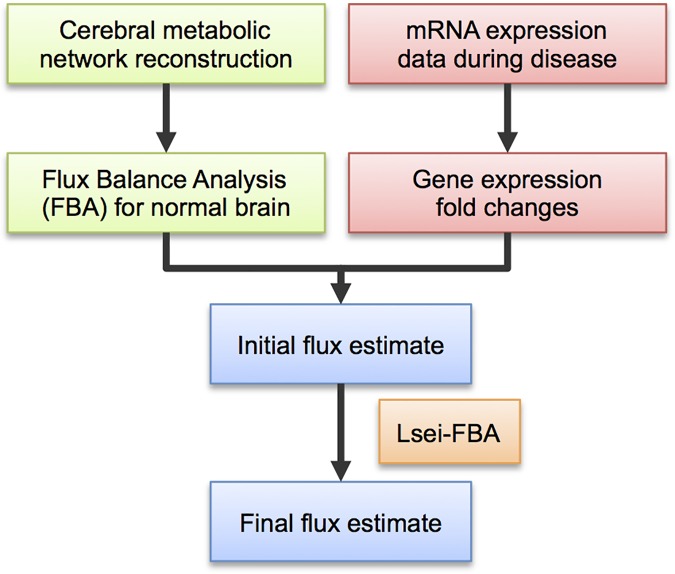
Results: We use a network model of central metabolism and optimize the correspondence between relative changes in fluxes and in gene expression. To this end we apply the Least-squares with Equalities and Inequalities algorithm integrated with Flux Balance Analysis (Lsei-FBA). We predict for PD (1) decreases in glycolytic rate and oxygen consumption and an increase in lactate production in brain cortex that correspond with measurements (2) relative flux decreases in ATP synthesis, in the malate-aspartate shuttle and midway in the TCA cycle that are substantially larger than relative changes in glucose uptake in the substantia nigra, dopaminergic neurons and most other brain regions (3) shifts in redox shuttles between cytosol and mitochondria (4) in contrast to Alzheimer's disease: little activation of the gamma-aminobutyric acid shunt pathway in compensation for decreased alpha-ketoglutarate dehydrogenase activity (5) in the globus pallidus internus, metabolic fluxes are increased, reflecting increased functional activity.
Conclusion: Our method predicts metabolic changes from gene expression data that correspond in direction and order of magnitude with presently available experimental observations during Parkinson's disease, indicating that the hypothesis may be useful for some biochemical pathways. Lsei-FBA generates predictions of flux distributions in neurons and small brain regions for which accurate metabolic flux measurements are not yet possible.
Conflict of interest statement
The authors have declared that no competing interests exist.
Figures

Similar articles
-
Using bioconductor package BiGGR for metabolic flux estimation based on gene expression changes in brain.PLoS One. 2015 Mar 25;10(3):e0119016. doi: 10.1371/journal.pone.0119016. eCollection 2015. PLoS One. 2015. PMID: 25806817 Free PMC article.
-
Estimating Metabolic Fluxes Using a Maximum Network Flexibility Paradigm.PLoS One. 2015 Oct 12;10(10):e0139665. doi: 10.1371/journal.pone.0139665. eCollection 2015. PLoS One. 2015. PMID: 26457579 Free PMC article.
-
Prediction of metabolic flux distribution from gene expression data based on the flux minimization principle.PLoS One. 2014 Nov 14;9(11):e112524. doi: 10.1371/journal.pone.0112524. eCollection 2014. PLoS One. 2014. PMID: 25397773 Free PMC article.
-
Ubiquinone (coenzyme q10) and mitochondria in oxidative stress of parkinson's disease.Biol Signals Recept. 2001 May-Aug;10(3-4):224-53. doi: 10.1159/000046889. Biol Signals Recept. 2001. PMID: 11351130 Review.
-
Metabolic flux prediction in cancer cells with altered substrate uptake.Biochem Soc Trans. 2015 Dec;43(6):1177-81. doi: 10.1042/BST20150149. Biochem Soc Trans. 2015. PMID: 26614657 Review.
Cited by
-
Isotope-Assisted Metabolic Flux Analysis: A Powerful Technique to Gain New Insights into the Human Metabolome in Health and Disease.Metabolites. 2022 Nov 4;12(11):1066. doi: 10.3390/metabo12111066. Metabolites. 2022. PMID: 36355149 Free PMC article. Review.
-
Peripheral Glycolysis in Neurodegenerative Diseases.Int J Mol Sci. 2020 Nov 24;21(23):8924. doi: 10.3390/ijms21238924. Int J Mol Sci. 2020. PMID: 33255513 Free PMC article. Review.
-
Metabolomics in Parkinson's Disease and Correlation with Disease State.Metabolites. 2025 Mar 18;15(3):208. doi: 10.3390/metabo15030208. Metabolites. 2025. PMID: 40137172 Free PMC article. Review.
-
Modeling the metabolic interplay between a parasitic worm and its bacterial endosymbiont allows the identification of novel drug targets.Elife. 2020 Aug 11;9:e51850. doi: 10.7554/eLife.51850. Elife. 2020. PMID: 32779567 Free PMC article.
-
Personalized Genome-Scale Metabolic Models Identify Targets of Redox Metabolism in Radiation-Resistant Tumors.Cell Syst. 2021 Jan 20;12(1):68-81.e11. doi: 10.1016/j.cels.2020.12.001. Cell Syst. 2021. PMID: 33476554 Free PMC article.
References
Publication types
MeSH terms
Substances
LinkOut - more resources
Full Text Sources
Other Literature Sources
Medical
