

The effect of exposure to high altitude and low oxygen on intestinal microbial communities in mice
- PMID: 30208088
- PMCID: PMC6135514
- DOI: 10.1371/journal.pone.0203701
The effect of exposure to high altitude and low oxygen on intestinal microbial communities in mice
Abstract
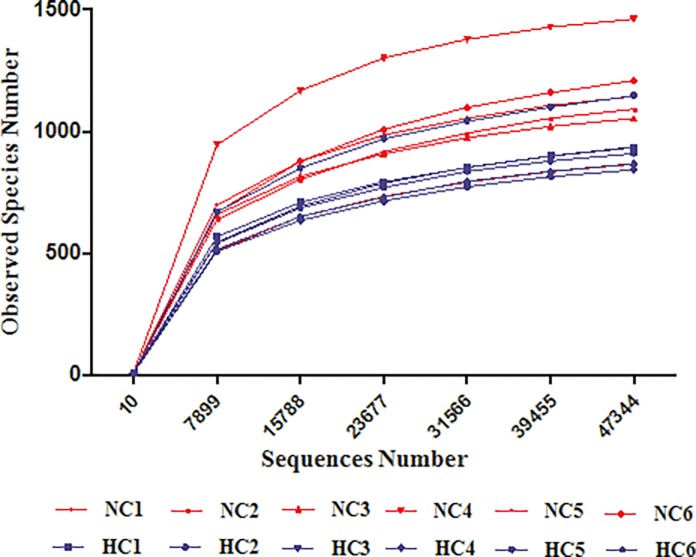
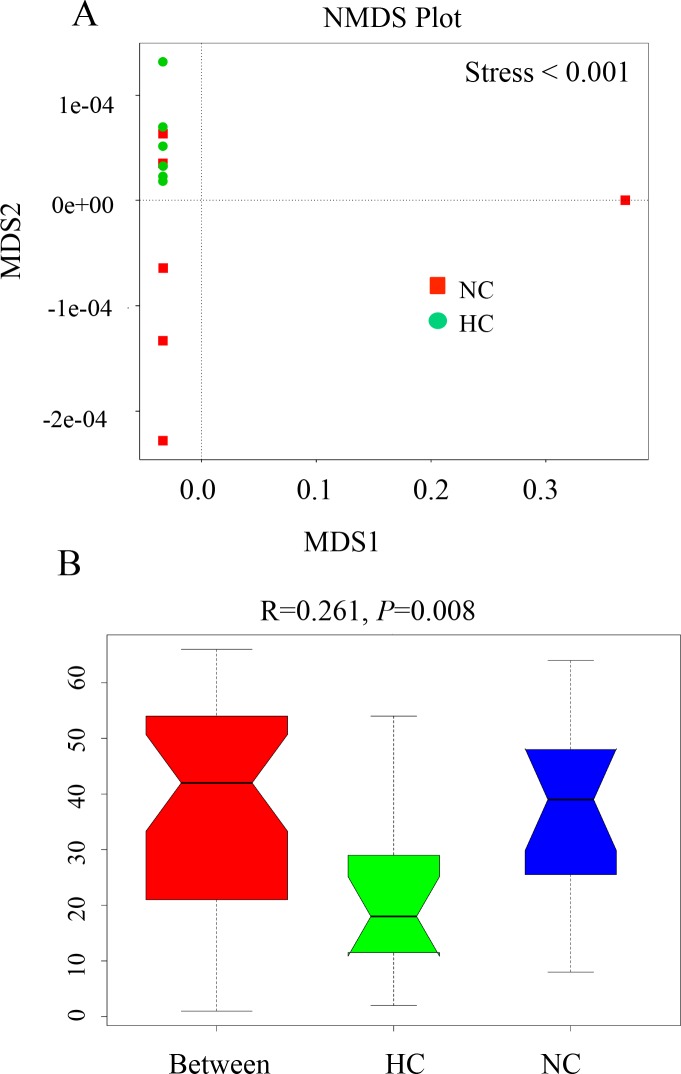
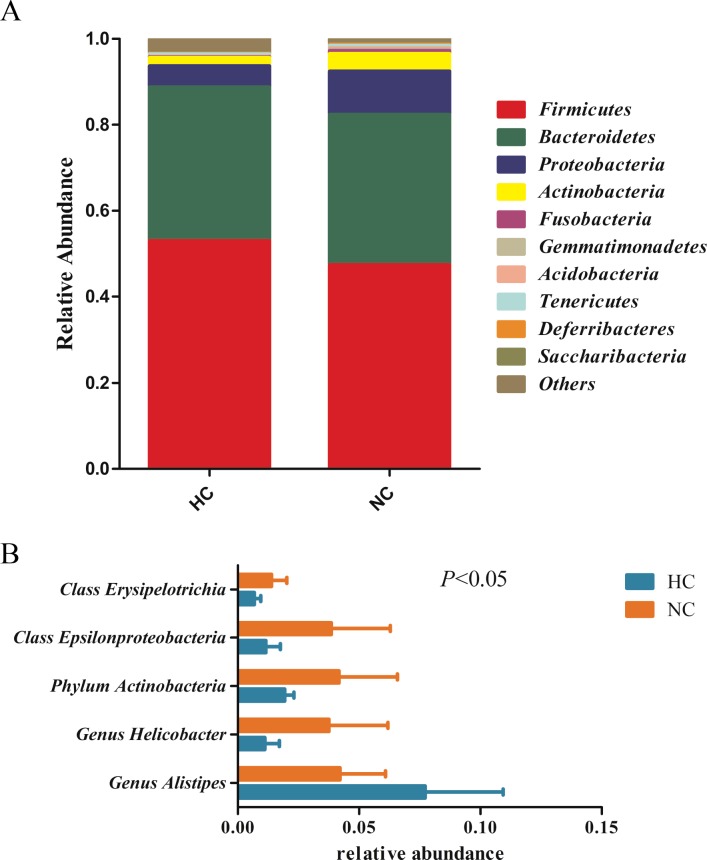
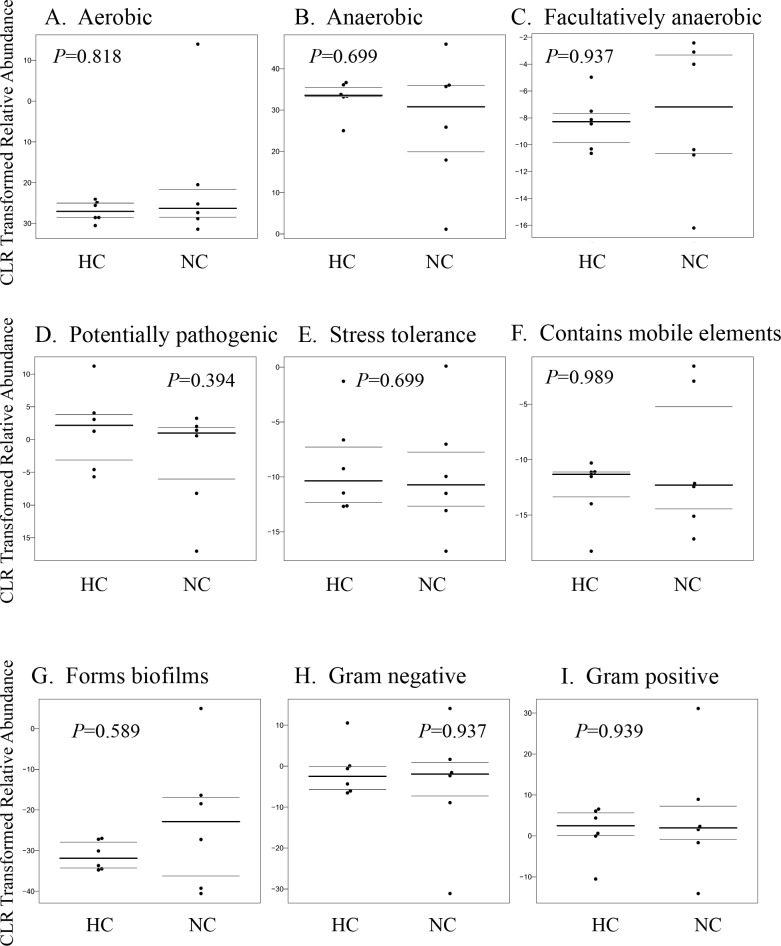
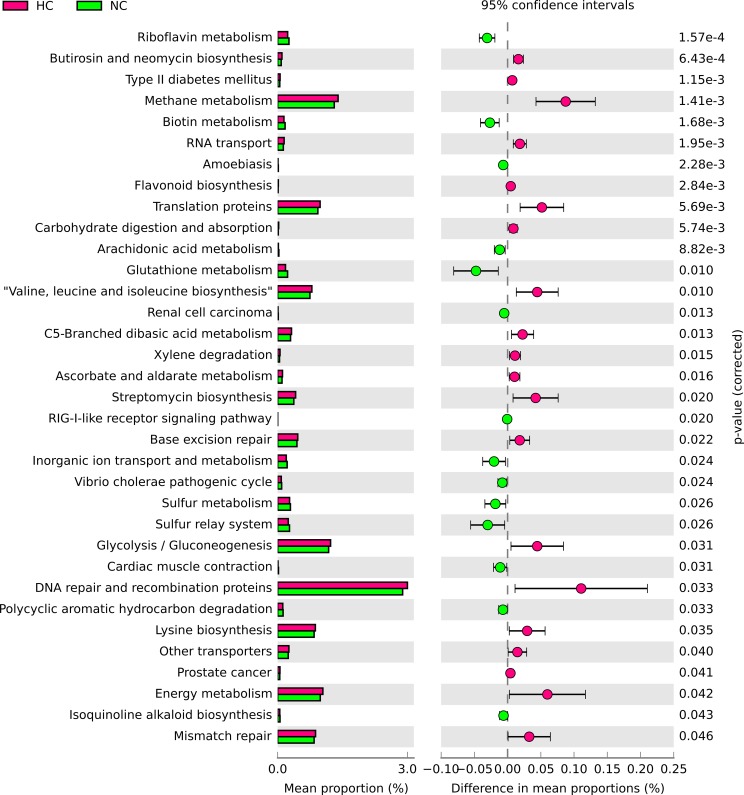
This experiment was conducted to investigate the effect of exposure to high altitude and low oxygen on intestinal microbial communities using mice as an animal model. Fecal microbiota from mice housed in a control environment representing 2,200 meters (NC group) above sea level with 16% Oxygen and mice that were placed in a hypobaric chamber representing 5000 meters (HC group) above sea level with 11% Oxygen for 30 days, were analyzed by the HiSeq Illumina sequencing platform. The results showed a significant difference in beta diversity observed between the two groups, while no significant difference was observed in alpha diversity. Compared with the NC group, the relative abundance of class Epsilonproteobacteria, phlym Actinobacteria, class Erysipelotrichia and genus Helicobacter were significantly lower (P<0.05), while the relative abundance of genus Alistipes was increased in the HC group; Phenotypic analysis showed no significant difference in aerobic, anaerobic, facultatively anaerobic, potentially pathogenic, stress tolerant, mobile element, biofilms formation, gram negative and gram positive between HC group and NC group; Functional analysis results showed significant differences in 34 gene functional metabolic pathways (carbohydrate digestion and absorption, energy metabolism, arachidonic acid metabolism, flavonoid biosynthesis, RIG-I-like receptor signaling pathway, etc) between HC group and NC group. Together, these findings suggest that exposure to high altitude and low oxygen had the potential to change the intestinal microbial communities, which potentially may modulate metabolic processes in mice.
Conflict of interest statement
The authors have declared that no competing interests exist.
Figures
Similar articles
-
Acute exposure to simulated high-altitude hypoxia alters gut microbiota in mice.Arch Microbiol. 2022 Jun 22;204(7):412. doi: 10.1007/s00203-022-03031-4. Arch Microbiol. 2022. PMID: 35731330
-
Changes in the Gut Microbiota of Rats in High-Altitude Hypoxic Environments.Microbiol Spectr. 2022 Dec 21;10(6):e0162622. doi: 10.1128/spectrum.01626-22. Epub 2022 Oct 27. Microbiol Spectr. 2022. PMID: 36301100 Free PMC article.
-
Exposure to high altitude leads to disturbances in host metabolic homeostasis: study of the effects of hypoxia-reoxygenation and the associations between the microbiome and metabolome.mSystems. 2025 May 20;10(5):e0134724. doi: 10.1128/msystems.01347-24. Epub 2025 Apr 16. mSystems. 2025. PMID: 40237534 Free PMC article.
-
Impact of Environmental Microbes on the Composition of the Gut Microbiota of Adult BALB/c Mice.PLoS One. 2016 Aug 12;11(8):e0160568. doi: 10.1371/journal.pone.0160568. eCollection 2016. PLoS One. 2016. PMID: 27518814 Free PMC article.
-
Evaluating the association between body weight and the intestinal microbiota of weaned piglets via 16S rRNA sequencing.Appl Microbiol Biotechnol. 2017 Jul;101(14):5903-5911. doi: 10.1007/s00253-017-8304-7. Epub 2017 May 18. Appl Microbiol Biotechnol. 2017. PMID: 28523395
Cited by
-
The gut bacterial microbiome of Nile tilapia (Oreochromis niloticus) from lakes across an altitudinal gradient.BMC Microbiol. 2022 Apr 4;22(1):87. doi: 10.1186/s12866-022-02496-z. BMC Microbiol. 2022. PMID: 35379180 Free PMC article.
-
Altitude shapes gut microbiome composition accounting for diet, thyroid hormone levels, and host genetics in a subterranean blind mole rat.Front Microbiol. 2024 Nov 1;15:1476845. doi: 10.3389/fmicb.2024.1476845. eCollection 2024. Front Microbiol. 2024. PMID: 39552645 Free PMC article.
-
Gut Microbiome Alterations and Hepatic Metabolic Flexibility in the Gansu Zokor, Eospalax cansus: Adaptation to Hypoxic Niches.Front Cardiovasc Med. 2022 Mar 23;9:814076. doi: 10.3389/fcvm.2022.814076. eCollection 2022. Front Cardiovasc Med. 2022. PMID: 35402538 Free PMC article.
-
Proteomic and Morphological Profiling of Mice Ocular Tissue During High-altitude Acclimatization Process: An Animal Study at Lhasa.J Inflamm Res. 2022 May 4;15:2835-2853. doi: 10.2147/JIR.S361174. eCollection 2022. J Inflamm Res. 2022. PMID: 35645575 Free PMC article.
-
Human gut microbiota adaptation to high-altitude exposure: longitudinal analysis over acute and prolonged periods.Microbiol Spectr. 2025 Jun 3;13(6):e0291624. doi: 10.1128/spectrum.02916-24. Epub 2025 Apr 21. Microbiol Spectr. 2025. PMID: 40257273 Free PMC article.
References
Publication types
MeSH terms
Substances
Grants and funding
LinkOut - more resources
Full Text Sources
Other Literature Sources
