

Cardio-respiratory autonomic responses to nociceptive stimuli in patients with disorders of consciousness
- PMID: 30208114
- PMCID: PMC6135369
- DOI: 10.1371/journal.pone.0201921
Cardio-respiratory autonomic responses to nociceptive stimuli in patients with disorders of consciousness
Abstract
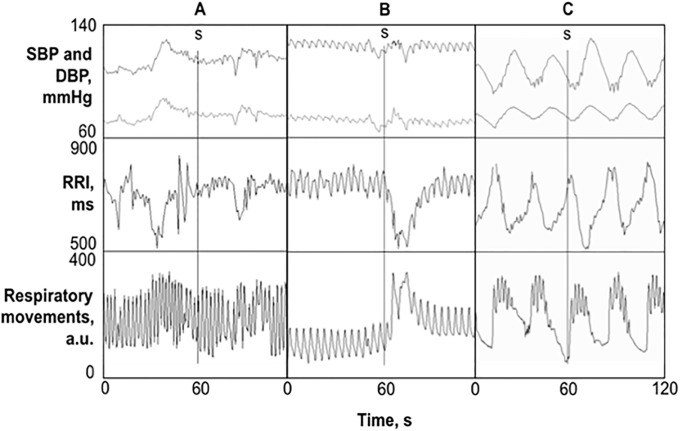
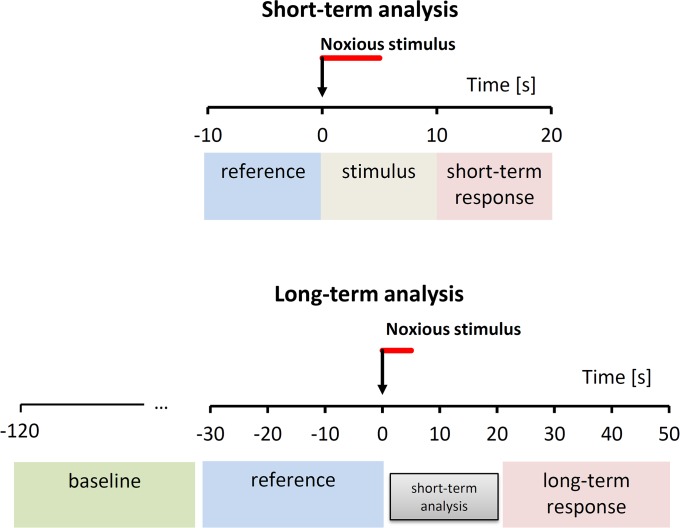
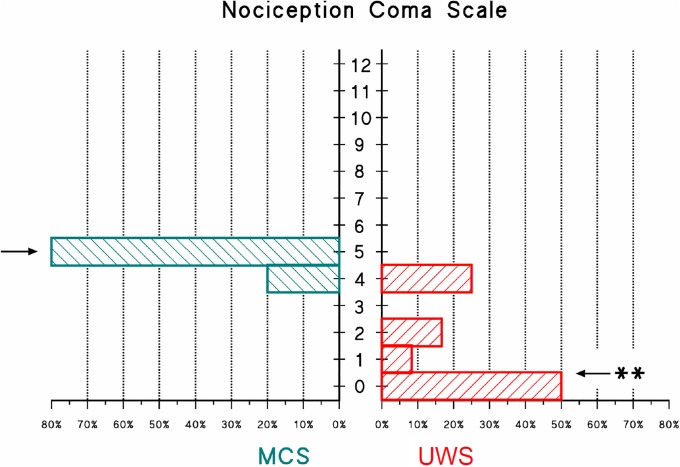
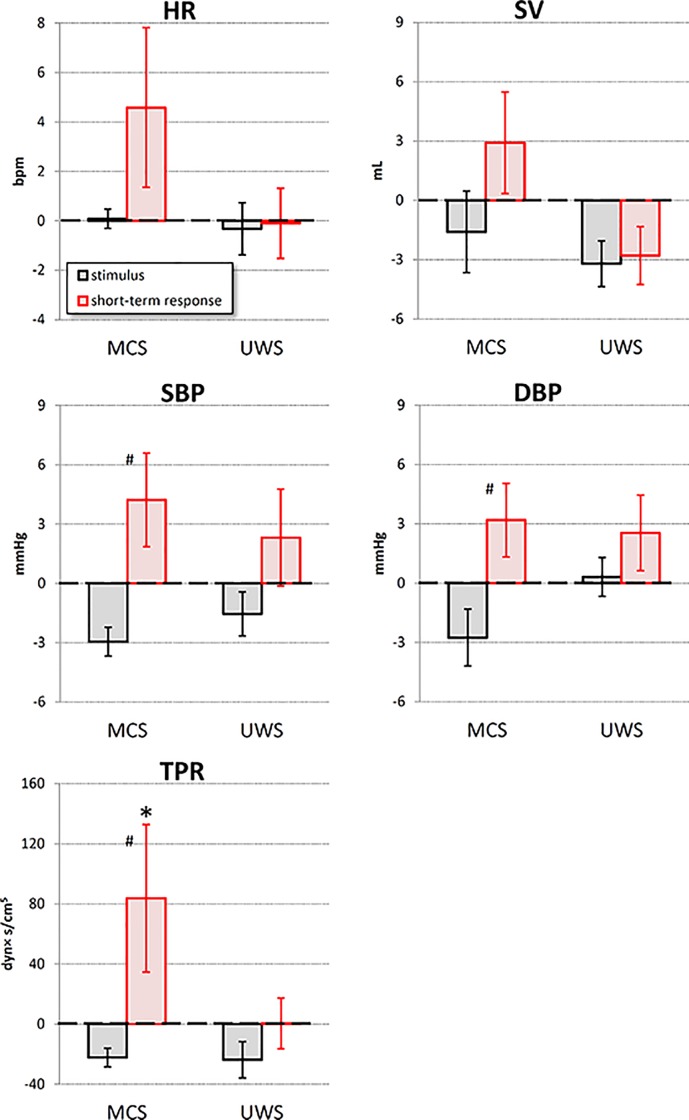
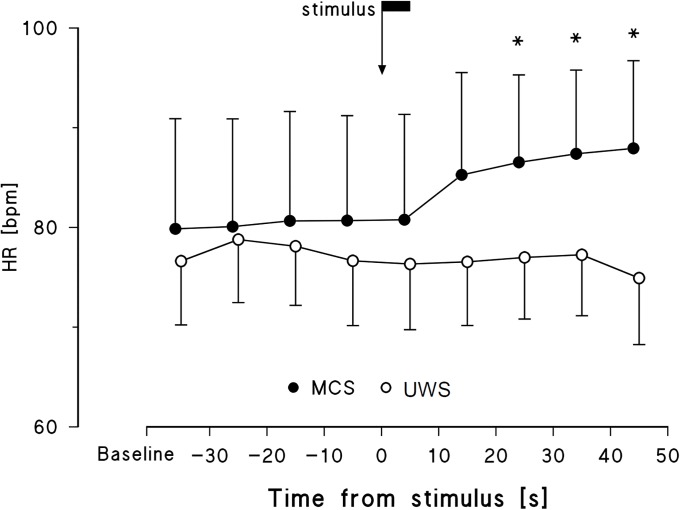
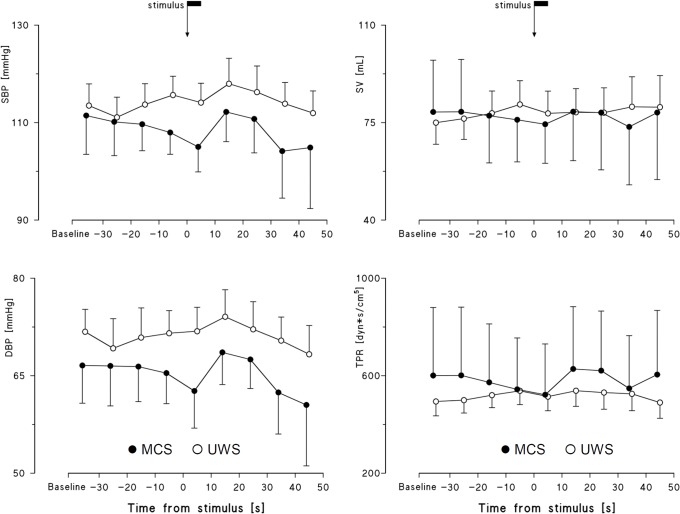
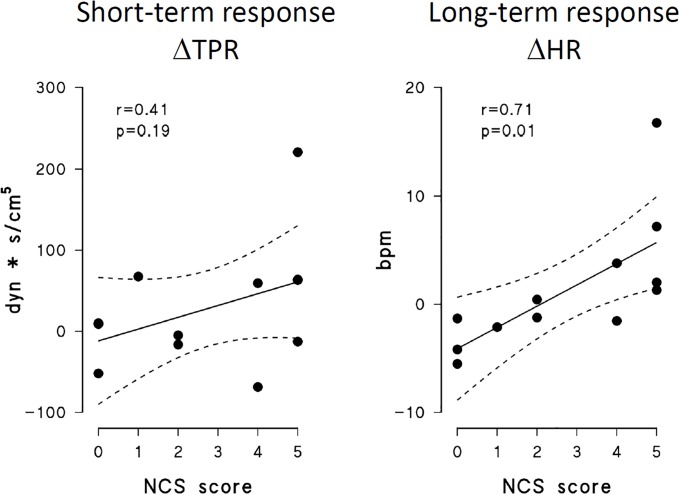
The autonomic response to pain might discriminate among consciousness disorders. Therefore, aim of this study was to describe differences between minimally conscious state (MCS) and unresponsive wakefulness syndrome (UWS) patients in their autonomic response to a nociceptive stimulus. ECG, respiration, finger blood pressure (BP) and total peripheral resistances (TPR) were continuously recorded before, during and after a standardized noxious stimulus in 20 adult brain-injured patients, 14 in UWS and 6 in MCS. Occurrence of fast autonomic responses synchronous with the stimulus was detected by visual inspection of the tracings; short-term (<20 s) and long-term (between 20s and 50 s from the stimulus) responses were evaluated by beat-by-beat quantitative analysis. The noxious stimulus elicited fast responses in both groups, but only MCS patients showed a significant short-term response in TPR and long-term response in HR. Thus, short- and long-term cardiovascular responses to pain might integrate neuro-behavioural assessments to discriminate between MCS and UWS.
Conflict of interest statement
The authors have declared that no competing interests exist.
Figures
Similar articles
-
Heart Rate Variability as an Indicator of Nociceptive Pain in Disorders of Consciousness?J Pain Symptom Manage. 2019 Jan;57(1):47-56. doi: 10.1016/j.jpainsymman.2018.09.016. Epub 2018 Sep 27. J Pain Symptom Manage. 2019. PMID: 30267843
-
Cardiac autonomic responses to nociceptive stimuli in patients with chronic disorders of consciousness.Clin Neurophysiol. 2018 May;129(5):1083-1089. doi: 10.1016/j.clinph.2018.01.068. Epub 2018 Feb 14. Clin Neurophysiol. 2018. PMID: 29486984
-
Could autonomic system assessment be helpful in disorders of consciousness diagnosis? A neurophysiological study.Exp Brain Res. 2016 Aug;234(8):2189-99. doi: 10.1007/s00221-016-4622-8. Epub 2016 Mar 25. Exp Brain Res. 2016. PMID: 27016088
-
Pain issues in disorders of consciousness.Brain Inj. 2014;28(9):1202-8. doi: 10.3109/02699052.2014.920518. Brain Inj. 2014. PMID: 25099024 Review.
-
What about pain in disorders of consciousness?AAPS J. 2012 Sep;14(3):437-44. doi: 10.1208/s12248-012-9346-5. Epub 2012 Apr 18. AAPS J. 2012. PMID: 22528502 Free PMC article. Review.
Cited by
-
Pain Perception in Disorder of Consciousness: A Scoping Review on Current Knowledge, Clinical Applications, and Future Perspective.Brain Sci. 2021 May 20;11(5):665. doi: 10.3390/brainsci11050665. Brain Sci. 2021. PMID: 34065349 Free PMC article.
-
Survival, but not the severity of hypoxic-ischemic encephalopathy, is associated with higher mean arterial blood pressure after cardiac arrest: a retrospective cohort study.Front Cardiovasc Med. 2024 May 7;11:1337344. doi: 10.3389/fcvm.2024.1337344. eCollection 2024. Front Cardiovasc Med. 2024. PMID: 38774664 Free PMC article.
-
Measuring pain and nociception: Through the glasses of a computational scientist. Transdisciplinary overview of methods.Front Netw Physiol. 2023 Feb 10;3:1099282. doi: 10.3389/fnetp.2023.1099282. eCollection 2023. Front Netw Physiol. 2023. PMID: 36926544 Free PMC article. Review.
-
Validation and Reliability of a Novel Vagus Nerve Neurodynamic Test and Its Effects on Heart Rate in Healthy Subjects: Little Differences Between Sexes.Front Neurosci. 2021 Sep 6;15:698470. doi: 10.3389/fnins.2021.698470. eCollection 2021. Front Neurosci. 2021. PMID: 34552462 Free PMC article.
-
Assessment and management of pain/nociception in patients with disorders of consciousness or locked-in syndrome: A narrative review.Front Syst Neurosci. 2023 Mar 20;17:1112206. doi: 10.3389/fnsys.2023.1112206. eCollection 2023. Front Syst Neurosci. 2023. PMID: 37021037 Free PMC article. Review.
References
-
- Andrews K. Medical decision making in the vegetative state: withdrawal of nutrition and hydration. NeuroRehabilitation. 2004;19(4):299–304. - PubMed
MeSH terms
LinkOut - more resources
Full Text Sources
Other Literature Sources
Molecular Biology Databases
