. 2018 Sep 11;24(11):2957-2971.e6.
doi: 10.1016/j.celrep.2018.08.032.

GPS2 Deficiency Triggers Maladaptive White Adipose Tissue Expansion in Obesity via HIF1A Activation

Affiliations

GPS2 Deficiency Triggers Maladaptive White Adipose Tissue Expansion in Obesity via HIF1A Activation

Karima Drareni et al. Cell Rep. .

Abstract

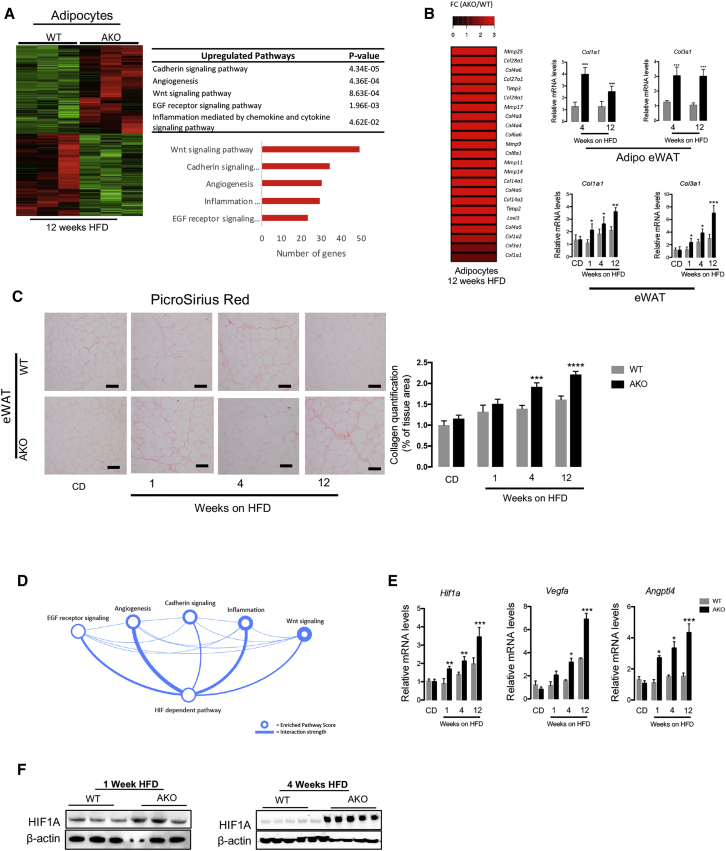
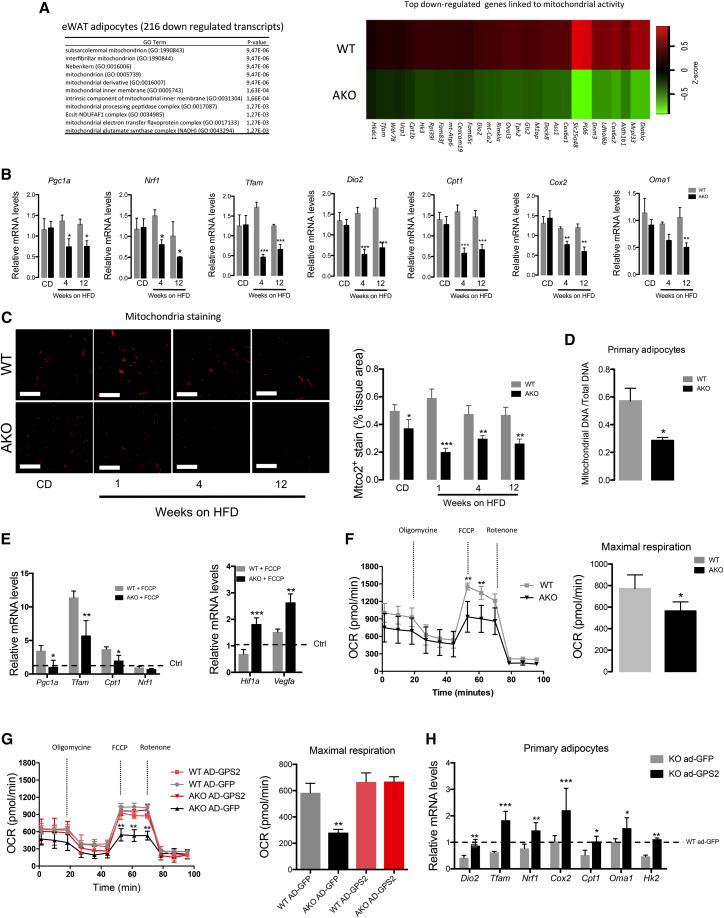
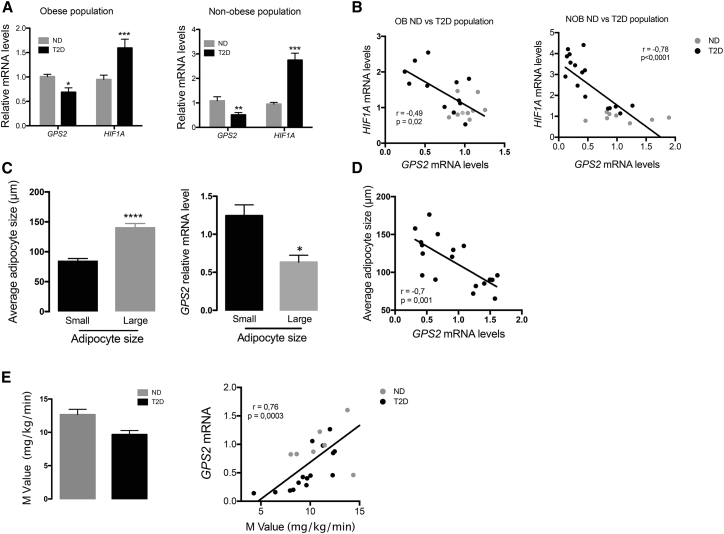
Hypertrophic white adipose tissue (WAT) represents a maladaptive mechanism linked to the risk for developing type 2 diabetes in humans. However, the molecular events that predispose WAT to hypertrophy are poorly defined. Here, we demonstrate that adipocyte hypertrophy is triggered by loss of the corepressor GPS2 during obesity. Adipocyte-specific GPS2 deficiency in mice (GPS2 AKO) causes adipocyte hypertrophy, inflammation, and mitochondrial dysfunction during surplus energy. This phenotype is driven by HIF1A activation that orchestrates inadequate WAT remodeling and disrupts mitochondrial activity, which can be reversed by pharmacological or genetic HIF1A inhibition. Correlation analysis of gene expression in human adipose tissue reveals a negative relationship between GPS2 and HIF1A, adipocyte hypertrophy, and insulin resistance. We propose therefore that the obesity-associated loss of GPS2 in adipocytes predisposes for a maladaptive WAT expansion and a pro-diabetic status in mice and humans.

Keywords: GPS2; HIF1A; adipose tissue; corepressor; insulin resistance; obesity; transcription; type 2 diabetes.


Figures

None
Graphical abstract
Figure 1
Figure 1
The Loss of GPS2 in Adipocytes Predisposes to Aberrant WAT Remodeling and Glucose Intolerance (A) Body weight curve during a time course of 12 weeks of CD and 1, 4, and 12 weeks of HFD of WT and GPS2 AKO mice (CD, n = 8; 1 week HFD, n = 7; 4 weeks HFD, n = 12; 12 weeks HFD, n = 13). (B) Oral glucose tolerance test (OGTT) in WT and GPS2 AKO mice in normal CD and after 4 and 12 weeks of HFD (CD, n = 8; 4 weeks HFD, n = 12; 12 weeks HFD, n = 13). (C) Representative H&E and perilipin immunofluorescence staining and average of the adipocyte size of eWAT from WT and GPS2 AKO mice upon normal CD and after 1, 4, and 12 weeks of HFD (CD, n = 8; 1 week HFD, n = 7; 4 weeks HFD, n = 12; 12 weeks HFD, n = 13). Scale bars, 100 μm. (D) Basal or insulin-stimulated phospho-AKT western blotting in eWAT of WT and GPS2 AKO mice after 1 and 4 weeks of HFD (n = 3). (E) Measurement of basal or insulin-stimulated glucose uptake (using 2-deoxyglucose) on eWAT explants from WT and GPS2 AKO mice after 4 weeks of HFD (n = 3). (F) Basal or isoproterenol-stimulated phospho-HSL, HSL, and ATGL western blotting on explants of eWAT of WT and GPS2 AKO mice after 4 weeks of HFD (n = 3). (G) Basal or isoproterenol-stimulated concentration of glycerol and NEFA in the eWAT explant media from WT and GPS2 AKO mice after 4 weeks of HFD (n = 3). (H) RT-qPCR analysis of Atgl in eWAT and serum concentration of NEFA from WT and GPS2 AKO mice under normal CD and after 1, 4, and 12 weeks of HFD (CD, n = 8; 1 week HFD, n = 7; 4 weeks HFD, n = 12; 12 weeks HFD, n = 13). All data are represented as mean ± SEM. p < 0.05, ∗∗p < 0.01, ∗∗∗p < 0.001. See also Figures S1 and S2.
Figure 2
Figure 2
HIF1A Signaling Is Enhanced in GPS2-Deficient Adipocytes during HFD Feeding (A) Heatmap representing global gene expression in eWAT adipocytes of WT and GPS2 AKO mice after 12 weeks of HFD (n = 3). Gene enrichment analyses of the top-upregulated pathways enriched in the datasets. (B) Heatmap representing the “remodeling” genes upregulated in eWAT adipocytes of the GPS2 AKO compared with WT mice after 12 weeks of HFD (n = 3). RT-qPCR analysis of Col1a1 and Col3a1 in isolated adipocytes and eWAT from WT and GPS2 AKO mice after 4 and 12 weeks of HFD (4 weeks HFD, n = 12; 12 weeks HFD, n = 13). (C) Representative picrosirius red staining images and collagen quantification in eWAT from WT and GPS2 AKO mice upon normal CD and after 1, 4, and 12 weeks of HFD (CD, n = 8; 1 week HFD, n = 7; 4 weeks HFD, n = 12; 12 weeks HFD, n = 13). Scale bars, 100 μm. (D) Network analyses of biological processes deregulated in eWAT adipocytes of GPS2 AKO mice after 12 weeks of HFD. (E) RT-qPCR analysis of Hif1a, Vegfa, and Angptl4 genes in eWAT of WT and GPS2 AKO mice under normal CD and after 1, 4, and 12 weeks of HFD (CD, n = 8; 1 week HFD, n = 7; 4 weeks HFD, n = 12; 12 weeks HFD, n = 13). (F) HIF1A western blotting in isolated eWAT adipocytes of WT and GPS2 AKO mice after 1 and 4 weeks of HFD (n = 3 and n = 5, respectively). All data are represented as mean ± SEM. p < 0.05, ∗∗p < 0.01, ∗∗∗p < 0.001. See also Figure S3.
Figure 3
Figure 3
GPS2 Directly Controls the Transcriptional Activity of HIF1A (A) Genome browser tracks of GPS2 peak distribution at Hif1a, Vegfa, and Angptl4 promoters in 3T3-L1 cells (from public database; Cardamone et al., 2014). (B) ChIP-qPCR analysis of GPS2 recruitment onto Hif1a and Vegfa loci in mature 3T3L1. IgG was used as control. (C) H3K4me3 measurement by ChIP-qPCR onto Hif1a loci in mature 3T3L1 shGfp (as control) and shGps2. IgG was used as control. (D) GPS2 binding motif analysis at promoters of GPS2-targeted genes in 3T3-L1 cells. (E) Repression assays in differentiated 3T3-L1 cells. HIF1A response element from Vegfa promoter upstream a gene encoding for luciferase was transfected into 3T3-L1 cells with HIF1A or GPS2. (F) Co-immunoprecipitation of HA-GPS2 with Flag-HIF1A in HEK293 cells. Flag-SMRT (aa 2–297), Flag-NCOR (aa 2–320), and HA-GPS2 were used as positive controls. Co-immunoprecipitation of HA-GPS2 with endogenous HIF1A in 3T3-L1 cells. (G) RT-qPCR analysis of Hif1a, Vegfa, Hk2, Angptl4, Col1a1, and Col3a1 genes in primary adipocytes from ingWAT of WT and GPS2 AKO mice under normoxic or 6 hr hypoxic conditions (n = 4). (H) RT-qPCR analysis of Hif1a, Vegfa, Hk2, Angptl4, Col1a1, and Col3a1 genes in primary adipocytes from ingWAT of WT and GPS2 AKO mice overexpressing adenovirus encoding GFP (as control) or GPS2 upon normoxic or 6 hr hypoxic conditions (n = 4). (I) RT-qPCR analysis of Hif1a, Vegfa, Agptl4, Col1a1, and Col3a1 target genes in differentiated 3T3-L1 cells overexpressing adenovirus encoding GFP (as control) or GPS2 upon normoxic or 6 hr hypoxic conditions (n = 6). All data are represented as mean ± SEM. p < 0.05, ∗∗p < 0.01, ∗∗∗p < 0.001. See also Figure S4.
Figure 4
Figure 4
The Loss of GPS2 in Adipocytes Disrupts Mitochondrial Activity (A) Cellular component analysis of 216 downregulated genes and heatmap representing the top downregulated genes linked to mitochondrial activity in eWAT adipocytes from WT and GPS2 AKO mice after 12 weeks of HFD (n = 3). (B) RT-qPCR analysis of mitochondrial genes involved in biogenesis and function in eWAT of WT and GPS2 AKO under normal CD and 4 and 12 weeks of HFD (CD, n = 8; 4 weeks HFD, n = 12; 12 weeks HFD, n = 13). (C) Representative images of mitochondrial (MTCO2) immunofluorescence staining and quantification in eWAT from WT and GPS2 AKO mice in normal chow diet (CD) and after 1, 4, and 12 weeks of HFD (CD, n = 8; 1 week HFD, n = 7; 4 weeks HFD, n = 12; 12 weeks HFD, n = 3). Scale bars, 100 μm. (D) Quantification of mtDNA of primary-differentiated adipocytes from ingWAT of WT and GPS2 AKO mice (n = 4) (E) RT-qPCR analysis of Hif1a, Vegfa, and mitochondrial genes Pgc1a, Tfam, Cpt1, and Nrf1 in differentiated 3T3-L1 cells upon FCCP treatment for 12 hr (n = 6). (F) Oxygen consumption rate (OCR) of primary-differentiated adipocytes from ingWAT of WT and GPS2 AKO mice (n = 4). (G) OCR of primary-differentiated adipocytes from ingWAT of WT and GPS2 AKO mice (n = 4) overexpressing adenovirus encoding GFP (as control) or GPS2 (n = 5). (H) RT-qPCR analysis of mitochondrial genes involved in biogenesis and function in primary-differentiated adipocytes from ingWAT of WT and GPS2 AKO mice (n = 4) overexpressing adenovirus encoding GFP (as control) or GPS2 (n = 5). All data are represented as mean ± SEM. p < 0.05, ∗∗p < 0.01, ∗∗∗p < 0.001. See also Figure S5.
Figure 5
Figure 5
Disrupted Mitochondrial Activity in GPS2 AKO Mice Limits Adipose Tissue Remodeling upon β3-Adrenegic Receptor Agonist and Cold Exposure (A) Representative images of mitochondrial (MTCO2), UCP1 immunofluorescence staining, and H&E staining of ingWAT from WT and GPS2 AKO control vehicle-treated mice (n = 8), after β3-adrenegic receptor agonist treatment (n = 8) and upon cold exposure during 5 days (n = 12). Scale bars, 100 μm. (B) Heatmap representing global gene expression pattern analyses of the most dysregulated pathways and heatmap representing the top downregulated in ingWAT of WT and GPS2 AKO mice treated with β3-adrenegic receptor agonist treatment (n = 3). (C) RT-qPCR analysis of mitochondrial genes involved in biogenesis and function in ingWAT of WT and GPS2 AKO control vehicle-treated mice, after β3-adrenegic receptor agonist treatment (n = 4) or cold exposure (n = 6). (D) HIF1A western blotting (n = 3) and mRNA levels in ingWAT WT and GPS2 AKO mice after β3-adrenegic receptor agonist treatment (n = 4) or cold exposure (n = 6). (E) Body temperature of WT and AKO mice after 5 days of cold exposure and measurement of Vo2 consumption during cold exposure (n = 6). All data are represented as mean ± SEM. p < 0.05, ∗∗p < 0.01, ∗∗∗p < 0.001. See also Figure S6.
Figure 6
Figure 6
Pharmacologic Inhibition of HIF1A Reverses the GPS2 AKO Phenotype (A) Oral glucose tolerance test (OGTT) of HFD-fed WT and GPS2 AKO mice after control vehicle (n = 4) or PX-478 (n = 7) treatment for 10 days. Percentage of area under the curve (AUC) of the OGTT after versus before PX-478 treatment (n = 7). (B) Representative images of H&E staining and average of adipocyte size of eWAT from HFD-fed WT and GPS2 AKO mice after control vehicle (n = 4) or PX-478 (n = 7) treatment for 10 days. Scale bars, 100 μm. (C) RT-qPCR analysis of Hifa, Vegfa, and Angptl4 genes in eWAT of HFD-fed WT and GPS2 AKO mice after control vehicle (n = 4) or PX-478 (n = 7) treatment for 10 days. (D) Representative images of mitochondrial (MTCO2) immunofluorescence staining and quantification in eWAT from WT and GPS2 AKO mice after control vehicle (n = 4) or PX-478 (n = 7) treatment for 10 days (n = 7). Scale bars, 100 μm. (E) RT-qPCR analysis of mitochondrial genes involved in biogenesis and function in eWAT of HFD-fed WT and GPS2 AKO mice after control vehicle (n = 4) or PX-478 (n = 7) treatment for 10 days. (F) Representative images of mitochondrial (MTCO2), UCP1 immunofluorescence staining, and H&E staining of ingWAT from WT and GPS2 AKO mice after PX-478 treatment for 10 days overlapping with 5 days β3-adrenegic receptor agonist treatment (n = 6). Scale bars, 100 μm. (G) RT-qPCR analysis of mitochondrial genes involved in biogenesis and function in eWAT of HFD-fed WT and GPS2 AKO mice after 10 days of PX-478 treatment overlapping with 5 days β3-adrenegic receptor agonist treatment (n = 6). Scale bars, 100 μm. (H) Oxygen consumption rate (OCR) of primary adipocytes from ingWAT of WT and GPS2 AKO mice in presence or absence of 10 μM PX-478 for 16 hr (n = 4) and OCR of primary adipocytes from ingWAT of WT and GPS2 AKO mice treated with siRNA control or siRNA targeting Hif1a for 24 hr (n = 6). All data are represented as mean ± SEM. p < 0.05, ∗∗p < 0.01, ∗∗∗p < 0.001. See also Figures S7 and S8.
Figure 7
Figure 7
GPS2 mRNA Levels in Human Adipose Tissue Are Negatively Correlated to Adipocyte Size, HIF1A mRNA Levels, and Systemic Insulin Resistance (A) mRNA expression levels of GPS2 and HIF1A in SAT or VAT of non-obese (n = 18) and obese (n = 21) subjects with or without diagnosed T2D. (B) Correlative analysis of the expression of GPS2 versus HIF1A (B) in SAT and VAT from non-obese (NOB) (n = 18) and obese (OB) (n = 21) populations. (C) Average adipocytes size from obese subject classified into small (n = 9) and large (n = 9) and GPS2 expression into these two classes of subjects. (D) Correlative analysis of GPS2 expression with adipocyte size from obese subjects (population 2) and mRNA expression of GPS2 in large versus small adipocytes (n = 9). (E) Measurement of the M value by hyperinsulinemic-euglycemic clamp in non-obese subjects with our without diagnosed T2D (ND, n = 8; T2D, n = 10). Correlative analysis of the expression of GPS2 versus M value in non-obese subjects with our without diagnosed T2D. All data are represented as mean ± SEM. p < 0.05, ∗∗p < 0.01, ∗∗∗p < 0.001. See also Table S1.

References

    1. Acosta J.R., Douagi I., Andersson D.P., Bäckdahl J., Rydén M., Arner P., Laurencikiene J. Increased fat cell size: a major phenotype of subcutaneous white adipose tissue in non-obese individuals with type 2 diabetes. Diabetologia. 2016;59:560–570. - PubMed
    1. Anders S., Huber W. Differential expression analysis for sequence count data. Genome Biol. 2010;11:R106. - PMC - PubMed
    1. Anders S., Pyl P.T., Huber W. HTSeq—a Python framework to work with high-throughput sequencing data. Bioinformatics. 2015;31:166–169. - PMC - PubMed
    1. Andersen E., Ingerslev L.R., Fabre O., Donkin I., Altıntaş A., Versteyhe S., Bisgaard T., Kristiansen V.B., Simar D., Barrès R. Preadipocytes from obese humans with type 2 diabetes are epigenetically reprogrammed at genes controlling adipose tissue function. Int. J. Obes. 2018 Published online February 20, 2018. - PubMed
    1. Andersson D.P., Eriksson Hogling D., Thorell A., Toft E., Qvisth V., Näslund E., Thörne A., Wirén M., Löfgren P., Hoffstedt J. Changes in subcutaneous fat cell volume and insulin sensitivity after weight loss. Diabetes Care. 2014;37:1831–1836. - PubMed

Publication types

MeSH terms