. 2019 Mar;15(3):407-422.
doi: 10.1080/15548627.2018.1520547. Epub 2018 Sep 22.

Autophagy regulates glucose-mediated root meristem activity by modulating ROS production in Arabidopsis

Affiliations

Autophagy regulates glucose-mediated root meristem activity by modulating ROS production in Arabidopsis

Li Huang et al. Autophagy. 2019 Mar.

Abstract

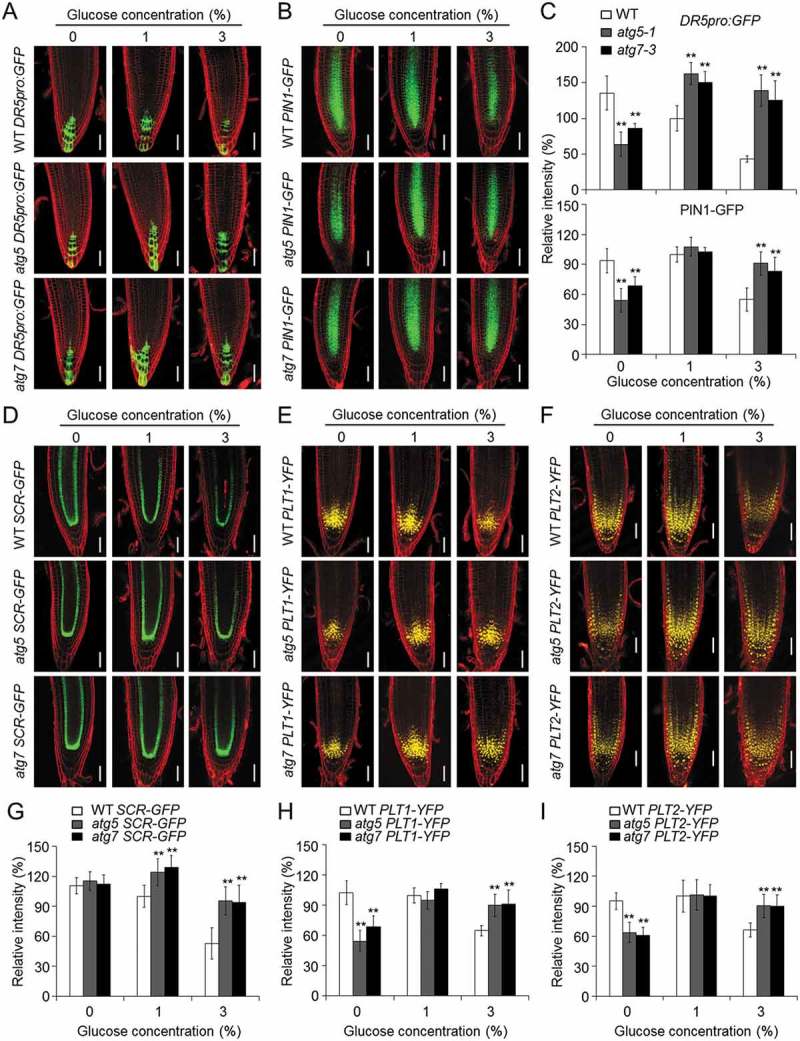
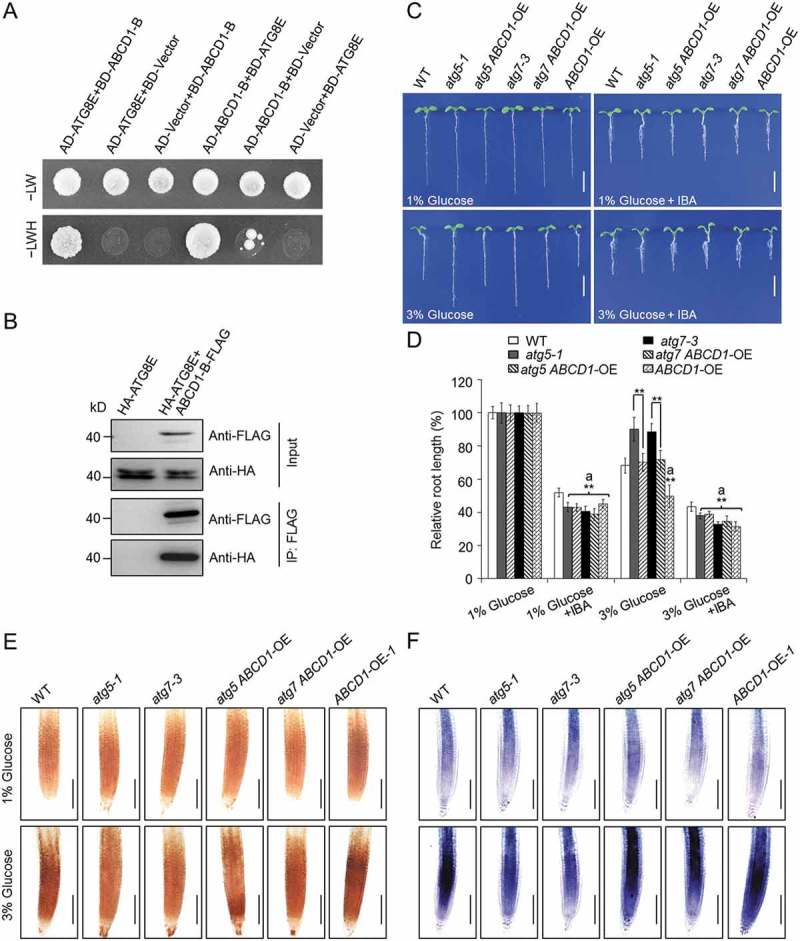
Glucose produced from photosynthesis is a key nutrient signal regulating root meristem activity in plants; however, the underlying mechanisms remain poorly understood. Here, we show that, by modulating reactive oxygen species (ROS) levels, the conserved macroautophagy/autophagy degradation pathway contributes to glucose-regulated root meristem maintenance. In Arabidopsis thaliana roots, a short exposure to elevated glucose temporarily suppresses constitutive autophagosome formation. The autophagy-defective autophagy-related gene (atg) mutants have enhanced tolerance to glucose, established downstream of the glucose sensors, and accumulate less glucose-induced ROS in the root tips. Moreover, the enhanced root meristem activities in the atg mutants are associated with improved auxin gradients and auxin responses. By acting with AT4G39850/ABCD1 (ATP-binding cassette D1; Formerly PXA1/peroxisomal ABC transporter 1), autophagy plays an indispensable role in the glucose-promoted degradation of root peroxisomes, and the atg mutant phenotype is partially rescued by the overexpression of ABCD1. Together, our findings suggest that autophagy is an essential mechanism for glucose-mediated maintenance of the root meristem. Abbreviation: ABA: abscisic acid; ABCD1: ATP-binding cassette D1; ABO: ABA overly sensitive; AsA: ascorbic acid; ATG: autophagy related; CFP: cyan fluorescent protein; Co-IP: co-immunoprecipitation; DAB: 3',3'-diaininobenzidine; DCFH-DA: 2',7'-dichlorodihydrofluorescin diacetate; DR5: a synthetic auxin response element consists of tandem direct repeats of 11 bp that included the auxin-responsive TGTCTC element; DZ: differentiation zone; EZ, elongation zone; GFP, green fluorescent protein; GSH, glutathione; GUS: β-glucuronidase; HXK1: hexokinase 1; H2O2: hydrogen peroxide; IAA: indole-3-acetic acid; IBA: indole-3-butyric acid; KIN10/11: SNF1 kinase homolog 10/11; MDC: monodansylcadaverine; MS: Murashige and Skoog; MZ: meristem zone; NBT: nitroblue tetrazolium; NPA: 1-N-naphtylphthalamic acid; OxIAA: 2-oxindole-3-acetic acid; PIN: PIN-FORMED; PLT: PLETHORA; QC: quiescent center; RGS1: Regulator of G-protein signaling 1; ROS: reactive oxygen species; SCR: SCARECROW; SHR, SHORT-ROOT; SKL: Ser-Lys-Leu; SnRK1: SNF1-related kinase 1; TOR: target of rapamycin; UPB1: UPBEAT1; WOX5: WUSCHEL related homeobox 5; Y2H: yeast two-hybrid; YFP: yellow fluorescent protein.

Keywords: Autophagy; glucose; peroxisome; reactive oxygen species; root meristem.


Figures

Figure 1.
Figure 1.
Exogenous glucose affects constitutive autophagy in Arabidopsis roots. (a) Confocal microscopy showing the autophagosomes in the meristem zone (MZ), elongation zone (EZ), and differentiation zone (DZ) of GFP-ATG8E [48,49] roots under different glucose conditions. Five-day-old GFP-ATG8E seedlings grown on 1/2 MS agar medium containing 1% sucrose were transferred to 1/2 MS medium containing 0, 1, or 3% (w:v) glucose for 24 or 48 h. Bars: 50 μm. (b) Number of puncta per section in the MZ, EZ, and DZ cells in (a). The experiments with the same experimental design were repeated 3 times (biological repeats) with similar results. Values are means ± SD (n = 8 roots) calculated from one experiment. Asterisks indicate significant differences from the GFP-ATG8E seedlings grown on 1% glucose (*P < 0.05 and **P < 0.01, Student t test). ‘a’ and ‘b’ indicate values that are significantly higher or lower than the control, respectively. (c) Immunoblot analysis showing the processing of the GFP-ATG8E protein in GFP-ATG8E roots upon treatment with various concentrations (0, 1, 3, or 5%) of glucose. One-week-old GFP-ATG8E seedlings grown on normal 1/2 MS medium were transferred to 1/2 MS medium containing glucose for 24 h or 48 h. Anti-GFP antibodies were used for the protein blotting analysis. The GFP-ATG8E (GFP8E) fusion and free GFP levels are indicated on the right. The numbers on the left indicate the molecular mass (kD) of the size markers. The Coomassie Brilliant Blue-stained total proteins (CBB) are shown as the loading control.
Figure 2.
Figure 2.
Autophagy-defective mutants show enhanced root meristem activity in response to high glucose treatment. (a) One-week-old wild-type (WT), atg2-1, atg5-1, and atg7-3 seedlings grown on 1/2 MS medium with 0, 1, or 3% (w:v) glucose. Bars: 5 mm. (b) Relative root lengths of WT, atg2-1, atg5-1, and atg7-3 seedlings grown on 1/2 MS medium with 0, 1, 2, 3, 4, 5, or 6% (w:v) glucose for 7 d. Root lengths are expressed relative those of the WT on 1% glucose. (c) Time course (3, 5, 7, and 9 d) of WT, atg2-1, atg5-1, and atg7-3 seedlings grown on 1/2 MS medium with 3% (w:v) glucose. Root lengths are expressed relative to the corresponding WT seedlings on 1/2 MS medium with 1% glucose. (d) Root meristem zones in the WT and the atg mutants following a 7-d 0, 1, or 3% glucose treatment. Arrow pairs indicate the meristematic zone. Bars: 50 μm. (e) The cell lengths and cell numbers of the root meristem zones in (d). The seeds of WT, atg2-1, atg5-1, and atg7-3 were sown on 1/2 MS medium with 0, 1, or 3% (w:v) glucose. The root lengths and cell numbers were recorded at 7 days after germination. Three independent experiments were carried out with similar results, and representative data from one experiment are shown. For each experiment, 15 roots from 3 different plates were measured. Values are means ± SD (n = 15). Asterisks indicate significant differences from the WT (*P < 0.05 and **P < 0.01, Student t test). ‘a’ and ‘b’ indicate values that are significantly higher or lower, respectively, in the mutants than the WT.
Figure 3.
Figure 3.
The autophagy-mediated glucose response acts downstream of HXK1. (a) The autophagy defects in the atg mutants rescued the hypersensitivity of the HXK1-OE line to elevated glucose. Bars: 5 mm. (b) Relative root lengths of WT (Col-0 and Be), atg5-1, atg5 HXK1-OE, atg7-3, atg7 HXK1-OE, and HXK1-OE seedlings in (a). Root lengths are expressed relative to each genotype on 1% glucose. (c) Lengths of the root meristems (indicated by pairs of arrow) of WT (Col-0 and Be), atg5-1, atg5 HXK1-OE, atg7-3, atg7 HXK1-OE, and HXK1-OE seedlings grown for 7 d on 1/2 MS medium with 1% or 3% (w:v) glucose. Bars: 50 μm. (d) Relative number of cells in the root meristem zones in (c). Seeds of the WT (Col-0 and Be), atg5-1, atg5 HXK1-OE, atg7-3, atg7 HXK1-OE, and HXK1-OE plants were germinated on 1/2 MS agar medium with 1% or 3% (w:v) glucose. The seedlings were photographed 7 d after germination. The experiments with the same experimental design were repeated 3 times (biological repeats) with similar results. Values are means ± SD (n = 15) calculated from one experiment. Asterisks with an ‘a’ indicate significant differences from that of WT (Col-0 and Be), and those with a ‘b’ indicate significant differences from that of HXK1-OE (**P < 0.01, Student t test).
Figure 4.
Figure 4.
Inhibition of root elongation by high glucose levels involves ROS. (a–c) DAB staining for H2O2 (a), NBT staining for superoxide (b), and DCFH-DA staining for H2O2 (c) in the primary root tips of the wild type (WT) and the atg5-1 and atg7-3 mutants upon treatment with 1% or 3% glucose for 6 h. Bars: 100 μm. (d–f) Relative fluorescence intensities calculated from (a–c). (g) Recovery of high-glucose-induced root inhibition in the WT by the addition of GSH. Seeds of WT, atg2-1, atg5-1, and atg7-3 were germinated on 1/2 MS medium with 1% or 3% (w:v) glucose, with or without 500 μM GSH, for 7 d. Bars: 5 mm. (h) Relative root lengths of WT, atg2-1, atg5-1, and atg7-3 in (g). Root lengths are expressed relative to that of the WT on the 1/2 MS medium containing 1% glucose. For the staining assays, 5-day-old WT, atg5-1 and atg7-3 seedlings grown on 1/2 MS agar medium containing 1% sucrose were transferred to 1/2 MS medium with 1% or 3% glucose for 6 h. For the root elongation assays, seeds of WT, atg5-1 and atg7-3 were germinated on 1/2 MS medium containing 1% or 3% glucose with or without 500 μM GSH. The root lengths were measured at 7 days after germination. The experiments were repeated 3 times with similar results. Values are means ± SD (n = 15 seedlings) from one experiment. The asterisks with “a” indicate significant higher in the WT seedlings treated with 3% glucose than those in WT under 1% glucose. The asterisks with “b” indicate significantly lower values in the atg mutants than that of WT under 3% glucose treatment (**P < 0.01, Student t test). Asterisks in (h) indicate significant differences between the WT and the atg mutants, with and without GSH (**P < 0.01, Student t test).
Figure 5.
Figure 5.
Disruption of autophagy attenuates the glucose-suppressed expression of DR5, PIN1, SCR, PLT1, and PLT2. (a,b) The expression levels of DR5pro:GFP (a) and PIN1-GFP (b) in the wild-type (WT), atg5-1, and atg7-3 backgrounds (WT DR5pro:GFP, atg5 DR5pro:GFP, atg7 DR5pro:GFP, WT PIN1-GFP, atg5 PIN1-GFP, and atg7 PIN1-GFP) at 7 d after germination on 1/2 MS medium with 0, 1, or 3% (w:v) glucose. Bars: 50 μm. (C) The relative fluorescence intensities of DR5pro:GFP and PIN1-GFP in (a) and (b), respectively. Three independent experiments were performed with similar results. Values are means ± SD (n = 15) from one representative experiment. Asterisks indicate significant differences from WT (*P < 0.05 and **P < 0.01, Student t test). (d–f) The expression levels of SCR-GFP (d), PLT1-YFP (e), and PLT2-YFP (f) in the wild-type (WT), atg5-1, and atg7-3 backgrounds (WT SCR-GFP, atg5 SCR-GFP, atg7 SCR-GFP, WT PLT1-YFP, atg5 PLT1-YFP, atg7 PLT1-YFP, WT PLT2-YFP, atg5 PLT2-YFP, and atg7 PLT2-YFP) 7 d after germination on 1/2 MS medium with 0, 1, or 3% (w:v) glucose. Bars: 50 μm. (g–i) The relative fluorescence intensities of SCR-GFP (g), PLT1-YFP (h), and PLT2-YFP (i) in the WT, atg5-1, and atg7-3 backgrounds (WT pSCR-GFP, atg5 pSCR-GFP, atg7 pSCR-GFP, WT PLT1-YFP, atg5 PLT1-YFP, atg7 PLT1-YFP, WT PLT2-YFP, atg5 PLT2-YFP, and atg7 PLT2-YFP) following a 7-d treatment of 0, 1, or 3% glucose. The fluorescence intensities are expressed relative to that of the 1% glucose-treated WT SCR-GFP, WT PLT1-YFP, and WT PLT2-YFP seedlings, respectively. The seeds of all genotypes were germinated on 1/2 MS medium containing 0, 1 or 3% glucose and the root fluorescence was measured at 7 days after germination. Three independent experiments were conducted with similar results. Values are means ± SD (n = 10) calculated from one experiment. Asterisks indicate significant differences from each WT control (*P < 0.05 and **P < 0.01, Student t test).
Figure 6.
Figure 6.
Autophagy is required for glucose-promoted degradation of peroxisomes in Arabidopsis roots. (a,b) Confocal microscopy images showing eCFP-SKL-labelled peroxisomes in the shoot (a) and root (b) cells of wild-type (WT, WT eCFP-SKL), atg5-1 (atg5 eCFP-SKL), and atg7-3 (atg7 eCFP-SKL) plants. Bars: 50 μm. (c) Numbers of peroxisomes quantified from confocal images of WT eCFP-SKL, atg5 eCFP-SKL, and atg7 eCFP-SKL shoot (upper panel) and root (lower panel) cells. Five-day-old seedlings grown on 1/2 MS agar medium containing 1% sucrose were treated with 1% or 3% (w:v) glucose for 24 h. Areas of the same size were randomly selected from confocal images and CFP-SKL-labelled puncta were quantified using ImageJ. Three independent experiments were performed with similar results. Values are representative means ± SD (n = 15 roots) from one experiment. Asterisks with an ‘a’ indicate significantly fewer puncta than those of the WT in the 1% glucose condition, while those with a ‘b’ indicate significantly more puncta in the atg mutants than in the WT (**P < 0.01, Student t test). (d,e) Immunoblot analysis showing the level of eCFP-SKL in the shoots (d) and roots (e) of WT eCFP-SKL, atg5 eCFP-SKL, and atg7 eCFP-SKL seedlings following a 24-h treatment with 0, 1, 3, or 5% glucose. One-week-old seedlings expressing the eCFP-SKL transgene germinated on 1/2 MS medium were transferred to 1/2 MS medium containing the various glucose concentrations for 24 h. Anti-GFP antibodies were used for the protein blotting analysis. The numbers on the left indicate the molecular mass (kD) of the size markers. A Coomassie Brilliant Blue-stained gel (CBB) is shown as the loading control.
Figure 7.
Figure 7.
ABCD1 is involved in autophagy-mediated glucose response. (a) Yeast two-hybrid assay showing the interaction between ATG8E and the Walker B motif of the second nucleotide-binding domain (NBD) of the ABCD1 protein. The yeast strains were selected on SD/-Trp-Leu-His-Ade medium (–LWH) that are dependent on two-hybrid protein interactions. (b) In vivo CoIP analysis showing the physical interaction between ATG8E and the Walker B motif of the second NBD of the ABCD1 protein. HA-tagged ATG8E (HA-ATG8E) was coexpressed with ABCD1-B-FLAG in Arabidopsis protoplasts and immunoprecipitated by FLAG affinity magnetic beads. (c,d) Phenotypes (c) and relative root lengths (d) of WT, atg5-1, atg5 ABCD1-OE, atg7-3, atg7 ABCD1-OE, and ABCD1-OE lines germinated for 7 d on 1/2 MS medium containing 1% or 3% (w:v) glucose, with or without 10 μM IBA. Bars: 5 mm. Root lengths are expressed relative to those of the genotypes on the 1/2 MS medium containing 1% glucose. The seeds of all genotypes were germinated on 1/2 MS medium containing 1% or 3% glucose with or without 10 μM IBA and the root lengths were measured at 7 days after germination. The experiments were repeated 3 times with similar results. Values are means ± SD (n = 15 seedlings) from one experiment. Asterisks with an ‘a’ indicate values significantly lower than that of WT (**P < 0.01, Student t test). (e,f) DAB staining for H2O2 (e) and NBT staining for superoxide (f) in the primary root tips of the wild-type (WT), atg5-1, atg7-3, atg5 ABCD1-OE, atg7 ABCD1-OE, and ABCD1-OE seedlings following a 6-h treatment with 1% or 3% glucose. Bars: 100 μm. The 5-d-old seedlings of all genotypes grown on 1/2 MS agar medium containing 1% sucrose were transferred to 1/2 MS medium with 1% or 3% glucose for 6 h.
Figure 8.
Figure 8.
Proposed model for the role of autophagy in regulating the glucose-mediated suppression of root meristem activity. Glucose is sensed by HXK1, which suppresses the autophagy machinery through an unknown mechanism. In response to glucose signaling, autophagy modulates the homeostasis of cellular ROS and promotes the degradation of the oxidatively damaged peroxisome. In roots, the peroxisome mediates the biosynthesis of auxin and determines the meristem activity in the root tips; therefore, its degradation leads to reduced root growth.

Similar articles

Cited by

References

    1. Sheen J, Zhou L, Jang J.. Sugars as signaling molecules. Curr Opin Plant Biol. 1999;2(5):410–418. - PubMed
    1. Leon P. Sugar and hormone connections. Trends Plant Sci. 2003;8(3):110–116. - PubMed
    1. Gibson SI, Sugar and phytohormone response pathways: navigating a signalling network. J Exp Bot. 2004;55(395):253–264. - PubMed
    1. Sheen J. Master regulators in plant glucose signaling networks. J Plant Biol. 2014;57(2):67–79. - PMC - PubMed
    1. Jang JC, León P, Zhou L, et al. Hexokinase as a sugar sensor in higher plants. Plant Cell. 1997;9(1):5–19. - PMC - PubMed

Publication types

MeSH terms

Substances