. 2018 Sep 12;11(1):52.
doi: 10.1186/s13072-018-0222-0.

Cycles of gene expression and genome response during mammalian tissue regeneration

Collaborators, Affiliations

Cycles of gene expression and genome response during mammalian tissue regeneration

Leonor Rib et al. Epigenetics Chromatin. .

Abstract

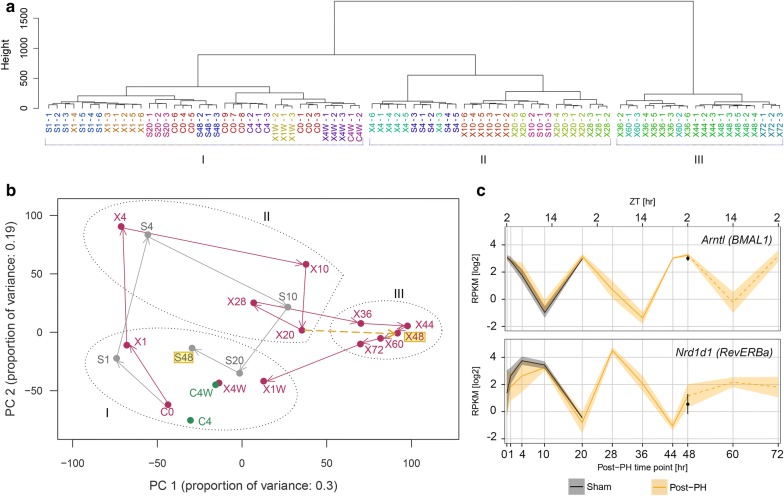
Background: Compensatory liver hyperplasia-or regeneration-induced by two-thirds partial hepatectomy (PH) permits the study of synchronized activation of mammalian gene expression, particularly in relation to cell proliferation. Here, we measured genomic transcriptional responses and mRNA accumulation changes after PH and sham surgeries.

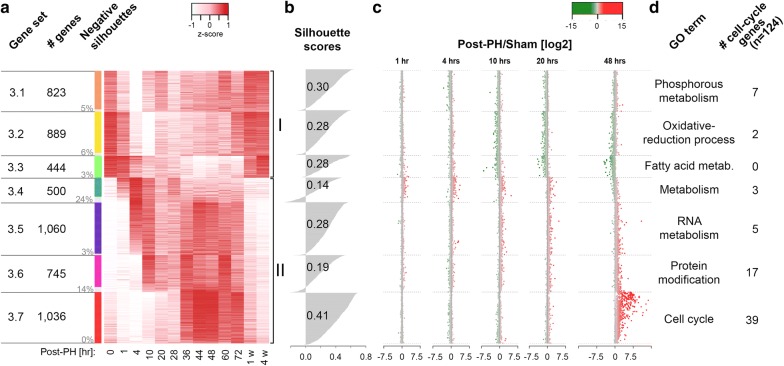
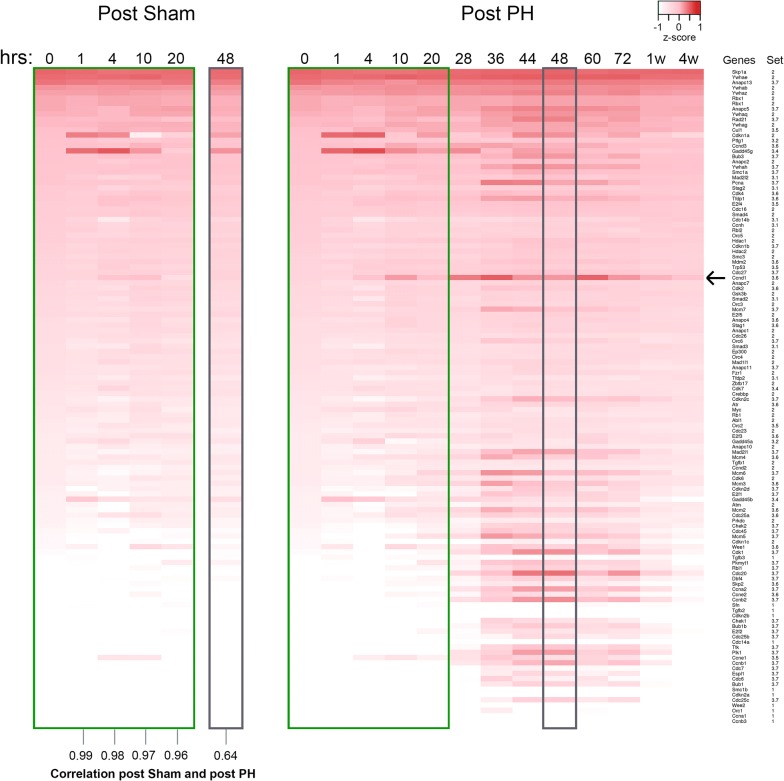
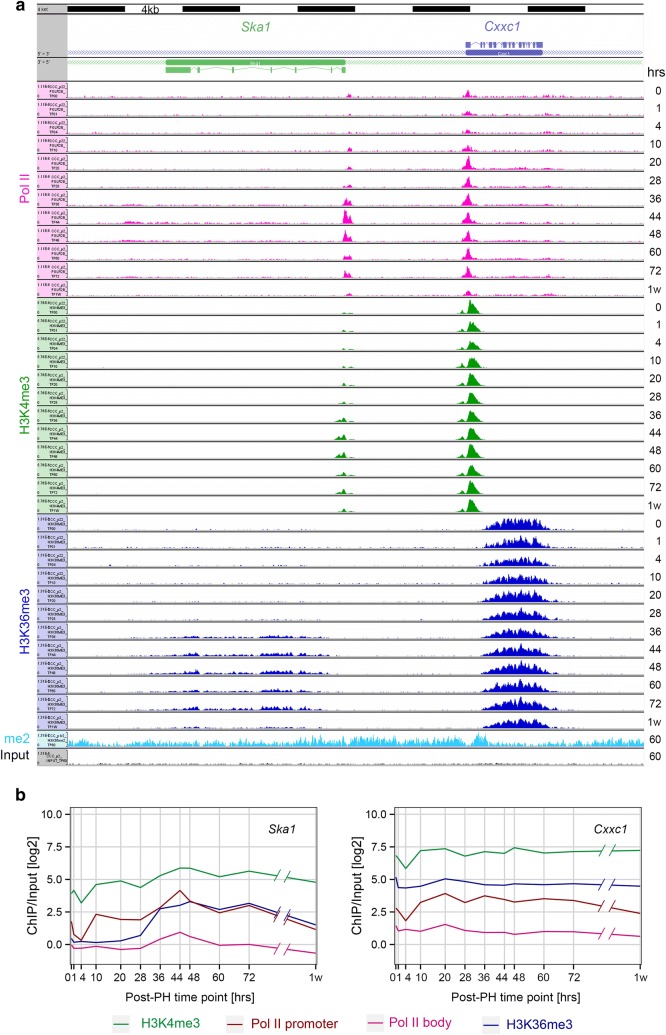
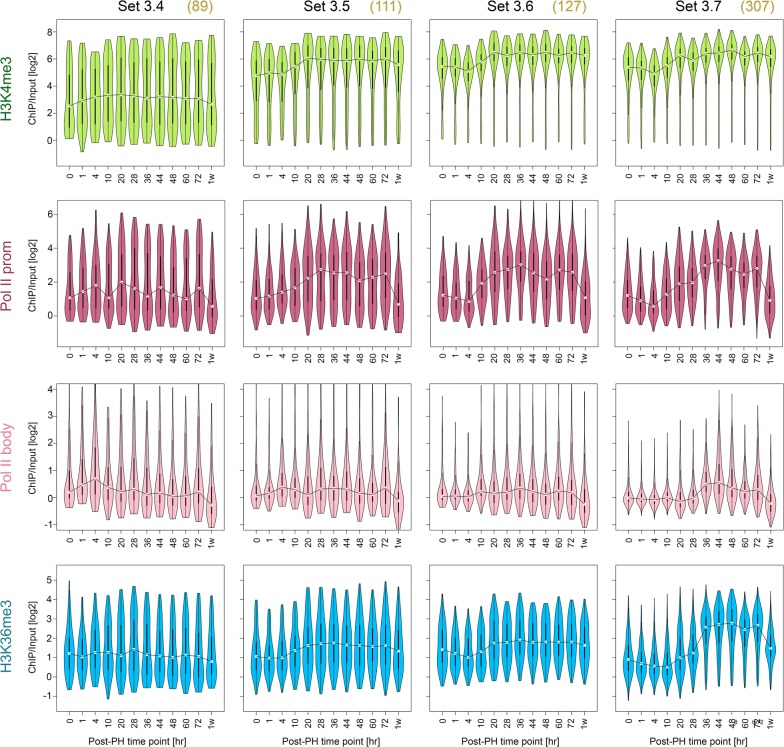
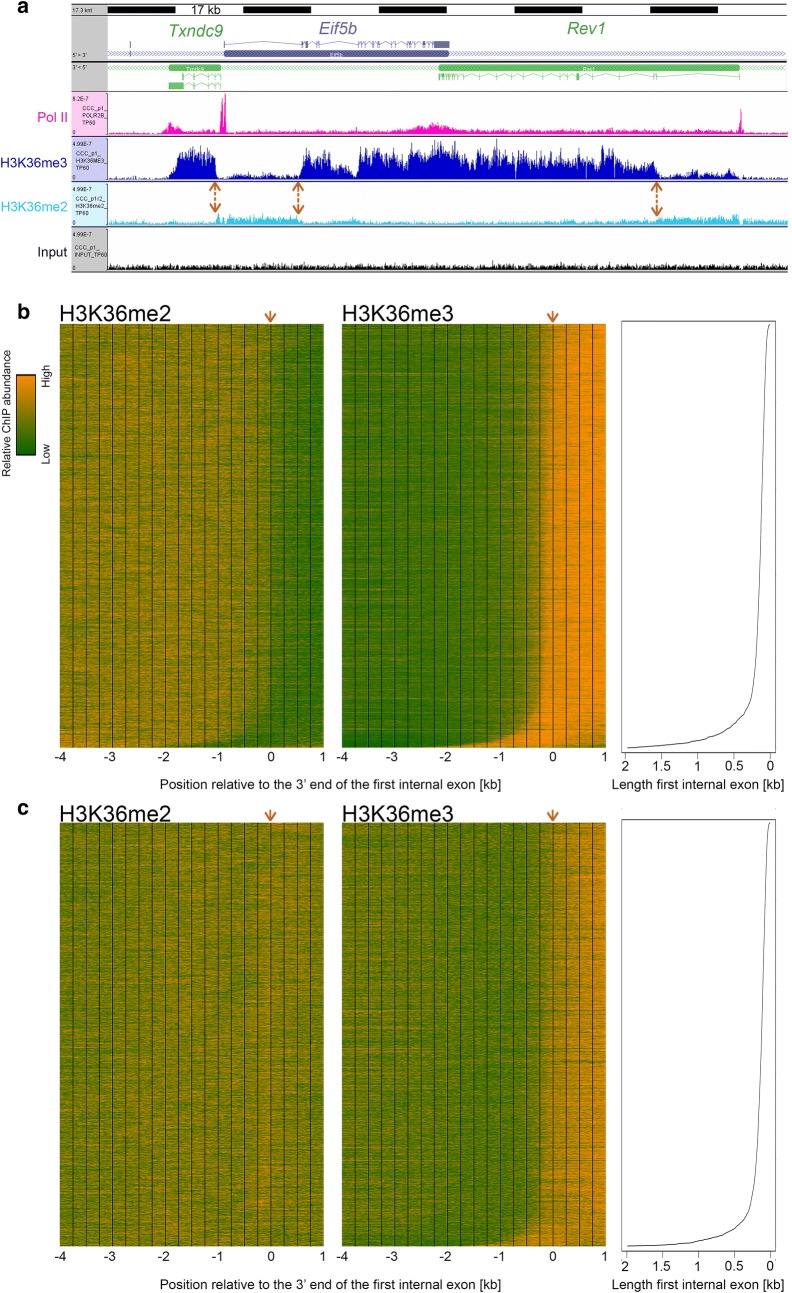
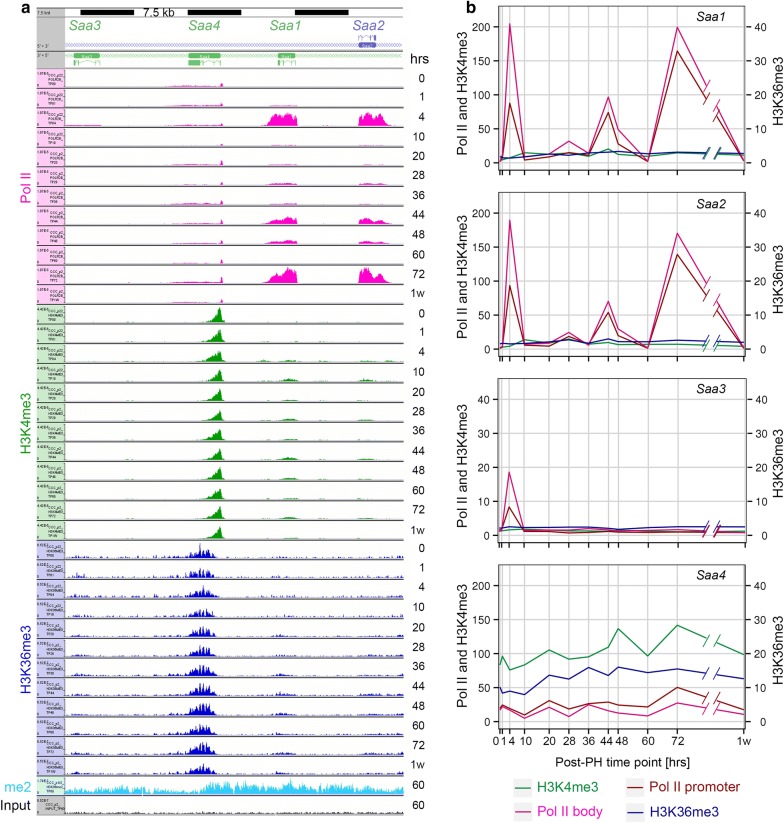
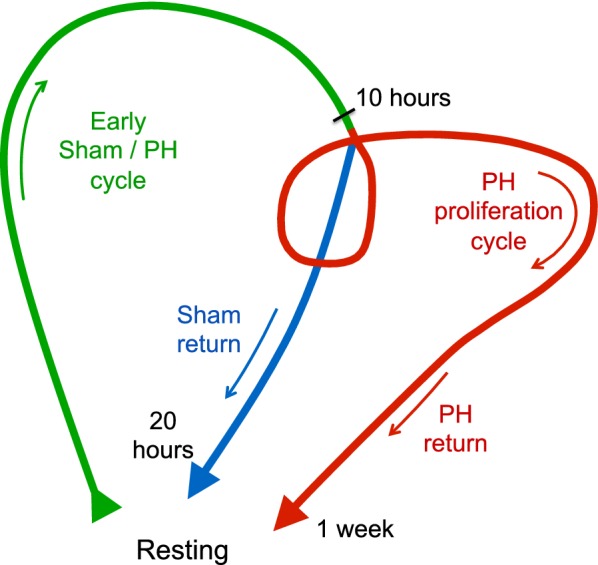
Results: During the first 10-20 h, the PH- and sham-surgery responses were very similar, including parallel early activation of cell-division-cycle genes. After 20 h, however, whereas post-PH livers continued with a robust and coordinate cell-division-cycle gene-expression response before returning to the resting state by 1 week, sham-surgery livers returned directly to a resting gene-expression state. Localization of RNA polymerase II (Pol II), and trimethylated histone H3 lysine 4 (H3K4me3) and 36 (H3K36me3) on genes dormant in the resting liver and activated during the PH response revealed a general de novo promoter Pol II recruitment and H3K4me3 increase during the early 10-20 h phase followed by Pol II elongation and H3K36me3 accumulation in gene bodies during the later proliferation phase. H3K36me3, generally appearing at the first internal exon, was preceded 5' by H3K36me2; 3' of the first internal exon, in about half of genes H3K36me3 predominated and in the other half H3K36me2 and H3K36me3 co-existed. Further, we observed some unusual gene profiles with abundant Pol II but little evident H3K4me3 or H3K36me3 modification, indicating that these modifications are neither universal nor essential partners to Pol II transcription.

Conclusions: PH and sham surgical procedures on mice reveal striking early post-operatory gene expression similarities followed by synchronized mRNA accumulation and epigenetic histone mark changes specific to PH.

Keywords: Gene expression; Histone modification; Liver regeneration; Partial hepatectomy; Transcription.


Figures

Fig. 1
Fig. 1
Gene-expression profiles after sham and PH surgery. a Dendogram of hierarchical clustering of gene-expression profiles for individual post-sham and post-PH samples. The 12,025 Set 1 and Set 2 genes listed in Additional files 3 and 4: Tables S1 and S2 were used in the analysis. Replicate samples are color-coded. Sample numbers represent hours post-treatment unless specified as weeks (W). C, control (no treatment); S, sham; X, PH. Branch lengths correspond to gene-expression differences among samples. The three principal branches are numbered I, II, and III, and set apart with brackets. b Two-dimensional PCA plot for components PC1 and PC2 of samples shown in part a. Samples labeled C, S, and X as in a are shown in green, gray, and red, respectively. The coordinates of replicate samples were averaged and are displayed as single dots; see Supplemental Figure S1D for standard deviations. Arrows indicate the paths followed by the post-sham (gray) and post-PH (red) samples. The S48 post-sham and X48 post-PH time points are highlighted in yellow and the X20 and X44 post-PH time points are connected by a dashed yellow arrow to emphasize the difference between the post-sham S20 to S48 and post-PH X20 to X48 trajectories in the PCA plot. Samples from branches I, II, and III from the hierarchical clustering dendogram (Fig. 1a) are each indicated with dotted circles. c Expression profiles of the mouse core circadian-cycle genes Arntl and Nrd1d1; the corresponding human gene names BMAL1 and RevERBa are given in parentheses. Log2 of RPKM quantifications for averaged replicate post-sham (black) and post-PH (yellow) samples are shown over 72 h; the shaded areas represent standard deviations. The hours post-surgery are shown on the lower x-axis and ZT hours on the upper x-axis
Fig. 2
Fig. 2
Changing Post-PH gene-expression patterns and comparison with sham-surgery samples. a Heat-map display of seven-set PAM-clustering results for transcripts that varied Post-PH gene-expression patterns (i.e., Set 3). The individually normalized relative post-PH transcript abundance (red, high; white, low) for each gene is shown. The seven PAM-clustering sets (Set 3.1 to Set 3.7 indicated by the color coding column to the left) are each grouped together with the comparative medoid at the top of each set and decreasing gene-expression similarity shown from top to bottom. Set 3 PAM-clustering subset name (column 1), number of genes per subset (column 2), and percentage genes per subset with a negative silhouette clustering score (column 3) are given. PAM-clustering sets with genes down-regulated (Set 3.1 to Set 3.3) and up-regulated (Set 3.4 to Set 3.7) post-PH are indicated by the brackets labeled I and II, respectively. b Silhouette-score distributions and averages for each PAM-clustering subset. c Transcript-abundance comparison between post-PH and post-sham samples at 1, 4, 10, 20 and 48 h. Genes are indicated as dots in the same order as in a. The post-PH/sham ratio is given in log2 scale (x axes). Positive (higher post-PH expression in red) and negative (higher post-sham expression in green) log2 scores are indicated as color gradients. Gene transcripts with post-PH and post-sham log2 RPKM quantifications less than 0 are not shown. d Predominant specific function of genes for each Set 3 PAM-clustering subset and number of genes per cluster included in the 124-gene Mus musculus KEGG cell-cycle pathway. Only the most representative GO term that is specific for an individual subset is listed. The full list of enriched GO terms is given in Additional file 6: Table S3
Fig. 3
Fig. 3
Transcript-abundance changes of the 124 Mus musculus KEGG cell-cycle genes post-sham and post-PH. The 124 Mus musculus KEGG cell-cycle genes are organized in a heat map according to their 0 h log2 RPKM transcript level (high to low, top to bottom). The 0-h log2 RPKM transcript-abundance level is compared separately to the post-sham (left) and post-PH (right), using gene-specific z-scores. Gene names and associated Set 3 PAM-clustering subset are listed to the right. Shared post-sham and PH 0–20-h and 48-h samples are outlined in green and gray, respectively. Arrow, Ccnd1 gene
Fig. 4
Fig. 4
Post-PH genomic responses for the divergently transcribed PH-induced Ska1 and non-PH-induced Cxxc1 genes. a Genomic view of the Ska1 (left) and Cxxc1 (right) genes. Densities of the central 50 bp of paired-end reads for Pol II (pink), H3K4me3 (green) and H3K36me3 (blue) ChIP fragments are shown for 0 h to 1 week post-PH. Similarly, densities for H3K36me2 and input fragments at 60 h post-PH are shown. b H3K4me3 (green), Pol II promoter (burgundy) and body (pink), and H3K36me3 (blue) log2 ChIP/input fragment-density comparison for the Ska1 (left) and Cxxc1 (right) genes post-PH. The central 50 bp of the paired-end reads were used for quantification. The regions used for each quantitation are given in the text
Fig. 5
Fig. 5
Post-PH genomic responses of genes activated by PH (Post-PH genes). H3K4me3 (green), Pol II promoter (burgundy) and body (pink), and H3K36me3 (blue) log2 ChIP/input fragment-density ratios were determined as described in Fig. 4 legend and text. The numbers in parentheses represent the number of Post-PH genes in each of Sets 3.4–3.7 and thus those used in the analysis. In each “violin” plot the width (x-axis) of the display represents fragment density at each respective ChIP/input density (y-axis). For each display, the line links the median for each distribution
Fig. 6
Fig. 6
Relative accumulation of H3K36me2 and H3K36me3 marks in genes. a 170 kb genome view of the Txndc9 (antisense), Eif5b (sense) and Rev1 (antisense) genes. Densities of Pol II (pink), H3K36me3 (dark blue), H3K36me2 (light blue) and input (black) fragments are shown for samples at 60 h post-PH as described in Fig. 4 legend. Double-headed orange arrows indicate the position of the 5′ end of the first internal intron of each gene. b, c Base-pair-resolution density of the central 50 bp of H3K36me2 (left) and H3K36me3 (right) ChIP fragments from 4 kb upstream to 1 kb downstream of the 3′ end of the first internal exon at 60 h post-PH. Transcription units with a minimum of three exons (9801 total) were selected for analysis: the 4900 transcription units with higher first-internal-exon H3K36me3 density at 60 h (see text) are shown in b and the remaining 4901 transcription units in c. The orange arrows indicate the position of the 3′ end of the first internal exon used for alignment. The transcription units are sorted from top to bottom according to increasing first-internal-exon length, as indicated in the right-hand panels. Color scale: orange, high H3K36me2 or H3K36me3 density; green, low H3K36me2 or H3K36me3 density
Fig. 7
Fig. 7
Genomic responses of the acute-response Saa genes post-PH. a 45 kb genome view of the Saa1 to Saa4 genes. Visualization of Pol II (pink), H3K4me3 (green), H3K36me3 (dark blue), H3K36me2 (light blue) and input (black) fragment densities is as described in Fig. 4 legend. b H3K4me3 (green), Pol II promoter (burgundy) and body (pink), and H3K36me3 (blue) log2 ChIP/input fragment-density comparison for the Saa1, Saa2, Saa3, and Saa4 genes (top-to-bottom) post-PH. The genomic regions and ChIP-fragment sequences (central 50 bp) used for each quantitation are as in Fig. 4. The y-axis scales for levels of Pol II and H3K4me3 (left), and H3K36me3 (right) differ
Fig. 8
Fig. 8
Graphic summary of cyclic gene-expression responses to sham and PH surgeries. Green, shared sham and PH surgery response; blue, sham-surgery-specific response; red, PH-surgery-specific response. See text for details

References

    1. Le Martelot G, Canella D, Symul L, Migliavacca E, Gilardi F, Liechti R, et al. Genome-wide RNA polymerase II profiles and RNA accumulation reveal kinetics of transcription and associated epigenetic changes during diurnal cycles. PLoS Biol. 2012;10:e1001442. doi: 10.1371/journal.pbio.1001442. - DOI - PMC - PubMed
    1. Gilardi F, Migliavacca E, Naldi A, Baruchet M, Canella D, Le Martelot G, et al. Genome-wide analysis of SREBP1 activity around the clock reveals its combined dependency on nutrient and circadian signals. PLoS Genet. 2014;10:e1004155. doi: 10.1371/journal.pgen.1004155. - DOI - PMC - PubMed
    1. Mange F, Praz V, Migliavacca E, Willis IM, Schütz F, Hernandez N. Diurnal regulation of RNA polymerase III transcription is under the control of both the feeding-fasting response and the circadian clock. Genome Res. 2017;27:973–984. doi: 10.1101/gr.217521.116. - DOI - PMC - PubMed
    1. Sobel JA, Krier I, Andersin T, Raghav S, Canella D, Gilardi F, et al. Transcriptional regulatory logic of the diurnal cycle in the mouse liver. PLoS Biol. 2017;15:e2001069. doi: 10.1371/journal.pbio.2001069. - DOI - PMC - PubMed
    1. Kouzarides T. Chromatin modifications and their function. Cell. 2007;128:693–705. doi: 10.1016/j.cell.2007.02.005. - DOI - PubMed

Publication types

Substances

LinkOut - more resources