. 2018 Nov 5;217(11):3886-3900.
doi: 10.1083/jcb.201711181. Epub 2018 Sep 12.

The kinetoplastid kinetochore protein KKT4 is an unconventional microtubule tip-coupling protein

Affiliations

The kinetoplastid kinetochore protein KKT4 is an unconventional microtubule tip-coupling protein

Aida Llauró et al. J Cell Biol. .

Abstract

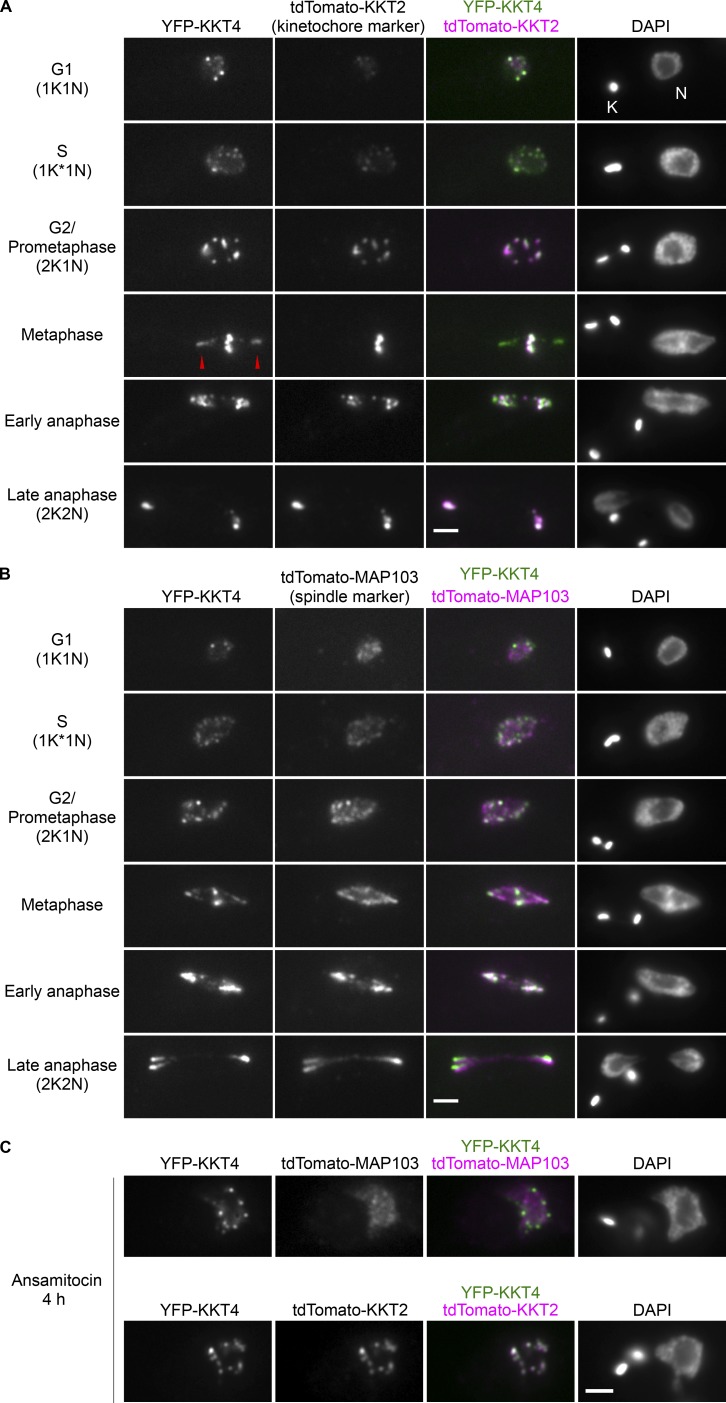
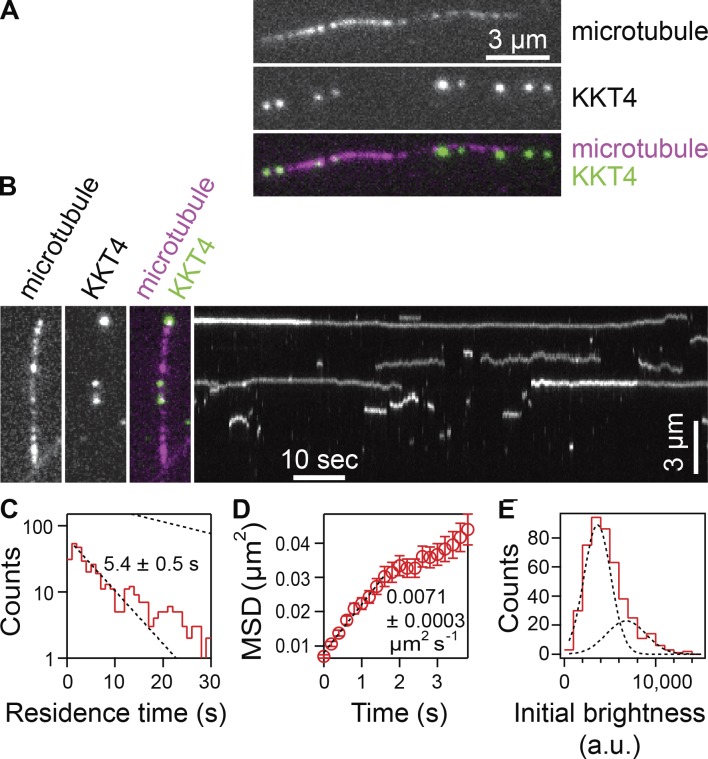
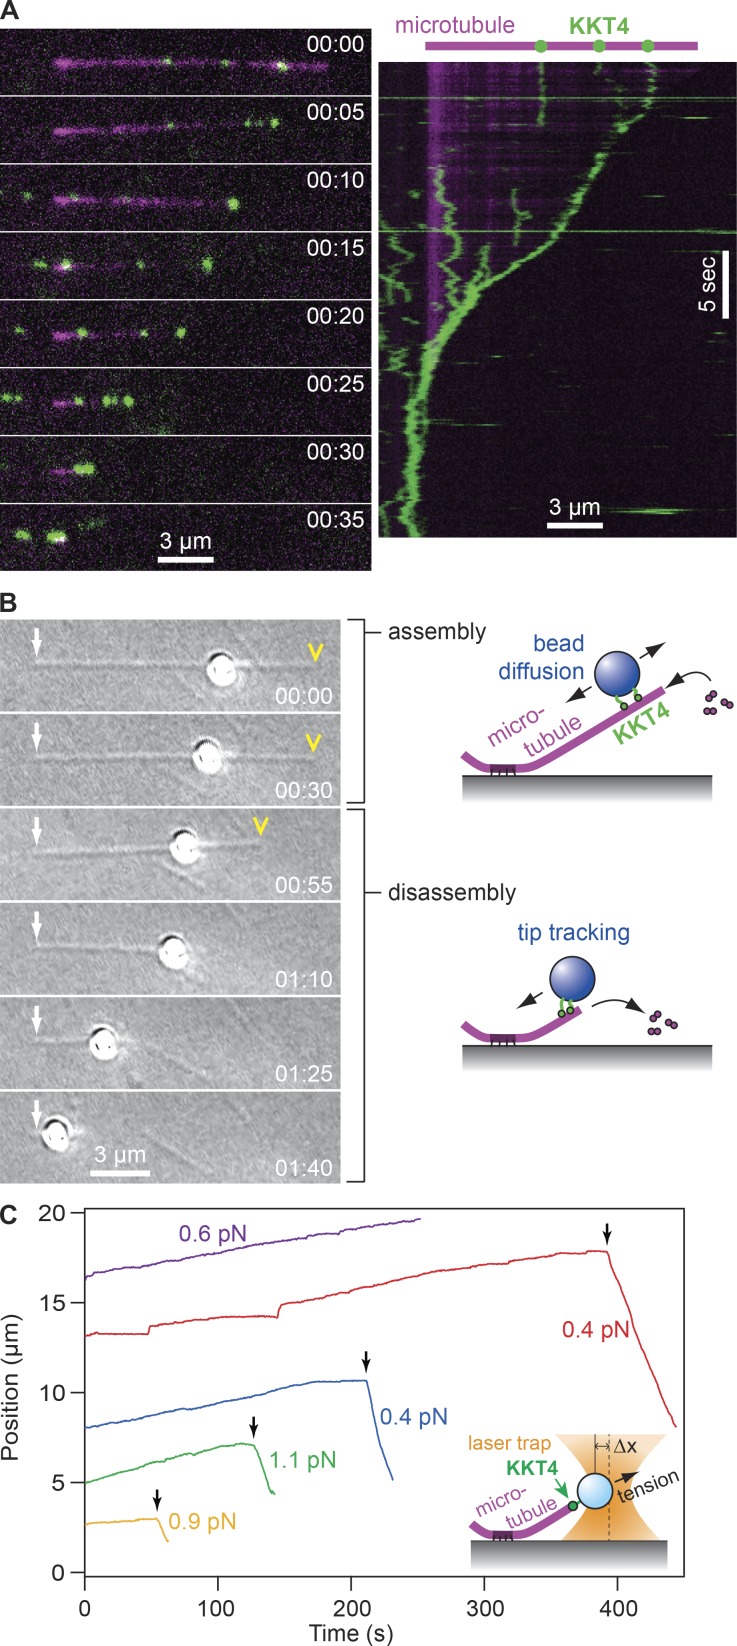
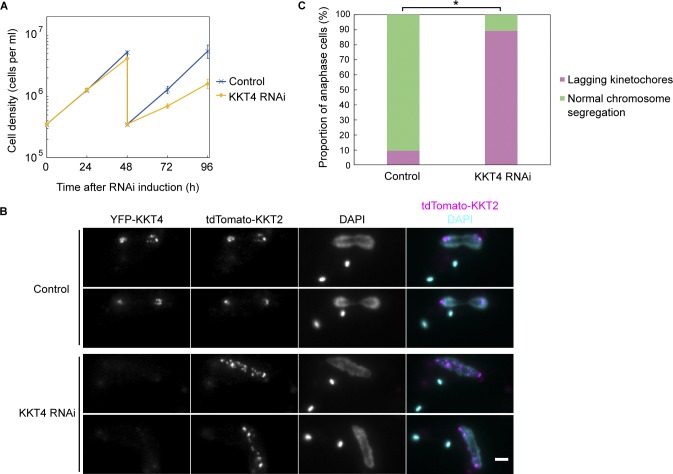
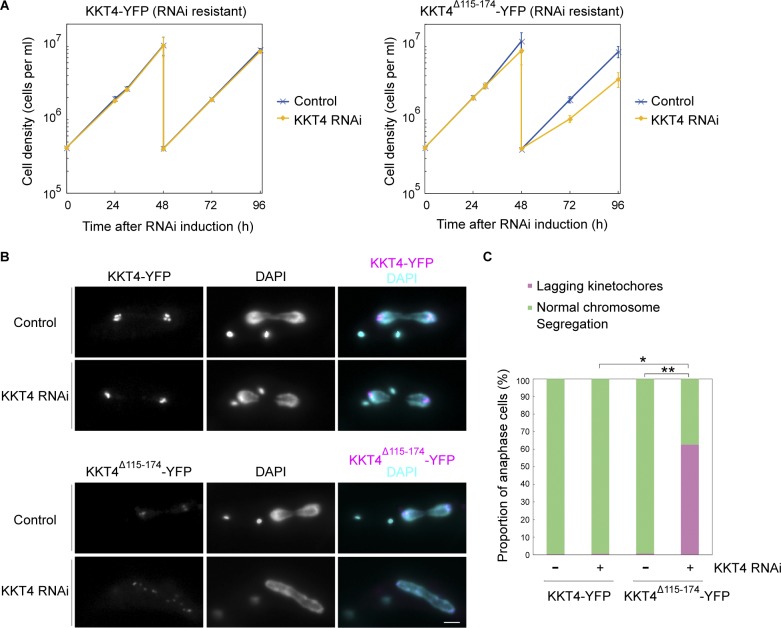
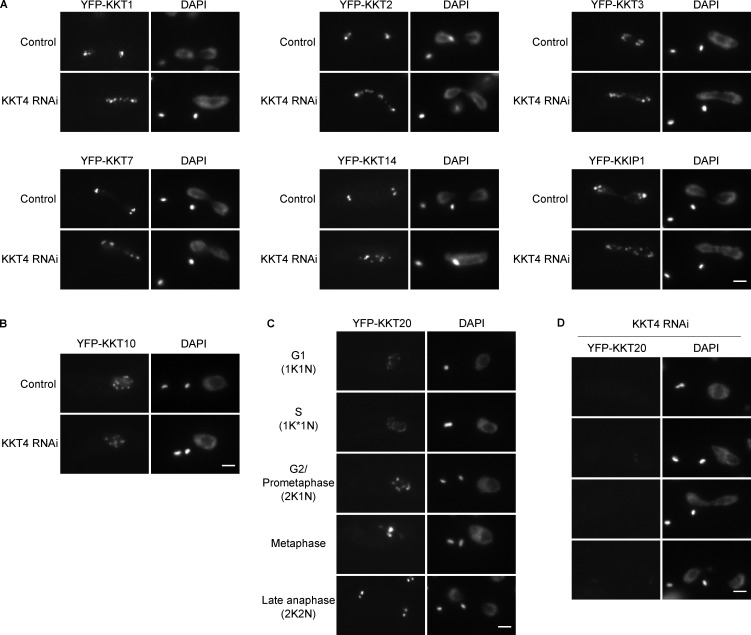
Kinetochores are multiprotein machines that drive chromosome segregation by maintaining persistent, load-bearing linkages between chromosomes and dynamic microtubule tips. Kinetochores in commonly studied eukaryotes bind microtubules through widely conserved components like the Ndc80 complex. However, in evolutionarily divergent kinetoplastid species such as Trypanosoma brucei, which causes sleeping sickness, the kinetochores assemble from a unique set of proteins lacking homology to any known microtubule-binding domains. Here, we show that the T. brucei kinetochore protein KKT4 binds directly to microtubules and maintains load-bearing attachments to both growing and shortening microtubule tips. The protein localizes both to kinetochores and to spindle microtubules in vivo, and its depletion causes defects in chromosome segregation. We define a microtubule-binding domain within KKT4 and identify several charged residues important for its microtubule-binding activity. Thus, despite its lack of significant similarity to other known microtubule-binding proteins, KKT4 has key functions required for driving chromosome segregation. We propose that it represents a primary element of the kinetochore-microtubule interface in kinetoplastids.


Figures

Figure 1.
Figure 1.
KKT4 localizes at spindle microtubules in addition to kinetochores. (A) Examples of cells expressing YFP-KKT4 and the kinetochore marker tdTomato-KKT2 at indicated cell-cycle stages (BAP665). Note that KKT4 has additional signals that do not colocalize with kinetochores, which are especially prominent in metaphase (arrowheads; n > 30 metaphase cells). K and N indicate the kinetoplast (mitochondrial DNA) and nucleus, respectively. These organelles have distinct replication and segregation timings and serve as good cell-cycle markers (Woodward and Gull, 1990; Siegel et al., 2008). K* denotes an elongated kinetoplast and indicates that the nucleus is in S phase. (B) Examples of cells expressing YFP-KKT4 and the spindle microtubule marker tdTomato-MAP103 showing that the nonkinetochore KKT4 signals partially colocalize with spindle microtubules (n > 20 metaphase cells; BAP943). (C) Examples of cells expressing YFP-KKT4 with tdTomato-MAP103 (top) or tdTomato-KKT2 (bottom) treated with 5 nM ansamitocin for 4 h and showing that KKT4 localizes at kinetochores even when bipolar spindle formation is perturbed (n > 20 cells in 2K1N). Bars, 2 µm.
Figure 2.
Figure 2.
KKT4 binds and diffuses on microtubules. (A) Wild-type, fluorescent-tagged KKT4 particles (green) decorating a Taxol-stabilized microtubule (magenta). (B) Two-color fluorescence image (left) and corresponding kymograph (right) showing diffusion of the KKT4 particles on the microtubule lattice. (C) Distribution of residence times on microtubules for wild-type KKT4 particles. Lower dotted line shows exponential fit used to determine average residence time (n = 452 binding events on 48 microtubules). Upper dotted line shows exponential distribution of bleach times for single fluorescent-tagged KKT4 particles, corresponding to an average of τbleach = 25 ± 1 s (n = 732 bleach events), which is long enough to ensure that KKT4 particles usually detached before bleaching. (D) Mean-squared displacement (MSD) of wild-type KKT4 particles plotted against time. Dotted line shows linear fit used to determine diffusion coefficient (n = 452 events). (E) Distribution of initial brightness values for wild-type KKT4 particles diffusing on Taxol-stabilized microtubules. Data are fitted by the sum of two Gaussians (dashed black curves) corresponding to a large population (72%) with a unitary brightness of 3,140 ± 1,470 a.u. and a small population (28%) with twice the brightness (mean ± SD; n = 452 particles).
Figure 3.
Figure 3.
KKT4115–343 is sufficient for microtubule binding. (A) Schematic of the KKT4 protein sequence. Several features conserved among kinetoplastids are shown, with the truncated proteins used in Fig. 3 (B and C) indicated below. (B) Microtubule sedimentation assays of KKT4 fragments showing that KKT4115–343 can bind microtubules, whereas KKT42–114, KKT4250–472, and KKT4462–645 do not. P and S stand for pellet and supernatant, respectively. Dots indicate KKT4 fragments tested in the assay. (C) Microtubule sedimentation assays of KKT4 fragments showing that KKT4115–174 can bind microtubules, albeit to a lesser extent than KKT4115–343. (D) The charge-reversal mutant KKT4 has reduced microtubule-binding activity.
Figure 4.
Figure 4.
Charge-reversal mutant KKT4 binds more weakly. (A) Kymographs showing binding and diffusion of full-length, wild-type KKT4 and charge-reversal mutant KKT4 (mut) on Taxol-stabilized microtubules. (B) Distributions of residence times on microtubules for wild-type KKT4 (red) and charge-reversal mutant KKT4 (blue). Corresponding dotted lines show exponential fits used to determine average residence times (n > 452 binding events on >48 microtubules). Upper dotted lines show exponential bleach-time distributions for single wild-type and mutant KKT4 particles, corresponding to average bleach times of τbleach = 25 ± 1 s and τbleach = 30 ± 1 s, respectively. Wild-type data are recopied from Fig. 2 for comparison. (C) Mean-squared displacement (MSD) of wild-type KKT4 (red) and mutant KKT4 (blue) particles plotted against time. Dotted lines show linear fits used to determine diffusion coefficients (n > 452 particles). Wild-type data are recopied from Fig. 2 for comparison. (D) Schematic of laser trap assay used to measure friction coefficients and rupture strengths for KKT4115–343-decorated beads. (E) Example record showing trap force and bead displacement versus time. (F) Friction coefficients for wild-type KKT4115–343 (red) and charge-reversal mutant KKT4115–343 (blue) at indicated concentrations (mean ± SEM; n = 13–47 events). All individual friction coefficient values are given in Table S1. (G) Attachment survival probability versus force for wild-type KKT4115–343 (red) and charge-reversal mutant KKT4115–343 (blue; n = 33 and 35 events, respectively). All individual rupture force values are given in Table S1.
Figure 5.
Figure 5.
KKT4 tracks with dynamic microtubule tips. (A) Selected frames (left) and kymograph (right) from Video 1 showing wild-type KKT4 (green) tracking with the disassembling tip of a microtubule (magenta). Elapsed times are in minutes:seconds. Individual KKT4 particles can also be seen diffusing on the microtubule lattice. (B) Selected frames from Video 2 showing a wild-type KKT4115–343–coated bead diffusing on the microtubule lattice and then tracking with a disassembling tip. Arrows indicate the coverslip-anchored portion of the microtubule seed. Arrowheads indicate the microtubule tip. Elapsed times are in minutes:seconds. (C) Records of bead position versus time during continuous application of tensile force. Increasing position represents assembly-coupled movement in the direction of applied force, away from the coverslip-anchored seed (e.g., red trace, <400 s). Decreasing position represents disassembly-driven motion against the applied force (e.g., red trace, >400 s). Arrows indicate “catastrophe” events when the microtubule tip switched spontaneously from assembly into disassembly. For clarity, the records are offset vertically by an arbitrary amount. Inset: Schematic of laser trap assay. Statistical data for all recorded events are provided in Table S1.
Figure 6.
Figure 6.
KKT4 is essential for accurate chromosome segregation. (A) RNAi-mediated knockdown of KKT4 leads to cell growth defects. Control is uninduced cell culture. Cultures were diluted at 48 h. Error bars represent SD from six experiments (BAP1082). Similar results were obtained using two independent RNAi constructs targeting different regions of the KKT4 transcript. (B) Cells expressing YFP-KKT4 and tdTomato-KKT2 were fixed at 48 h after induction, showing a number of lagging kinetochores in anaphase. Note that YFP-KKT4 signal was reduced by RNAi. Bar, 2 µm. (C) Quantification of anaphase cells with lagging kinetochores at 48 h postinduction showing that RNAi-induced cells have significantly more lagging kinetochores than uninduced control (*, P < 0.0001, Fisher’s exact test, n > 300 anaphase cells).
Figure 7.
Figure 7.
KKT4Δ115–174 fails to support proper chromosome segregation. (A) Expression of wild-type KKT4-YFP, but not KKT4Δ115–174-YFP, rescues the KKT4 3′ UTR–targeting RNAi phenotype. Controls are uninduced cell cultures. Error bars represent SD from three experiments (BAP1450 and BAP1484). (B) Examples of cells expressing KKT4-YFP (wild type or Δ115–174) fixed at 30 h postinduction and showing a number of lagging kinetochores in anaphase cells expressing KKT4Δ115–174. Bar, 2 µm. (C) Quantification of anaphase cells with lagging kinetochores at 30 h postinduction showing that RNAi-induced cells expressing KKT4Δ115–174 have significantly more lagging kinetochores than uninduced control (**, P < 0.0001, Fisher’s exact test) or RNAi-induced cells expressing wild-type KKT4 (*, P < 0.001, Fisher’s exact test; n > 300 anaphase cells for each).
Figure 8.
Figure 8.
KKT4 is an inner kinetochore protein. (A) tdTomato-KKT4 colocalizes with YFP-KKT2 in metaphase (n > 25 cells) and early anaphase cells (n = 8 cells; BAP1272). Linescans for the area indicated by white lines (1.5 µm) are shown on the right. (B) YFP-KKIP1 appears as pairs of dots in metaphase cells, while tdTomato-KKT4 appears as individual dots (n = 25 cells). In early anaphase, KKIP1 is closer to spindle poles than KKT4 (n = 14 cells; BAP1273).
Figure 9.
Figure 9.
KKT4 is dispensable for the localization of many kinetochore proteins. (A) Kinetochore localization of YFP-tagged KKT1, KKT2, KKT3, KKT7, KKT14, and KKIP1 is not affected by KKT4 knockdown. Controls are uninduced cell cultures. Example of anaphase cells fixed 48 h postinduction are shown (n > 20 anaphase cells; BAP1236, BAP1237, BAP1238, BAP1240, BAP1242, and BAP1243). (B) Kinetochore localization of YFP-KKT10 is not disrupted by KKT4 knockdown (n > 20 cells in 2K1N; BAP1241). (C) The KKT20 short isoform (Tb927.8.4760.1:mRNA) localizes at kinetochores throughout the cell cycle in unperturbed cells (BAP1244). Note that the Tb927.8.4760.2:mRNA long isoform has less bright signal and localizes at kinetochores from S phase to anaphase (Nerusheva and Akiyoshi, 2016). (D) Kinetochore localization of the KKT20 short isoform is significantly diminished in >80% of cells upon KKT4 knockdown (n > 30 cells each in the 1K1N, 2K1N, and 2K2N category). Bars, 2 µm.

Similar articles

Cited by

References

    1. Akiyoshi B. 2016. The unconventional kinetoplastid kinetochore: from discovery toward functional understanding. Biochem. Soc. Trans. 44:1201–1217. 10.1042/BST20160112 - DOI - PMC - PubMed
    1. Akiyoshi B., and Gull K.. 2014. Discovery of unconventional kinetochores in kinetoplastids. Cell. 156:1247–1258. 10.1016/j.cell.2014.01.049 - DOI - PMC - PubMed
    1. Al-Bassam J., and Chang F.. 2011. Regulation of microtubule dynamics by TOG-domain proteins XMAP215/Dis1 and CLASP. Trends Cell Biol. 21:604–614. 10.1016/j.tcb.2011.06.007 - DOI - PMC - PubMed
    1. Al-Bassam J., van Breugel M., Harrison S.C., and Hyman A.. 2006. Stu2p binds tubulin and undergoes an open-to-closed conformational change. J. Cell Biol. 172:1009–1022. 10.1083/jcb.200511010 - DOI - PMC - PubMed
    1. Alushin G.M., Ramey V.H., Pasqualato S., Ball D.A., Grigorieff N., Musacchio A., and Nogales E.. 2010. The Ndc80 kinetochore complex forms oligomeric arrays along microtubules. Nature. 467:805–810. 10.1038/nature09423 - DOI - PMC - PubMed

Publication types

MeSH terms

Substances

LinkOut - more resources