. 2018 Oct 2;132(4):jcs219709.
doi: 10.1242/jcs.219709.

Reconstitution of immune cell interactions in free-standing membranes

Affiliations

Reconstitution of immune cell interactions in free-standing membranes

Edward Jenkins et al. J Cell Sci. .

Abstract

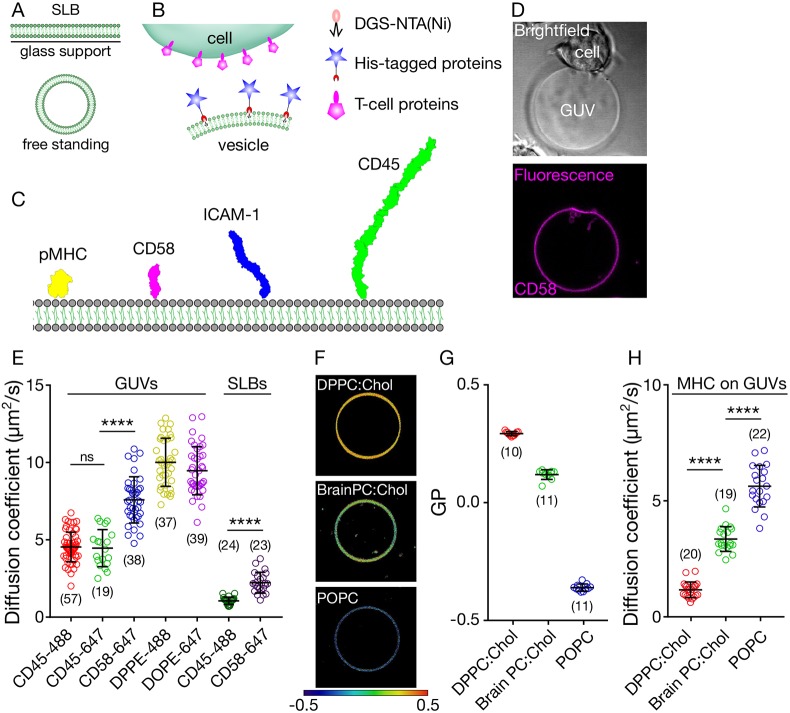
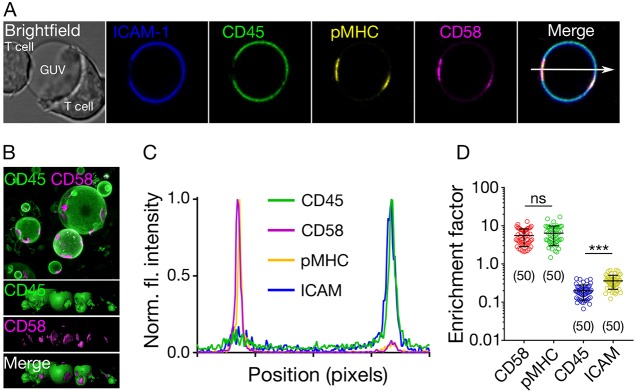
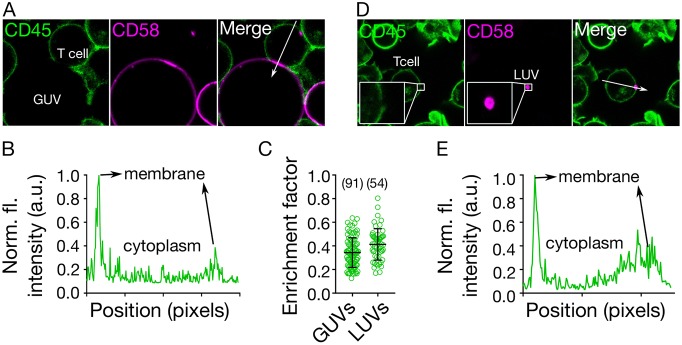
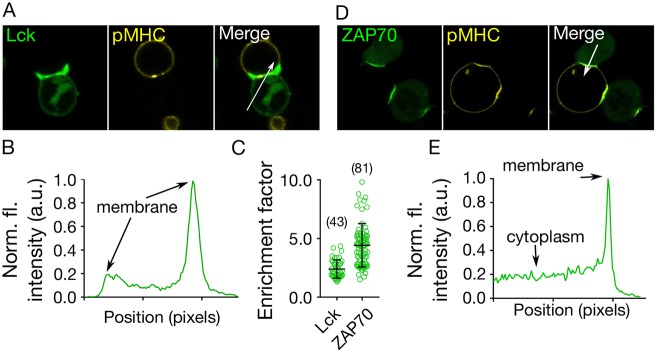
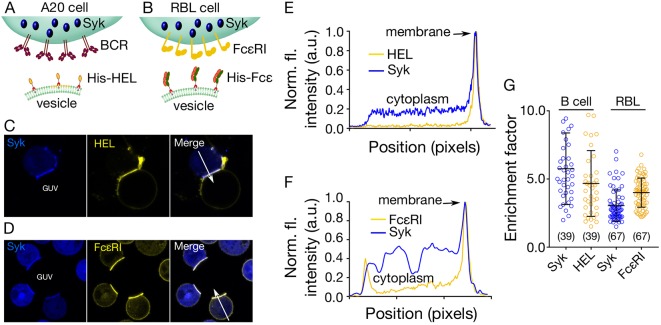
The spatiotemporal regulation of signalling proteins at the contacts formed between immune cells and their targets determines how and when immune responses begin and end. Therapeutic control of immune responses therefore relies on thorough elucidation of the molecular processes occurring at these interfaces. However, the detailed investigation of each component's contribution to the formation and regulation of the contact is hampered by the complexities of cell composition and architecture. Moreover, the transient nature of these interactions creates additional challenges, especially in the use of advanced imaging technology. One approach that circumvents these problems is to establish in vitro systems that faithfully mimic immune cell interactions, but allow complexity to be 'dialled-in' as needed. Here, we present an in vitro system that makes use of synthetic vesicles that mimic important aspects of immune cell surfaces. Using this system, we began to explore the spatial distribution of signalling molecules (receptors, kinases and phosphatases) and how this changes during the initiation of signalling. The GUV/cell system presented here is expected to be widely applicable.

Keywords: Giant unilamellar vesicles; Immune signalling; Immune synapse; In vitro reconstitution; Model membranes.


Conflict of interest statement

Competing interestsThe authors declare no competing or financial interests.

Figures

Fig. 1.
Fig. 1.
The in vitro system. (A) Depiction of supported lipid bilayers and free-standing vesicles. (B) Scheme showing the in vitro cell–vesicle interaction. (C) Molecules of interest for this study, drawn to scale based on structure determinations (Chang et al., 2016). (D) Example bright field (top) and fluorescence (bottom) images of CD2+ Jurkat–CD58+ GUV contact (image size 50 µm×50 µm). (E) Diffusion analysis of fluorescently labelled lipids and proteins in GUVs and SLBs. (F) Lipid packing of GUVs of varying composition revealed by a GP map (image size 40 µm×40 µm). (G) Quantification of the GP. (H) Diffusion analysis of fluorescently labelled pMHC on GUVs composed of different lipids. Student's t-test (two-tailed) was used to determine significance (****P<0.0001). Error bars represent standard deviation of the mean. Number of data points obtained from at least three independent experiments are indicated on the graphs in parentheses.
Fig. 2.
Fig. 2.
Protein reorganisation at cellGUV contacts. (A) Distribution of ICAM-1, CD45, pMHC and CD58 at cell–GUV contacts (image size 40 µm×40 µm). (B) 3D image (top, top view of raw image; bottom, side views of surface image) of the contact formed between 1G4 T cells and GUVs, showing the abundance of contacts formed (image size 75 µm×75 µm). (C) Intensity line profile (arrow shown in A) of the fluorescence signal through the T cell contacting the GUV. (D) Quantification of the fluorescence signal inside and outside of the contacts (inside/outside ratio) for all four proteins. Student's t-test (two-tailed) was used to determine significance (***P<0.001). Error bars represent standard deviation of the mean. Data are representative of at least three independent experiments and for each data set, the number of data points is indicated on the graphs in parentheses.
Fig. 3.
Fig. 3.
Requirements for CD45 segregation. (A) Distribution of CD45 (on the T cell surface) and CD58 (attached to the GUV), showing that close contact induces local exclusion of CD45 phosphatase (image size 40 µm×40 µm). (B) Line plot of CD45 fluorescence intensity indicated by white arrow in A. (C) CD45 exclusion at GUV/LUV–cell contacts. The enrichment factor represents the ratio of fluorescence intensity at the contact site versus non-contact site. (D) Small LUVs (<250 nm, coated with CD58) induce exclusion of CD45 on cells (image size 50 µm×50 µm). (E) Line plot of CD45 fluorescence intensity indicated by white arrow in D. Cells were labelled with anti-CD45 Gap8.3 Fab-Alexa Fluor 488. Error bars represent standard deviation of the mean. Data is representative of at least three independent experiments; for each data set, the number of data points is indicated on the graphs in parentheses.
Fig. 4.
Fig. 4.
GUV-induced activation of T cells. (A) Cellular localisation of Lck (labelled with EGFP, green) following T cell binding to GUVs coated with pMHC. (B) The intensity line profile of the Lck fluorescence signal through the contact (arrow in A) shows enrichment of Lck at the contact. (C) Enrichment of Lck/ZAP70 at GUV–cell contact sites. The enrichment factor represents the ratio of fluorescence intensity at the contact site versus non-contact site (cytoplasmic signal for ZAP70). (D) Cellular localisation of ZAP70 (labelled with HaloTag™) upon binding to vesicles carrying pMHC. (E) The intensity line profile of the ZAP70–HaloTag fluorescence signal through the contact zone (arrow in D) shows enrichment at the contact (image size 40 µm×40 µm). Error bars represent standard deviation of the mean. Data is representative of at least three independent experiments and the number of data points is indicated on the graphs in parentheses.
Fig. 5.
Fig. 5.
Mast and B cell activation initiated by GUVcell contact. (A) Diagram showing the in vitro system used for studying A20 (B cell) signalling. Syk kinase is tagged with mCitrine in A20 cells and HEL labelled via a HALO® tag and presented on the GUV surface. (B) Diagram showing the in vitro system used for studying RBL-2H3 (mast cell) signalling. Mast cell Syk kinase was mCitrine-tagged, and FcεRI was fluorescently labelled via a SNAP® tag. GUVs presented a His-tagged form of the Fcε portion of the IgE antibody, which served as a ligand for FcεRI. (C,D) Example images of cellular localisation of Syk and either HEL (C) or FcεRI (D) in A20 or RBL-2H3 cells upon contact with GUVs (image size 40 µm×40 µm). (E) Intensity line profile of the Syk and HEL fluorescence signal through the contact (white arrow in C). (F) Intensity line profile of the Syk and FcεRI fluorescence signal through the contact (white arrow in D). (G) Quantitation of HEL/FcεRI and Syk kinase at GUV–cell contact sites. The enrichment factor represents the ratio of fluorescence intensity at the contact versus non-contact sites. Error bars represent standard deviation of the mean. Number of data points obtained from at least three independent experiments are indicated on the graphs in parentheses.

References

    1. Altman J. D., Moss P. A. H., Goulder P. J. R., Barouch D. H., McHeyzer-Williams M. G., Bell J. I., McMichael A. J. and Davis M. M. (1996). Phenotypic analysis of antigen-specific T lymphocytes. Science 274, 94-96. 10.1126/science.274.5284.94 - DOI - PubMed
    1. Beningo K. A. and Wang Y. L. (2002). Fc-receptor-mediated phagocytosis is regulated by mechanical properties of the target. J. Cell Sci. 115, 849-856. - PubMed
    1. Bertolet G. and Liu D. (2016). The planar lipid bilayer system serves as a reductionist approach for studying NK cell immunological synapses and their functions. Methods Mol. Biol. 1441, 151-165. 10.1007/978-1-4939-3684-7_13 - DOI - PMC - PubMed
    1. Bhatia T., Agudo-Canalejo J., Dimova R. and Lipowsky R. (2018). Membrane nanotubes increase the robustness of giant vesicles. ACS Nano 12, 4478-4485. 10.1021/acsnano.8b00640 - DOI - PubMed
    1. Blouin C. M., Hamon Y., Gonnord P., Boularan C., Kagan J., Viaris de Lesegno C., Ruez R., Mailfert S., Bertaux N., Loew D. et al. (2016). Glycosylation-dependent IFN-gammaR partitioning in lipid and actin nanodomains is critical for JAK activation. Cell 166, 920-934. 10.1016/j.cell.2016.07.003 - DOI - PubMed

Publication types

MeSH terms

LinkOut - more resources