. 2018 Nov 12;92(23):e01022-18.
doi: 10.1128/JVI.01022-18. Print 2018 Dec 1.

Epstein-Barr Virus MicroRNA miR-BART5-3p Inhibits p53 Expression

Affiliations

Epstein-Barr Virus MicroRNA miR-BART5-3p Inhibits p53 Expression

Xiang Zheng et al. J Virol. .

Abstract

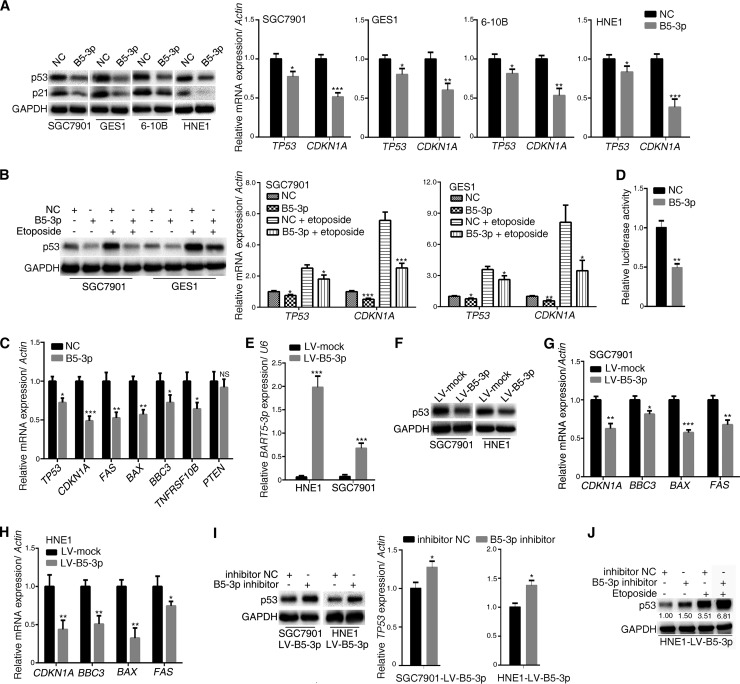
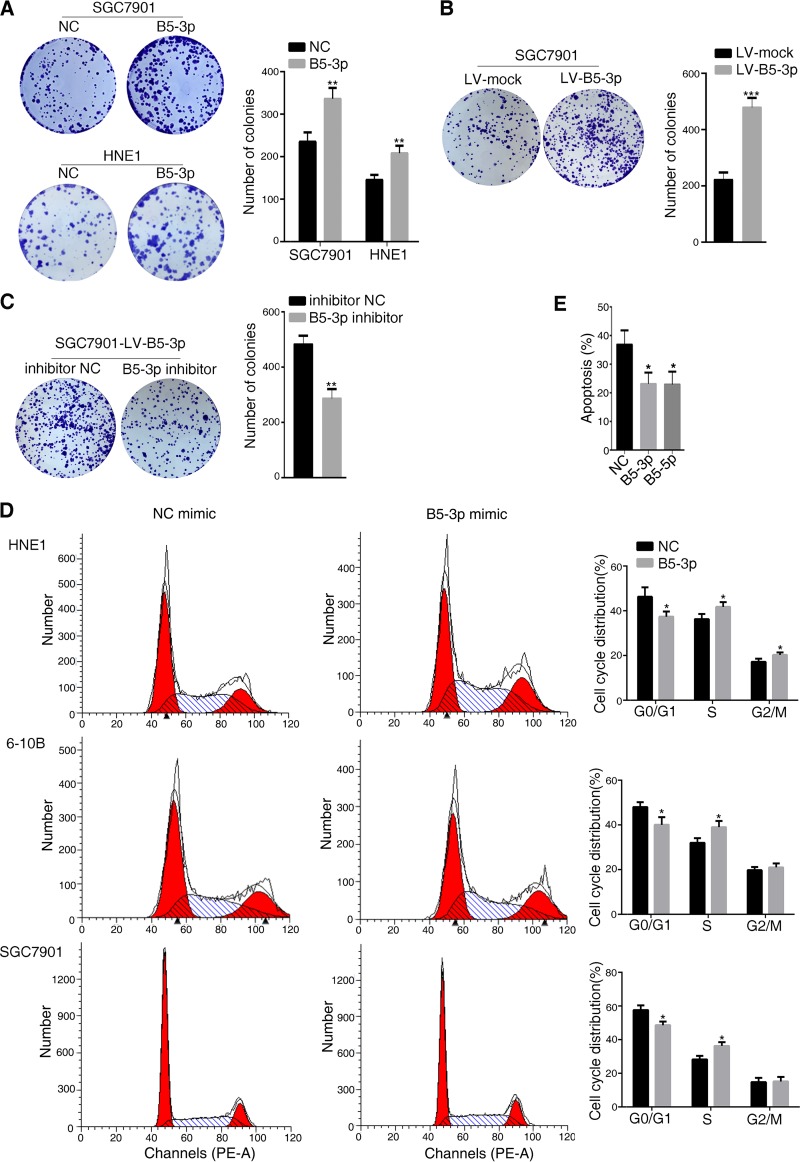
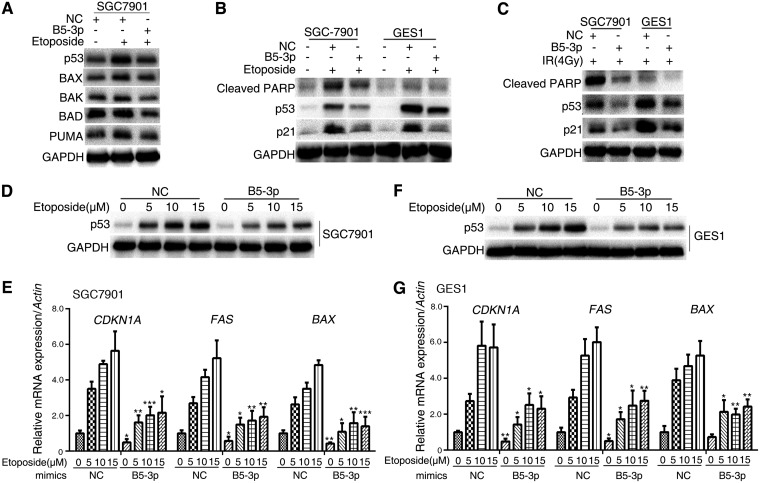
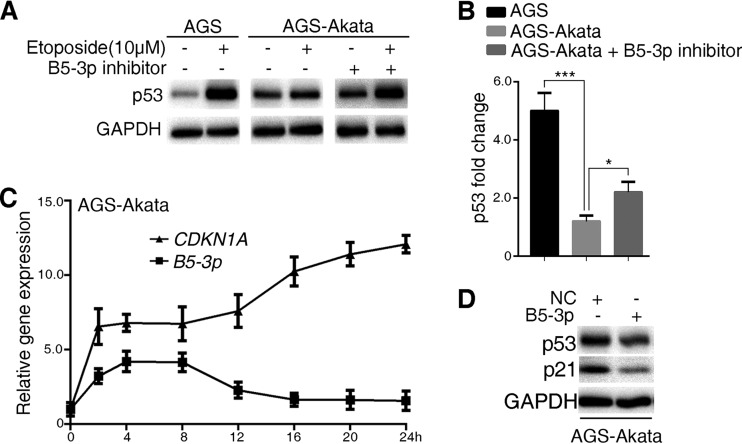
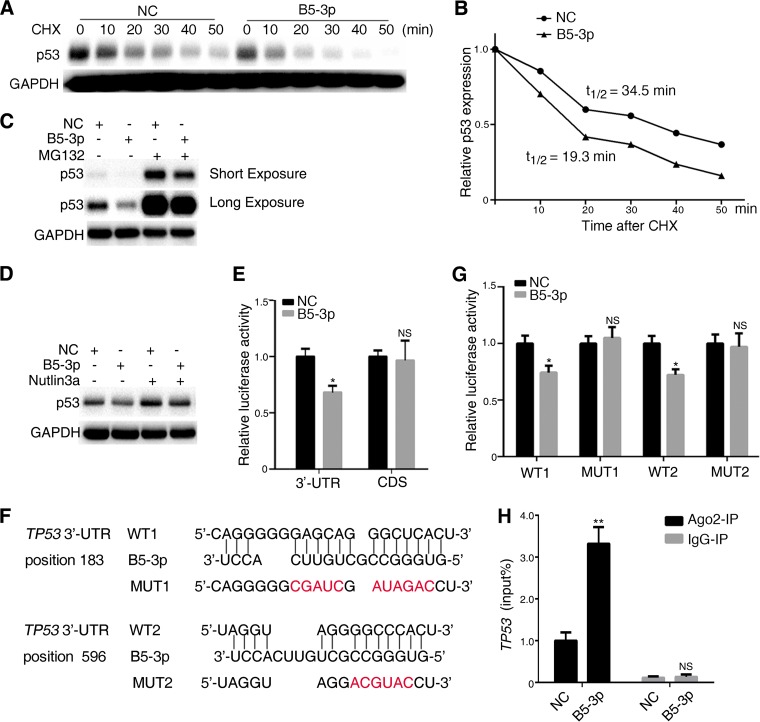
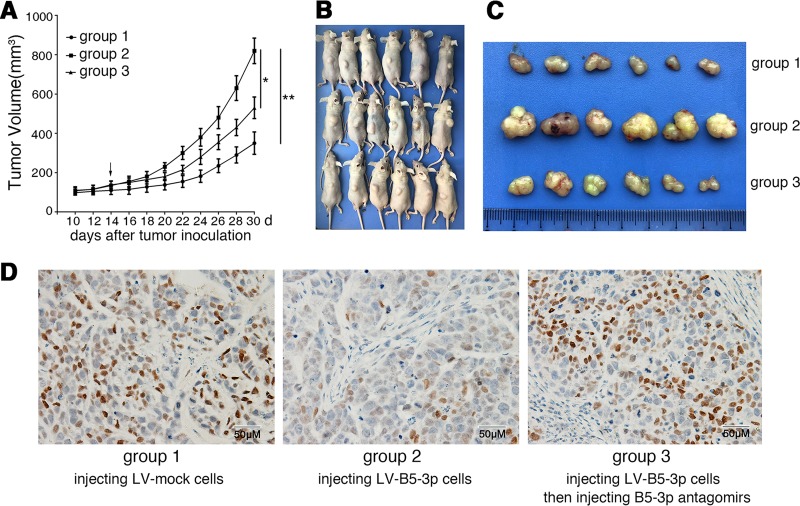
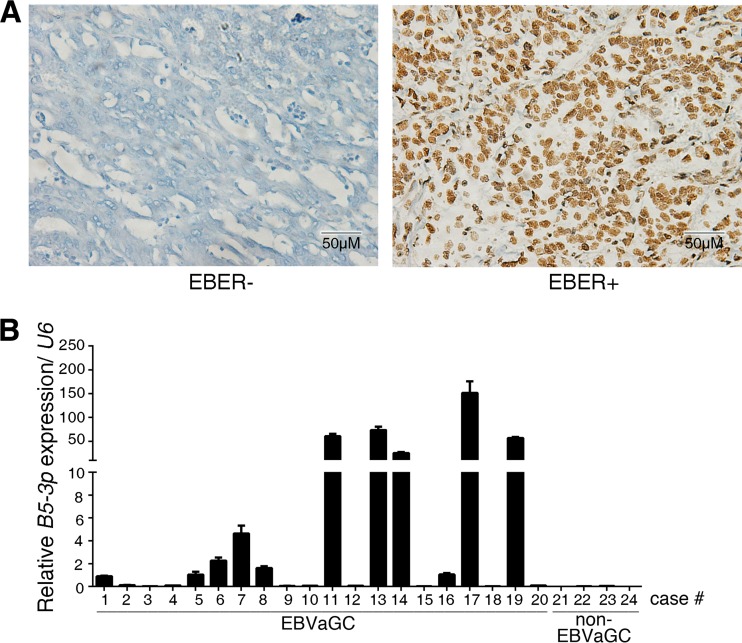
Epstein-Barr virus (EBV) is the first human virus found to encode many microRNAs. It is etiologically linked to nasopharyngeal carcinoma and EBV-associated gastric carcinoma. During the latent infection period, there are only a few EBV proteins expressed, whereas EBV microRNAs, such as the BamHI-A region rightward transcript (BART) microRNAs, are highly expressed. However, how these BART miRNAs precisely regulate the tumor growth in nasopharyngeal carcinoma and gastric carcinoma remains obscure. Here, we report that upregulation of EBV-miR-BART5-3p promotes the growth of nasopharyngeal carcinoma and gastric carcinoma cells. BART5-3p directly targets the tumor suppressor gene TP53 on its 3'-untranslated region (3'-UTR) and consequently downregulates CDKN1A, BAX, and FAS expression, leading to acceleration of the cell cycle progress and inhibition of cell apoptosis. BART5-3p contributes to the resistance to chemotherapeutic drugs and ionizing irradiation-induced p53 increase. Moreover, BART5-3p also facilitates degradation of p53 proteins. BART5-3p is the first EBV-microRNA to be identified as inhibiting p53 expression and function, which suggests a novel mechanism underlying the strategies employed by EBV to maintain latent infection and promote the development of EBV-associated carcinomas.IMPORTANCE EBV encodes 44 mature microRNAs, which have been proven to promote EBV-associated diseases by targeting host genes and self-viral genes. In EBV-associated carcinomas, the expression of viral protein is limited but the expression of BART microRNAs is extremely high, suggesting that they could be major factors in the contribution of EBV-associated tumorigenesis. p53 is a critical tumor suppressor. Unlike in most human solid tumors, TP53 mutations are rare in nasopharyngeal carcinoma and EBV-associated gastric carcinoma tissues, suggesting a possibility that some EBV-encoded products suppress the functions of p53. This study provides the first evidence that a BART microRNA can suppress p53 expression by directly targeting its 3'-UTR. This study implies that EBV can use its BART microRNAs to modulate the expression of p53, thus maintaining its latency and contributing to tumorigenesis.

Keywords: Epstein-Barr virus; gastric cancer; miR-BART5-3p; nasopharyngeal carcinoma; p53.


Figures

FIG 1
FIG 1
BART5-3p inhibits the expression and transcriptional activity of p53 in multiple cell lines. (A) SGC7901, GES1, 6-10B, and HNE1 cells were transfected with either negative-control mimics (NC) or BART5-3p mimics (B5-3p) for 36 h. The protein levels of p53 and p21 were determined by Western blotting, and the mRNA levels of TP53 and CDKN1A were analyzed by qPCR. (B) SGC7901 and GES1 cells were transfected with either NC mimics or BART5-3p mimics for 12 h initially and then treated (or not treated) with 10 μM etoposide for another 24 h; the protein levels of p53 were determined by Western blotting, and the mRNA levels of TP53 and CDKN1A were analyzed by qPCR. (C) SGC7901 cells were transfected with NC or BART5-3p mimics for 24 h. The mRNA expression levels of the indicated genes were analyzed by qPCR. (D) SGC7901 cells were cotransfected with mimics and firefly luciferase pp53-TA-luc reporter plasmid along with Renilla luciferase reporter plasmid for 24 h before the luciferase reporter assay was performed. The data are shown as the relative firefly luciferase activity normalized to the value of Renilla luciferase. (E to H) Two stable BART5-3p-expressing cell lines were constructed by lentivirus-mediated transduction in HNE1 and SGC7901 cells. The transcriptional levels of BART5-3p were assayed by qPCR (E), and the p53 protein levels were determined by Western blotting (F); mRNA expression levels of the indicated genes were analyzed by qPCR (G, H). (I) HNE1-LV-B5-3p and SGC7901-LV-B5-3p cells were transfected with NC inhibitors or BART5-3p inhibitors for 36 h. The p53 protein levels were determined by Western blotting, and the mRNA levels of TP53 were analyzed by qPCR. (J) HNE1-LV-B5-3p cells were transfected with either NC inhibitor or BART5-3p inhibitor for 12 h initially and then treated (or not treated) with 10 μM etoposide for another 24 h. The protein expression levels of p53 were determined by Western blotting. GAPDH (glyceraldehyde-3-phosphate dehydrogenase) was used as protein loading control. Actin was used for normalizing the expression of mRNA. RPU6B (U6) was used for normalizing the expression of BART5-3p. Both the mean mRNA expression and mean luciferase activity were calculated from 3 independent experiments, and data are shown as the means ± standard errors of the means (SEM). NS, not significant; *, P < 0.05; **, P < 0.01; ***, P < 0.001 compared with the control group (NC or mock).
FIG 2
FIG 2
BART5-3p propels cell growth in vitro. Colony formation assays were performed as described in Materials and Methods, and representative images (A, B, and C, left panels) and number of colonies (A, B, and C, right panels) are shown. (A) SGC7901 and HEN1cells were transfected with either NC or BART5-3p mimics for 6 h, and then cells were reseeded. (B) Colony formation assays were performed in SGC7901-LV-mock and SGC7901-LV-B5-3p cells. (C) SGC7901-LV-B5-3p cells were transfected with either NC or BART5-3p inhibitors for 6 h, and then cells were reseeded. (D) HEN1, 6-10B, and SGC7901 cells were transfected with either NC or BART5-3p mimics for 36 h, and the cell cycle distribution was detected by a flow cytometer. (E) SGC7901 cells were transfected with the indicated mimics for 12 h and then treated with 20 μM etoposide for another 48 h. The number of apoptosis cells was determined by a flow cytometer. Three independent experiments were performed, and data are shown as the means ± SEM. *, P < 0.05; **, P < 0.01; ***, P < 0.001 compared with the control group (NC or mock).
FIG 3
FIG 3
BART5-3p protects cells from apoptosis. (A) SGC7901 cells were transfected with NC or BART5-3p mimics for 12 h and then treated with 10 μM etoposide for 24 h. The protein levels of p53, BAX, BAK, BAD, and PUMA were determined by Western blotting. (B) SGC7901 and GES1 cells were transfected with NC or BART5-3p mimics for 12 h and then treated with 20 μM etoposide for 48 h. The protein levels of p53, p21, and cleaved PARP were determined by Western blotting. (C) SGC7901 and GES1 cells were transfected with NC or BART5-3p mimics for 12 h and then treated with 4Gy IR. The cells were harvested 24 h after irradiation. The protein levels of p53, p21, and cleaved PARP were determined by Western blotting. (D to G) SGC7901 and GES1 cells were transfected with NC or BART5-3p mimics for 12 h and then treated with the indicated concentrations of etoposide for 24 h. The protein levels of p53 were determined by Western blotting. The mRNA levels of CDKN1A, FAS, and BAX were detected by qPCR. GAPDH was used as the protein loading control. Actin was used for normalizing the expression of mRNA. Three independent experiments were performed, and data are shown as the means ± SEM. *, P < 0.05; **, P < 0.01; ***, P < 0.001 compared with the control group (NC).
FIG 4
FIG 4
EBV confers gastric cancer cells resistance to apoptosis, and BART5-3p is involved. (A, B) Cells were treated (or not treated) with 10 μM etoposide for 24 h. AGS-Akata cells were transfected (or not) with BART5-3p inhibitor for 12 h before being treated with etoposide. The protein levels of p53 were detected by Western blotting (A); the relative p53 protein level was normalized to GAPDH, and the fold changes (after/before etoposide treatment) are shown. *, P < 0.05; ***, P < 0.001 (B). (C) AGS-AKATA cells were treated with 10 μM etoposide for the indicated times. The RNA levels of CDKN1A and BART5-3p were detected by qPCR. Actin was used for normalizing the expression of CDKN1A. RPU6B (U6) was used for normalizing the expression of BART5-3p. (D) AGS-AKATA cells were transfected with NC or BART5-3p mimics for 36 h. The protein levels of p53 and p21 were detected by Western blotting.
FIG 5
FIG 5
BART5-3p directly targets TP53 and promotes the degradation of p53 protein. (A) SGC7901 cells were transfected with NC or BART5-3p mimics for 36 h, were subsequently treated with cycloheximide (20 μg/ml), and were collected after the indicated periods of time. The protein levels of p53 were determined by Western blotting. (B) p53 protein half-life was calculated by quantification of Western blots shown in panel A using Image Lab software; the half-life of p53 is indicated. (C) SGC7901 cells were transfected with NC or BART5-3p mimics for 36 h and were subsequently treated with MG132 (25 μM) for 4 h. The protein levels of p53 were determined by Western blotting. (D) GES1 cells were transfected with NC or BART5-3p mimics for 12 h and were subsequently treated with Nutlin3a (10 μM) for 24 h. The protein levels of p53 were determined by Western blotting. (E) HEK293 cells were cotransfected with NC (or BART5-3p) mimics and TP53 3′-UTR or TP53 CDS dual-luciferase reporter plasmid for 48 h before the luciferase reporter assay was performed. The data are shown as the relative firefly luciferase activity normalized to the value of Renilla luciferase. (F) Bioinformatics predictions of two binding sites by BART5-3p in the TP53 3′-UTR region. Wild-type (WT1 and WT2) and mutant (MUT1 and MUT2) sequences are indicated. (G) HEK293 cells were cotransfected with NC (or BART5-3p) mimics and TP53 3′-UTR WT (or MUT) dual-luciferase reporter plasmid for 48 h before the luciferase reporter assay was performed. The data are shown as the relative firefly luciferase activity normalized to the value of Renilla luciferase. (H) SGC7901 cells were transfected with NC or BART5-3p mimics for 36 h, and cell lysates were immunoprecipitated using either a normal rabbit IgG or anti-AGO2 antibody, and the mRNA level of TP53 binding to AGO2 was determined by qPCR. Immunoprecipitation (IP) with anti-IgG antibody was used as a negative control. Both mean luciferase activity and the mean TP53 expression were calculated from 3 independent experiments, and data are shown as the means ± SEM. NS, not significant; *, P < 0.05; **, P < 0.01 compared with the control group (NC).
FIG 6
FIG 6
BART5-3p promotes tumor growth in the nude mice xenograft model. (A) Tumor growth curves of SGC7901 xenografts in nude mice (n = 6 each). Group 1, 2, and 3 mice were injected with LV-mock, LV-BART5-3p, and LV-BART5-3p cells, respectively (see Materials and Methods for details). The arrow indicates the first administration of BART5-3p antagomir in group 3 mice. (B, C) Xenograft tumors collected on day 30 following subcutaneous implantation. (D) The representatives of immunohistochemistry staining for p21 in tumors from xenograft nude mice. Original magnification, ×200; bar, 50 μm.
FIG 7
FIG 7
BART5-3p expression in EBVaGC clinical specimens. (A) Representative images of EBER staining by means of in situ hybridization. Shown are EBER-negative (left) and EBER-positive (right) gastric cancer specimens. (B) The transcriptional levels of BART5-3p in specimens from 20 cases of EBVaGC (numbered 1 to 20) and 4 cases of non-EBVaGC (numbered 21 to 24) were determined by stem-loop RT-qPCR. The expression values of case number 1 are set as 1 for BART5-3p. U6 was used for normalizing the expression of BART5-3p.

Similar articles

Cited by

References

    1. Young LS, Rickinson AB. 2004. Epstein-Barr virus: 40 years on. Nat Rev Cancer 4:757–768. doi:10.1038/nrc1452. - DOI - PubMed
    1. Gruhne B, Kamranvar SA, Masucci MG, Sompallae R. 2009. EBV and genomic instability—a new look at the role of the virus in the pathogenesis of Burkitt's lymphoma. Semin Cancer Biol 19:394–400. doi:10.1016/j.semcancer.2009.07.005. - DOI - PubMed
    1. Portis T, Dyck P, Longnecker R. 2003. Epstein-Barr virus (EBV) LMP2A induces alterations in gene transcription similar to those observed in Reed-Sternberg cells of Hodgkin lymphoma. Blood 102:4166–4178. doi:10.1182/blood-2003-04-1018. - DOI - PubMed
    1. Huang WT, Lin CW. 2014. EBV-encoded miR-BART20-5p and miR-BART8 inhibit the IFN-gamma-STAT1 pathway associated with disease progression in nasal NK-cell lymphoma. Am J Pathol 184:1185–1197. doi:10.1016/j.ajpath.2013.12.024. - DOI - PubMed
    1. Tsai SC, Lin SJ, Chen PW, Luo WY, Yeh TH, Wang HW, Chen CJ, Tsai CH. 2009. EBV Zta protein induces the expression of interleukin-13, promoting the proliferation of EBV-infected B cells and lymphoblastoid cell lines. Blood 114:109–118. doi:10.1182/blood-2008-12-193375. - DOI - PMC - PubMed

Publication types

MeSH terms