. 2018 Sep 25;115(39):E9115-E9124.
doi: 10.1073/pnas.1812196115. Epub 2018 Sep 12.

LRRK2 and its substrate Rab GTPases are sequentially targeted onto stressed lysosomes and maintain their homeostasis

Affiliations

LRRK2 and its substrate Rab GTPases are sequentially targeted onto stressed lysosomes and maintain their homeostasis

Tomoya Eguchi et al. Proc Natl Acad Sci U S A. .

Abstract

Leucine-rich repeat kinase 2 (LRRK2) has been associated with a variety of human diseases, including Parkinson's disease and Crohn's disease, whereas LRRK2 deficiency leads to accumulation of abnormal lysosomes in aged animals. However, the cellular roles and mechanisms of LRRK2-mediated lysosomal regulation have remained elusive. Here, we reveal a mechanism of stress-induced lysosomal response by LRRK2 and its target Rab GTPases. Lysosomal overload stress induced the recruitment of endogenous LRRK2 onto lysosomal membranes and activated LRRK2. An upstream adaptor Rab7L1 (Rab29) promoted the lysosomal recruitment of LRRK2. Subsequent family-wide screening of Rab GTPases that may act downstream of LRRK2 translocation revealed that Rab8a and Rab10 were specifically accumulated on overloaded lysosomes dependent on their phosphorylation by LRRK2. Rab7L1-mediated lysosomal targeting of LRRK2 attenuated the stress-induced lysosomal enlargement and promoted lysosomal secretion, whereas Rab8 stabilized by LRRK2 on stressed lysosomes suppressed lysosomal enlargement and Rab10 promoted lysosomal secretion, respectively. These effects were mediated by the recruitment of Rab8/10 effectors EHBP1 and EHBP1L1. LRRK2 deficiency augmented the chloroquine-induced lysosomal vacuolation of renal tubules in vivo. These results implicate the stress-responsive machinery composed of Rab7L1, LRRK2, phosphorylated Rab8/10, and their downstream effectors in the maintenance of lysosomal homeostasis.

Keywords: LRRK2; Rab GTPase; lysosome; phosphorylation.


Conflict of interest statement

The authors declare no conflict of interest.

Figures

Fig. 1.
Fig. 1.
LRRK2 is recruited onto the enlarged lysosomes. Immunocytochemical analysis of subcellular localization of LRRK2 using an anti-LRRK2 antibody MJFF2 (A and B, green) or an anti-FLAG antibody (C and D, green) is shown. Lysosomes were stained with an anti-LAMP1 antibody (red), and nuclei were stained with DRAQ5 (blue). RAW264.7 cells without (A) or with (B) CQ treatment (50 μM, 3 h) are shown. The 3× FLAG-LRRK2-stable HEK293 cells without (C) or with (D) CQ treatment (50 μM, 24 h) are shown. Arrows represent LRRK2-positive enlarged lysosomes. (Scale bars: AD, 10 μm.) (E) Percentages of RAW264.7 cells harboring LRRK2-positive lysosomes and the size of lysosomes were analyzed. Data represent mean ± SEM [n = 3, 91–148 cells were analyzed in each experiment (percentage of cells with LRRK2-positive lysosomes)]; mean ± SD [n = 20 cells (size of lysosomes)]. (F) Representative photographs at each time point analyzed in E. Green, LRRK2; red, LAMP1; blue, DRAQ5; asterisks, the enlarged lysosomes; arrows, LRRK2-positive lysosomes. (Scale bars: 10 μm.) (G) IEM analysis of the enlarged lysosomes using ultrathin cryosections of the CQ-treated bone marrow-derived macrophages isolated from FLAG-LRRK2 BAC transgenic mice. The 12-nm gold particles indicate FLAG-LRRK2 (arrows) and the 6-nm gold particles indicate LAMP1. Ly, enlarged lysosome. Arrowheads indicate normal lysosomes. A higher magnification (Right) of the boxed area (Left) is shown. (Scale bars: Right, 100 nm; Left, 500 nm). (H) The levels of LRRK2 and control proteins in the lysosomal fraction analyzed by immunoblotting. Lysosomes were magnetically isolated from HEK293 cells expressing 3× FLAG-LRRK2 with or without CQ treatment. LC3-II induction was examined to validate the effectiveness of CQ. (I) Levels of LRRK2 in the lysosomal fraction analyzed in H. The LRRK2 levels were normalized by the levels of LAMP2. Data represent mean ± SD (n = 3). **P < 0.01, t test.
Fig. 2.
Fig. 2.
Lysosomal overload induces translocation and activation of LRRK2. (AE) Lysosomal localization of LRRK2 was analyzed in RAW264.7 cells treated with the indicated reagents for 3 h. Vehicle (A), CQ (B, 50 μM), BafA1 (C, 100 nM), vacuolin-1 (D, 500 nM), and CQ plus BafA1 (E, 50 μM and 100 nM, respectively) are shown. (Scale bars: AE, 10 μm.) (F) Percentages of cells harboring LRRK2-positive lysosomes exposed to each indicated reagent as shown in AE. Data represent mean ± SEM (n = 3, 171–390 cells were analyzed in each experiment). ****P < 0.0001, one-way ANOVA with Tukey’s test. (G) Lysosomal localization of LRRK2 in RAW264.7 cells treated with BafA1 (100 nM) for 12 h. Arrows indicate LRRK2-positive lysosomes. (Scale bars: 10 μm.) (H) Percentages of cells harboring LRRK2-positive lysosomes analyzed at 0, 3, 6, or 12 h of BafA1 exposure. Mean ± SEM (n = 4, 112–454 cells were analyzed at each time point). **P < 0.01, ****P < 0.0001; t test compared with t = 0 h. (I) Localization of endogenous LRRK2 on phagolysosomes in RAW264.7 cells fed with zymosan for 1 h. Arrows represent LRRK2-positive phagolysosomes, and asterisks represent phagolysosomes containing zymosan. (Scale bar: 10 μm.) (J) Levels of phosphorylated Rab10 in RAW264.7 cells analyzed by Phos-tag SDS/PAGE using an anti-Rab10 antibody or by standard SDS/PAGE using an anti–phospho-Rab10 (pThr73) antibody. Asterisks represent nonspecific bands. Densitometric analysis of the levels of phosphorylated Rab10, as shown in J, analyzed by Phos-tag SDS/PAGE using anti-Rab10 antibody (K) or by standard SDS/PAGE using anti–phospho-Rab10 (pThr73) antibody (L) are shown. **P < 0.01, ***P < 0.001, ****P < 0.0001, one-way ANOVA with Tukey’s test.
Fig. 3.
Fig. 3.
Rab7L1 recruits LRRK2 onto the enlarged lysosomes. (A) Immunocytochemical analysis of the localization of EGFP-Rab7L1 in HEK293 cells with or without CQ treatment (50 μM, 18 h). (Scale bars: 10 μm.) (B) Immunocytochemical analysis of HEK293 cells coexpressing EGFP-Rab7L1 and 3× FLAG-LRRK2 with or without CQ treatment (50 μM, 18 h). Arrows indicate Rab7L1-LRRK2 double-positive lysosomes. (Scale bars: 10 μm.) (C) Percentage of cells harboring LRRK2-positive lysosomes, as shown in B, was statistically analyzed in LRRK2-expressing HEK293 cells coexpressing EGFP or EGFP-Rab7L1, with CQ treatment (n = 86 and n = 113 cells, respectively). ****P < 0.0001, Fisher’s exact test. (D) Levels of Rab7L1, LRRK2, and control proteins in the lysosomal fraction analyzed by immunoblotting. Lysosomes were isolated from HEK293 cells that expressed 3× FLAG-LRRK2 and GFP-Rab7L1 with or without CQ treatment (50 μM, 24 h). (E) Lysosomal localization of LRRK2 in RAW264.7 cells treated with Rab7L1 siRNA and CQ (50 μM, 3 h). (Scale bars: 10 μm.) (F) Percentage of cells harboring endogenous LRRK2-positive lysosomes, as shown in E, analyzed in RAW264.7 cells treated with the indicated siRNA and CQ. Mean ± SEM (n = 3, 444–550 cells were analyzed in each experiment). ***P < 0.001, one-way ANOVA with Tukey’s test. ns, not significant.
Fig. 4.
Fig. 4.
Rab8a and Rab10 were accumulated on enlarged lysosomes through phosphorylation by LRRK2. (A) Immunocytochemical analysis of the localization of endogenous Rab8a in RAW264.7 cells without CQ treatment (Top), with CQ treatment (Middle), or treatment with CQ plus LRRK2 kinase inhibitor GSK2578215A (Bottom) using anti-LRRK2 (N138/6) and anti-Rab8a (ERP14873) antibodies. Arrows indicate LRRK2/Rab double-positive lysosomes, and arrowheads indicate LRRK2-positive, Rab-negative lysosomes. (Scale bars: 10 μm.) (B and C) Percentages of Rab8-positive (B) or LRRK2-positive (C) lysosomes in total enlarged lysosomes analyzed in cells exposed to CQ and LRRK2 inhibitors, as shown in A. Data represent mean ± SEM (n = 3, 93–151 lysosomes were analyzed in each experiment). ***P < 0.001, one-way ANOVA with Tukey’s test. ns, not significant. (D) Percentages of Rab8-positive lysosomes that comprise the total LRRK2-positive lysosomes. A total of 37, 21, and 17 LRRK2-positive lysosomes were analyzed in each condition. ****P < 0.0001, Fisher’s exact test. (E and F) Accumulation of Rab8a and Rab10 on enlarged lysosomes in HEK293 cells coexpressing 3× FLAG-LRRK2 (WT) and EGFP-Rab8a (E, WT or T72A) or EGFP-Rab10 (F, WT or T73A) and treated with CQ. Arrows indicate LRRK2/Rab double-positive lysosomes, and arrowheads indicate LRRK2-positive, Rab-negative lysosomes. (Scale bars: 10 μm.) (G and H) GDI-mediated extraction of Rab8a from membranes. Membrane fractions from HEK293 cells overexpressing GFP-Rab8a (WT, phosphomimetic mutants) were incubated with purified GDI1 for 30 min, and ultracentrifuged; Rab8a in supernatant (“extracted”) was analyzed by immunoblotting with an anti-GFP antibody. The amount of Rab8a in the extracted fraction was divided by that of Rab8a in the input membrane fraction and normalized by the value in the Rab8a WT sample. Mean ± SEM (n = 4). *P < 0.05, **P < 0.01, ***P < 0.001; one-way ANOVA with Tukey’s test.
Fig. 5.
Fig. 5.
LRRK2 and Rab7L1 regulate lysosomal morphology and lysosomal release upon CQ exposure. (A) Lysosomal morphology in RAW264.7 cells treated with LRRK2 siRNA and CQ (50 μM, 3 h). Cells were stained for LAMP1 (red) and nuclei (DRAQ5, blue). The largest lysosome in each cell was surrounded by a broken line. (Scale bars: 10 μm.) (B) Size of the largest lysosome in each cell, as examined in A. Mean ± SD (n = 68 and n = 69 for nontarget and LRRK2 RNAi, respectively). ***P < 0.001, t test. (C) Lysosomal morphology in cells treated with CQ in the presence of LRRK2 kinase inhibitors or DMSO. Red, LAMP1; blue, DRAQ5. (Scale bars: 10 μm.) (D) Size of the largest lysosome in each cell, as examined in C. Mean ± SD (n = 96, n = 78, and n = 102 for DMSO, GSK, and PF, respectively). ***P < 0.001, ****P < 0.0001; one-way ANOVA with Tukey’s test. (E) Lysosomal morphology in HEK293 cells transfected with LRRK2 and treated with CQ (50 μM, 24 h). Red, LAMP1; green, LRRK2; blue, DRAQ5. (Scale bars: 10 μm.) (F) Size of the largest lysosome in each cell, as examined in E. Mean ± SD (178–211 cells in each condition). *P < 0.05, ****P < 0.0001; one-way ANOVA with Tukey’s test. (G) Immunoblot analysis of the levels of cathepsin D (Cat D) species in media of RAW264.7 cells treated with LRRK2 inhibitors (GSK, PF) and/or CQ. (H) Densitometric analysis of the levels of intermediate active Cat D in media, as shown in G. Mean ± SD (n = 4). **P < 0.01, ***P < 0.001; one-way ANOVA with Tukey’s test. (I) Lysosomal morphology in cells treated with Rab7L1 siRNA and CQ. Red, LAMP1; blue, DRAQ5. (Scale bars: 10 μm.) (J) Size of the largest lysosome in each cell, as examined in I. Mean ± SEM (n = 4, 105–163 cells in each experiment). **P < 0.01, t test. (K) Immunoblot analysis of the levels of Cat D in media of cells treated with nontarget or Rab7L1 siRNA and CQ. (L and M) Densitometric analysis of the levels of intermediate active (L) and mature (M) Cat D in media, as shown in K. Mean ± SD (n = 4). ****P < 0.0001, one-way ANOVA with Tukey’s test.
Fig. 6.
Fig. 6.
Rab8, Rab10, and their effectors regulate lysosomal morphology and lysosomal release upon CQ exposure. (A and B) Lysosomal enlargement in RAW264.7 cells treated with siRNA against nontarget, LRRK2, Rab8a, Rab8b, or Rab10 and CQ (100 μM, 3 h). Red, LAMP1; blue, DRAQ5. (Scale bars: 10 μm.) Statistical analysis of the average size of the largest lysosomes in each cell is shown in B. Mean ± SEM (n = 3, 107–167 cells were analyzed in each experiment). **P < 0.01, ***P < 0.001, ****P < 0.0001; one-way ANOVA with Tukey’s test. ns, not significant. (C and D) Lysosomal enlargement in HEK293 cells coexpressing 3× FLAG-LRRK2 and Rab8a (WT, T72A) or Rab10 (WT, T73A) treated with CQ (50 μM, 24 h). (Scale bars: 10 μm.) Statistical analysis of the average size of the largest lysosomes in each cell is shown in D. Mean ± SEM (n = 5, 109–140 cells were analyzed in each experiment). **P < 0.01, one-way ANOVA with Tukey’s test. (E) Immunoblot analysis of the levels of cathepsin D (Cat D) species in media of RAW264.7 cells treated with the indicated siRNA and CQ (100 μM, 3 h). (F and G) Densitometric analysis of the levels of intermediate active (F) or mature (G) Cat D in media, as shown in E. Mean ± SD (n = 3). *P < 0.05, **P < 0.01; one-way ANOVA with Tukey’s test. (H and I) Lysosomal enlargement in RAW264.7 cells treated with siRNA against EHBP1, EHBP1L1, or both and CQ (100 μM, 3 h). Doubly treated representative cells are shown in H. Red, LAMP1; blue, DRAQ5. (Scale bars: 10 μm.) Average size of the largest lysosomes in each cell is shown in I. Mean ± SEM (n = 3, 75–142 cells in each experiment). *P < 0.05, **P < 0.01; one-way ANOVA with Tukey’s test. (J) Immunoblot analysis of the levels of Cat D species in media of RAW264.7 cells treated with siRNA against EHBP1, EHBP1L1, or both and CQ (100 μM, 3 h). (K) Densitometric analysis of the levels of intermediate active Cat D in media as shown in J. Mean ± SEM (n = 4). **P < 0.01, ****P < 0.0001; one-way ANOVA with Tukey’s test. (L) Localization of endogenous EHBP1L1 in RAW264.7 cells treated without CQ (Top) or with CQ (Bottom). Arrows indicate EHBP1L1 on Rab8-positive enlarged lysosomes. (Scale bars: 10 μm.)
Fig. 7.
Fig. 7.
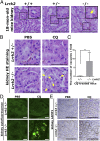
LRRK2 deficiency confers vulnerability to lysosomal stress on renal tubular cells in vivo. (A) Hematoxylin and eosin (HE) staining of renal proximal tubules from 18-mo-old Lrrk2 KO mice and control mice. (Insets, Top Right) Magnified images of the boxed areas. The arrow indicates the vacuoles formed in Lrrk2−/− mice. (Scale bars: 100 μm; Insets, 10 μm.) (B) HE staining of renal proximal tubules from 8-wk-old mice injected i.p. with CQ for 2 wk. Arrows indicate the vacuoles formed in Lrrk2−/− mice administered CQ. (Scale bars: 50 μm.) (C) Quantification of the number of vacuoles in HE-stained renal proximal tubules of CQ-treated mice, as shown in B. Data represent mean ± SD (n = 5). **P < 0.01, t test. (D) Autofluorescence in renal proximal tubules. Arrows indicate the autofluorescence in Lrrk2−/− mice administered CQ. (Scale bars: 10 μm.) (E) Immunostaining of renal proximal tubules from CQ-administered mice with an anti-LAMP1 antibody. (Scale bars: 100 μm.)
Fig. 8.
Fig. 8.
Proposed model for the lysosomal stress response involving Rab7L1, LRRK2, and Rab8/10. (A) Maintenance of lysosomal homeostasis by LRRK2 and Rab GTPases. Within cells exposed to lysosomal overload stress, Rab7L1 is translocated from the Golgi to lysosomal membranes and recruits LRRK2 onto the stressed lysosomes. Translocated LRRK2 then stabilizes its substrates Rab8 and Rab10 on lysosomes depending on their phosphorylation. These Rab GTPases promote the release of lysosomal contents and suppress lysosomal enlargement through their effectors, EHBP1 and EHBP1L1. (B) Possible mechanism of Rab8/10 accumulation on lysosomal membranes. Rab8/10 is recruited onto lysosomal membranes and phosphorylated by LRRK2. The phosphorylated Rab8/10 remains resistant to the extraction from membranes by GDI, resulting in the accumulation on lysosomes. The accumulated Rab8/10 is then activated by GEFs and recruits their effectors.

Similar articles

Cited by

References

    1. Paisán-Ruíz C, et al. Cloning of the gene containing mutations that cause PARK8-linked Parkinson’s disease. Neuron. 2004;44:595–600. - PubMed
    1. Zimprich A, et al. Mutations in LRRK2 cause autosomal-dominant parkinsonism with pleomorphic pathology. Neuron. 2004;44:601–607. - PubMed
    1. Lill CM, et al. 23andMe Genetic Epidemiology of Parkinson’s Disease Consortium; International Parkinson’s Disease Genomics Consortium; Parkinson’s Disease GWAS Consortium; Wellcome Trust Case Control Consortium 2) Comprehensive research synopsis and systematic meta-analyses in Parkinson’s disease genetics: The PDGene database. PLoS Genet. 2012;8:e1002548. - PMC - PubMed
    1. Barrett JC, et al. NIDDK IBD Genetics Consortium; Belgian-French IBD Consortium; Wellcome Trust Case Control Consortium Genome-wide association defines more than 30 distinct susceptibility loci for Crohn’s disease. Nat Genet. 2008;40:955–962. - PMC - PubMed
    1. Zhang FR, et al. Genomewide association study of leprosy. N Engl J Med. 2009;361:2609–2618. - PubMed

Publication types

Substances