

Increased Phosphaturia Accelerates The Decline in Renal Function: A Search for Mechanisms
- PMID: 30209259
- PMCID: PMC6135842
- DOI: 10.1038/s41598-018-32065-2
Increased Phosphaturia Accelerates The Decline in Renal Function: A Search for Mechanisms
Abstract
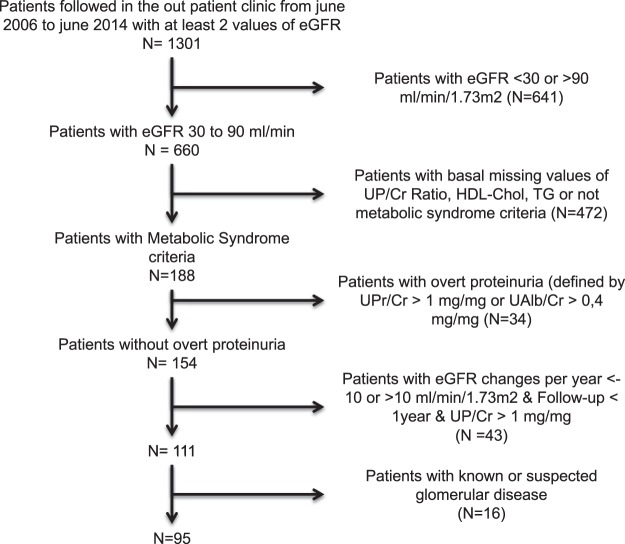
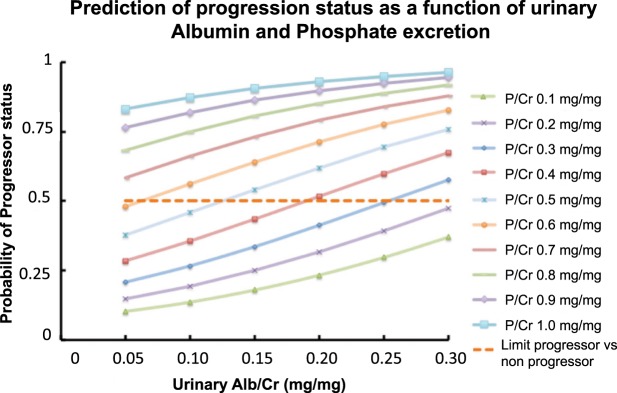
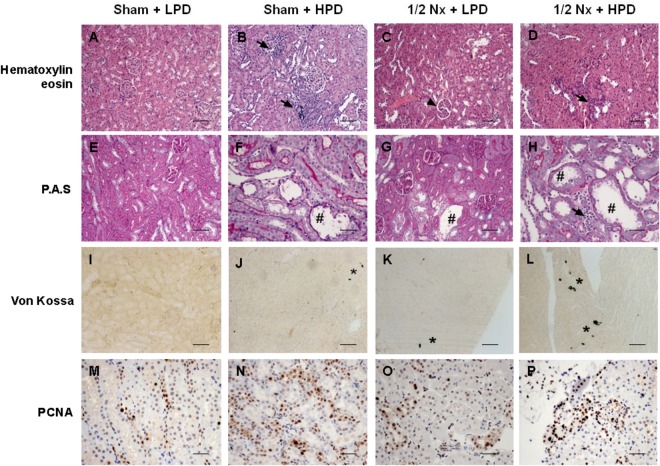
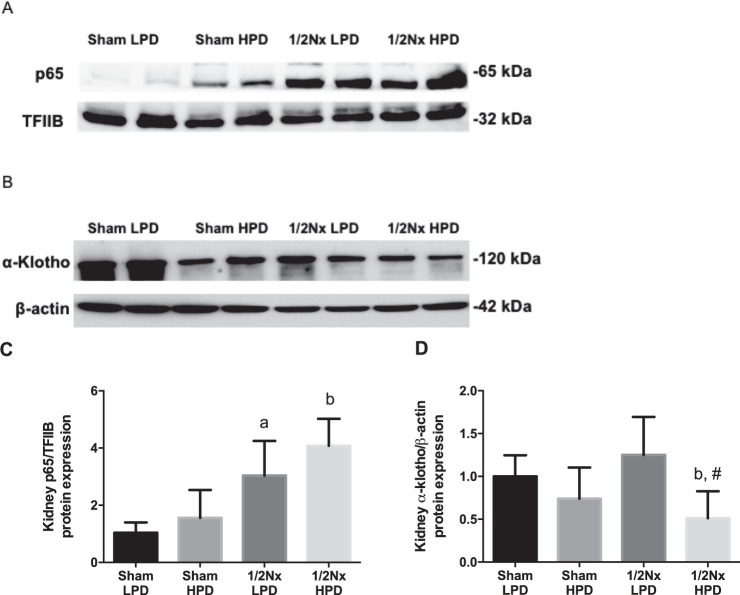
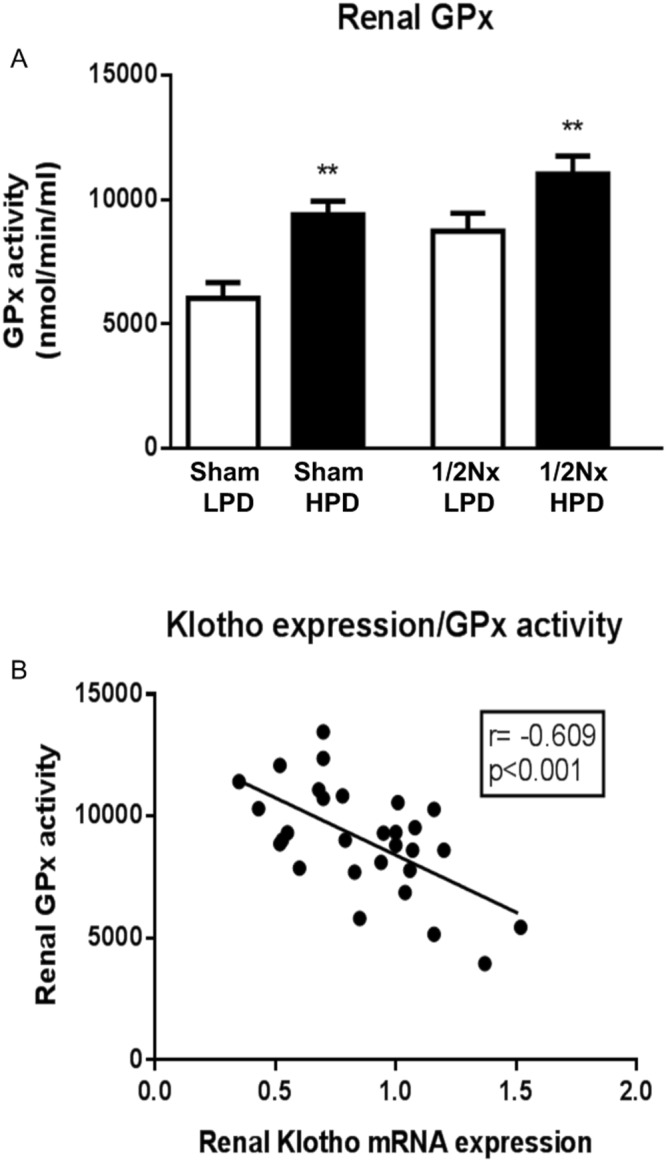
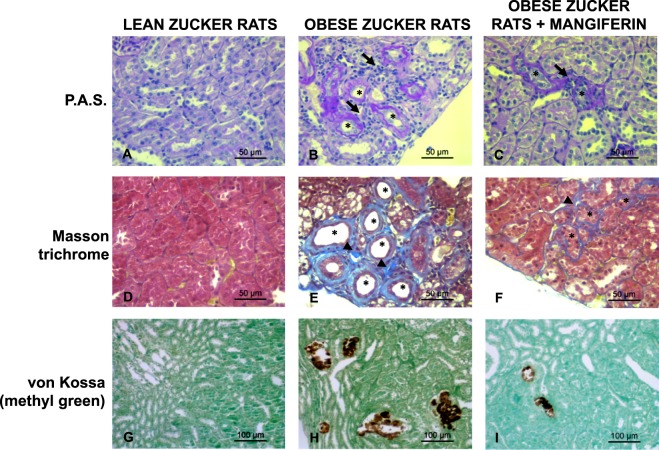
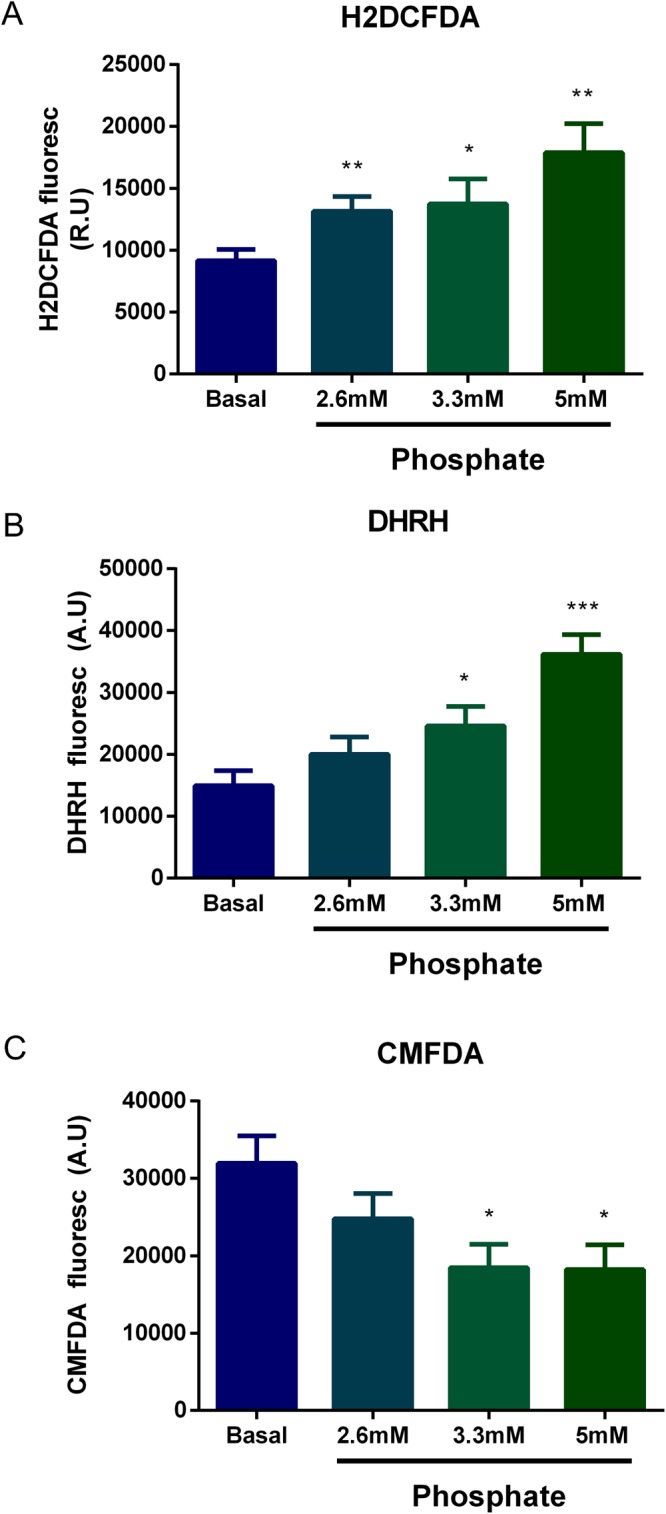
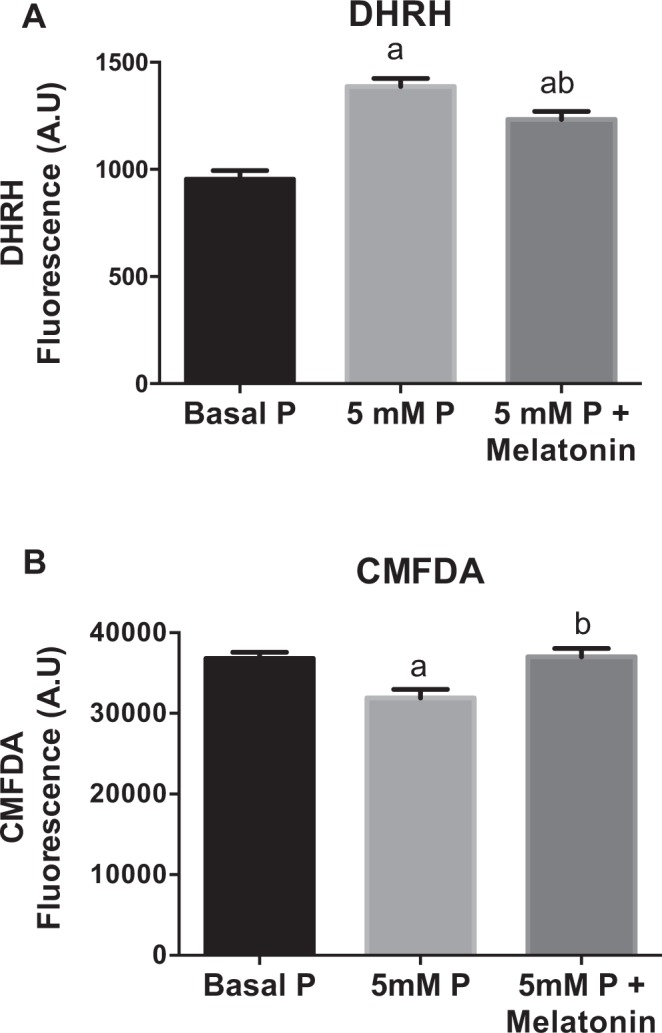
In chronic kidney disease (CKD), high serum phosphate concentration is associated with cardiovascular disease and deterioration in renal function. In early CKD, the serum phosphate concentration is normal due to increased fractional excretion of phosphate. Our premise was that high phosphate intake even in patients with early CKD would result in an excessive load of phosphate causing tubular injury and accelerating renal function deterioration. In CKD 2-3 patients, we evaluated whether increased phosphaturia accelerates CKD progression. To have a uniform group of patients with early CKD, 95 patients with metabolic syndrome without overt proteinuria were followed for 2.7 ± 1.6 years. The median decline in eGFR was 0.50 ml/min/1.73 m2/year. Patients with a more rapid decrease in eGFR had greater phosphaturia. Moreover, the rate of decrease in eGFR inversely correlated with the degree of phosphaturia. Additionally, phosphaturia independently predicted renal function deterioration. In heminephrectomized rats, a high phosphate diet increased phosphaturia resulting in renal tubular damage associated with inflammation, oxidative stress and low klotho expression. Moreover, in rats with hyperphosphatemia and metabolic syndrome antioxidant treatment resulted in attenuation of renal lesions. In HEK-293 cells, high phosphate promoted oxidative stress while melatonin administration reduced ROS generation. Our findings suggest that phosphate loading in early CKD, results in renal damage and a more rapid decrease in renal function due to renal tubular injury.
Conflict of interest statement
The authors declare no competing interests.
Figures
Similar articles
-
Dietary phosphate restriction suppresses phosphaturia but does not prevent FGF23 elevation in a mouse model of chronic kidney disease.Kidney Int. 2013 Oct;84(4):713-21. doi: 10.1038/ki.2013.194. Epub 2013 May 22. Kidney Int. 2013. PMID: 23698235 Free PMC article.
-
Effects of Highly Active Antiretroviral Therapy on Renal Function and Renal Phosphate Handling in African Adults with Advanced HIV and CKD.Infect Disord Drug Targets. 2019;19(1):88-100. doi: 10.2174/1871526518666180720115240. Infect Disord Drug Targets. 2019. PMID: 30027856
-
Albumin downregulates Klotho in tubular cells.Nephrol Dial Transplant. 2018 Oct 1;33(10):1712-1722. doi: 10.1093/ndt/gfx376. Nephrol Dial Transplant. 2018. PMID: 29425318
-
Derangements in phosphate metabolism in chronic kidney diseases/endstage renal disease: therapeutic considerations.Adv Chronic Kidney Dis. 2011 Mar;18(2):120-31. doi: 10.1053/j.ackd.2011.02.004. Adv Chronic Kidney Dis. 2011. PMID: 21406297 Review.
-
Phosphate is a vascular toxin.Pediatr Nephrol. 2013 Apr;28(4):583-93. doi: 10.1007/s00467-012-2347-x. Epub 2012 Nov 17. Pediatr Nephrol. 2013. PMID: 23161206 Review.
Cited by
-
Structural and ultrastructural renal lesions in rats fed high-fat and high-phosphorus diets.Clin Kidney J. 2020 Feb 18;14(3):847-854. doi: 10.1093/ckj/sfaa009. eCollection 2021 Mar. Clin Kidney J. 2020. PMID: 33777367 Free PMC article.
-
Fractional Excretion of Phosphate (FeP) Is Associated with End-Stage Renal Disease Patients with CKD 3b and 5.J Clin Med. 2019 Jul 12;8(7):1026. doi: 10.3390/jcm8071026. J Clin Med. 2019. PMID: 31336909 Free PMC article.
-
Melatonin Alleviates Oxidative Stress Induced by H2O2 in Porcine Trophectoderm Cells.Antioxidants (Basel). 2022 May 25;11(6):1047. doi: 10.3390/antiox11061047. Antioxidants (Basel). 2022. PMID: 35739944 Free PMC article.
-
The true cost of phosphate control in chronic kidney disease.Clin Kidney J. 2025 Mar 13;18(Suppl 1):i46-i60. doi: 10.1093/ckj/sfae434. eCollection 2025 Mar. Clin Kidney J. 2025. PMID: 40083951 Free PMC article.
-
Chronic Kidney Disease-associated Lung Injury Is Mediated by Phosphate-induced MAPK/AKT Signaling.Am J Respir Cell Mol Biol. 2024 Dec;71(6):659-676. doi: 10.1165/rcmb.2024-0008OC. Am J Respir Cell Mol Biol. 2024. PMID: 39088759 Free PMC article.
References
-
- Kidney Disease: Improving Global Outcomes (KDIGO) CKD-MBD Work Group. KDIGO clinical practice guideline for the diagnosis, evaluation, prevention, and treatment of Chronic Kidney Disease-Mineral and Bone Disorder (CKD-MBD). Kidney Int. Suppl. S1-130 10.1038/ki.2009.188 (2009). - PubMed
Publication types
MeSH terms
Substances
LinkOut - more resources
Full Text Sources
Other Literature Sources
Research Materials
Miscellaneous
