. 2018 Sep 12;9(1):3695.
doi: 10.1038/s41467-018-06151-y.

Augmentation of vaccine-induced humoral and cellular immunity by a physical radiofrequency adjuvant

Affiliations

Augmentation of vaccine-induced humoral and cellular immunity by a physical radiofrequency adjuvant

Yan Cao et al. Nat Commun. .

Abstract

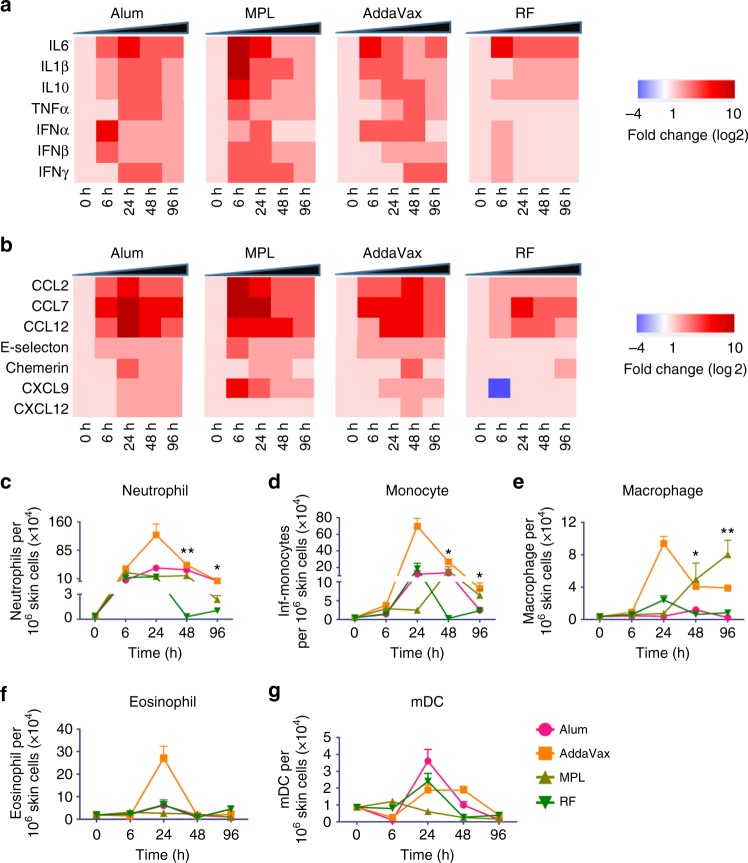
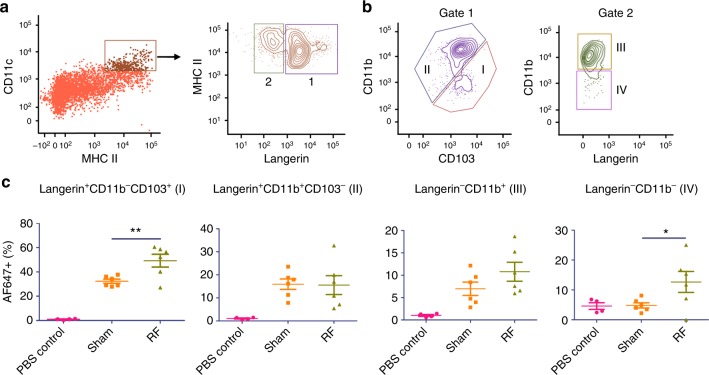
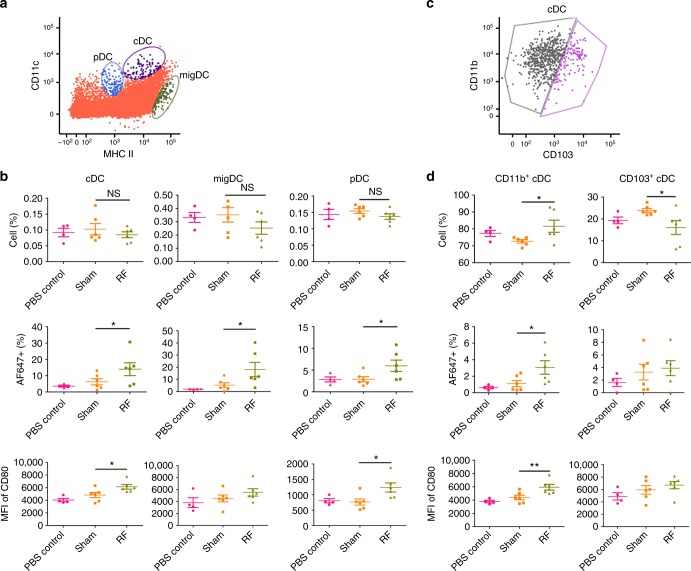
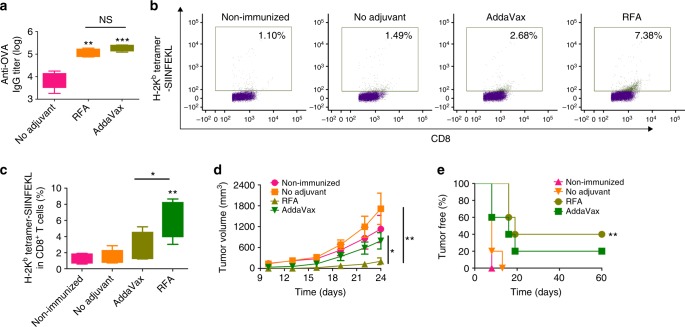
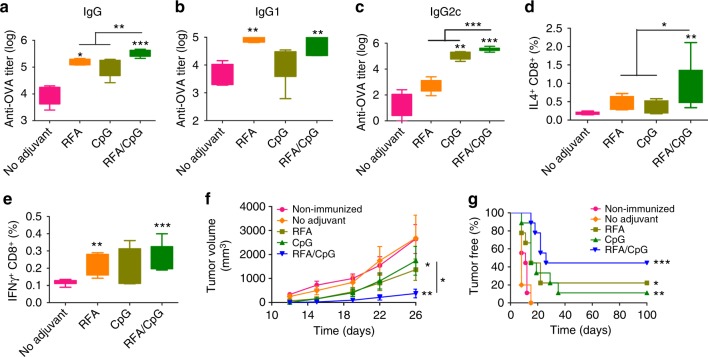
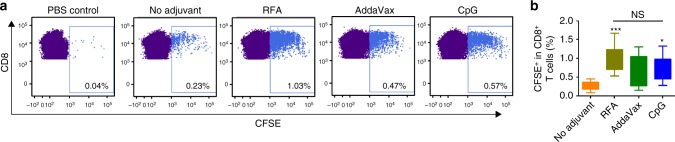
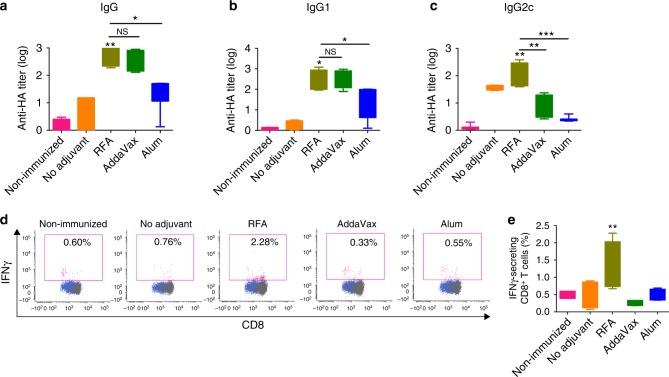
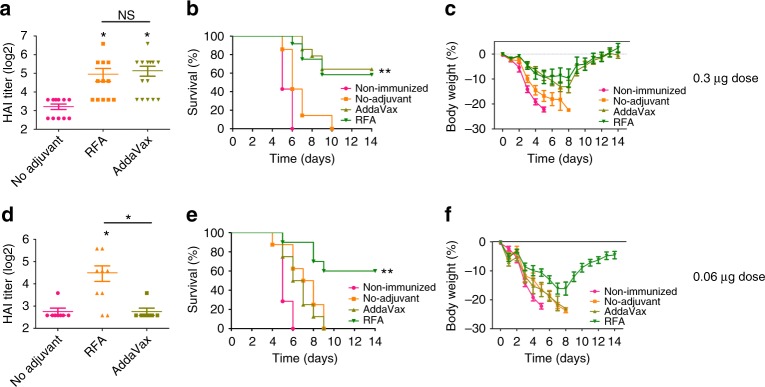
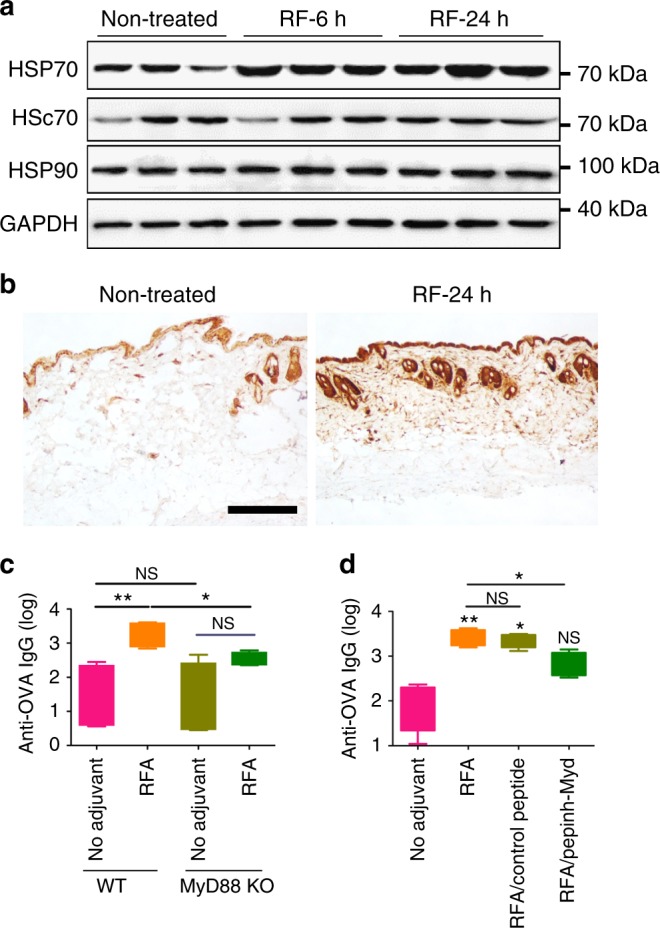
Protein/subunit vaccines often require external adjuvants to induce protective immunity. Due to the safety concern of chemical adjuvants, physical adjuvants were recently explored to boost vaccination. Physical adjuvants use physical energies rather than chemicals to stimulate tissue stress and endogenous danger signal release to boost vaccination. Here we present the safety and potency of non-invasive radiofrequency treatment to boost intradermal vaccination in murine models. We show non-invasive radiofrequency can increase protein antigen-induced humoral and cellular immune responses with adjuvant effects comparable to widely used chemical adjuvants. Radiofrequency adjuvant can also safely boost pandemic 2009 H1N1 influenza vaccination with adjuvant effects comparable to MF59-like AddaVax adjuvant. We find radiofrequency adjuvant induces heat shock protein 70 (HSP70) release and activates MyD88 to mediate the adjuvant effects. Physical radiofrequency can potentially be a safe and potent adjuvant to augment protein/subunit vaccine-induced humoral and cellular immune responses.


Conflict of interest statement

The authors declare no competing interests.

Figures

Fig. 1
Fig. 1
RF induces low-level local inflammation. Dorsal skin of C57BL/6 mice were exposed to RF or intradermally injected with 20 µl Alum (1:1 volume ratio in PBS), AddaVax (50%, vol/vol in PBS), or MPL (25 µg). Adjuvant-treated and non-treated skins were dissected at indicated times. a, b Heat map of relative cytokine (a) and chemokine (b) gene expression. Total RNA was extracted followed by reverse transcription and real-time PCR analysis of cytokine and chemokine gene expression using GAPDH as an internal control. The baseline gene expression level was set at 1. cg Different innate immune cell levels in RF and adjuvant-treated skin. Skin was digested in collagenase D and dispase to prepare single-cell suspensions. Cells were then stained with fluorescence-conjugated antibodies followed by flow cytometry analysis of levels of different cell types: neutrophils (c), monocytes (d), macrophages (e), eosinophils (f), and mDCs (g) (Supplementary Fig. 2). n = 4. Student’s t-test was used to compare differences between groups at 48 and 96 h. *, p < 0.05; **, p < 0.01
Fig. 2
Fig. 2
RF increases antigen uptake of DCs in skin. Lateral back skin of C57BL/6 mice was exposed to RF or sham treatment followed by ID injection of 2 µg AF647-OVA into RF or sham-treated skin. ID injection of PBS served as control. Skin was harvested 24 h later and digested in collagenase D and dispase to prepare single-cell suspensions. Skin cells were then stained with fluorescence-conjugated antibodies followed by flow cytometry analysis. a Live cells were gated and plotted based on CD11c and MHC II expression. CD11c+MHC II+ cells were gated and plotted based on Langerin expression. b Langerin+ cells (gate 1) were plotted based on CD11b and CD103 expression into Langerin+CD11bCD103+ (I) and Langerin+CD11b+CD103 subsets (II), whereas Langerin cells (gate 2) were plotted based on CD11b expression into LangerinCD11b+ (III) and LangerinCD11b subsets (IV). c Percentage of AF647+ cells was analyzed for each DC subset. n = 4 for PBS control and 6 for sham and RF groups. Student’s t-test was used to compare differences between RF and sham groups. *p < 0.05; **p < 0.01. Representative of two independent experiments
Fig. 3
Fig. 3
RF increases antigen uptake and maturation of DCs in dLNs. DLNs were collected at the same time when skin was collected in Fig. 2 and then passed through cell strainers to prepare single-cell suspensions. Cells were then stained with fluorescence-conjugated antibodies and subjected to flow cytometry analysis. a Live cells were first gated and then plotted based on CD11c and MHC II expression. cDC, migDC, and pDC were gated as MHC IIintCD11chi, MHC IIhiCD11cint, and MHC IIlowCD11clow, respectively. b Percentage of cDC, migDC, and pDC was shown in upper panels. Percentage of AF647+ cells in cDC, migDC, and pDC was shown in middle panels. MFI of CD80 in cDC, migDC, and pDC was shown in lower panels. c cDC were further gated into CD11b+ and CD103+ subsets based on CD11b and CD103 expression. d Percentage of CD11b+ and CD103+ cDC as well as percentage of AF647+ cells and MFI of CD80 in CD11b+ and CD103+ cDC were shown in upper, middle, and lower panels, respectively. n = 4 for PBS control and 6 for sham and RF groups. Student’s t-test was used to compare differences between RF and sham groups. *p < 0.05; **p < 0.01. Representative of two independent experiments
Fig. 4
Fig. 4
Comparison of RFA with AddaVax to boost ID OVA-induced humoral and cellular immune responses. C57BL/6 mice were intradermally immunized with 10 µg OVA alone or in the presence of RFA, or intramuscularly immunized with 10 µg OVA in the presence of AddaVax. Immunization was repeated 2 weeks later. a Serum anti-OVA antibody titer was measured 2 weeks after boost. b, c PBMCs were isolated one week after boost, stimulated with OVA followed by staining with fluorescence-conjugated anti-CD4, anti-CD8 antibodies, and H-2Kb-restricted OVA257–264 tetramer. Frequency of tetramer+ CD8+ T cells was analyzed by flow cytometry. Cells were first gated based on CD4 and CD8 expression and CD8+CD4 cells were further analyzed based on tetramer staining. Representative dot plots were shown in b and percentage of tetramer+CD8+ T cells were shown in c. d, e Two weeks after boost, mice were challenged with 5 × 105 E.G7-OVA cells. Tumor growth (d) and percentage of tumor-free mice (e) were monitored for total 60 days. n = 5. One-way ANOVA with Tukey’s multiple comparison test was used to compare differences between groups in a and c. Two-way ANOVA with Bonferroni post test was used to compare tumor growth in d. Log-rank test with Bonferroni correction was used to compare differences between adjuvant (RFA or AddaVax) and no adjuvant groups in e. *p < 0.05; **p < 0.01; ***p < 0.001. NS not significant. Representative of two independent experiments
Fig. 5
Fig. 5
Comparison of RFA with CpG to boost ID OVA-induced humoral and cellular immune responses. C57BL/6 mice were intradermally immunized with 10 µg OVA alone or in the presence of RFA, CpG, or RFA/CpG. Immunization was repeated 2 weeks later. ac Serum anti-OVA IgG (a), and subtype IgG1 (b), and IgG2c antibody titer (c) were measured 2 weeks after boost. d, e Splenocytes were prepared one week after boost, stimulated with OVA followed by intracellular cytokine staining and flow cytometry analysis. Percentage of IL4 and IFNγ-secreting CD8+ T cells was shown in d and e, respectively. f, g Another set of mice were similarly immunized as above and then subcutaneously challenged with 106 E.G7-OVA cells 2 weeks after boost. Tumor volume (f) and percentage of tumor-free mice (g) were monitored for total 100 days. n = 8–9. One-way ANOVA with Tukey’s multiple comparison test was used to compare differences between groups in ae. Two-way ANOVA with Bonferroni post-test was used to compare differences in f. Log-rank test with Bonferroni correction was used to compare differences between adjuvant (RFA, CpG, or RFA/CpG) and no adjuvant groups in g. *p < 0.05; **p < 0.01; ***p < 0.001. NS not significant. Representative of two independent experiments
Fig. 6
Fig. 6
RFA stimulates significant OT-I T-cell proliferation in vivo. CFSE-stained OT-I T cells were adoptively transferred to syngeneic C57BL/6 mice followed by ID immunization of 10 µg OVA alone or in the presence of RFA, AddaVax, or CpG adjuvant 24 h later. ID injection of PBS served as control. DLNs were harvested 4 days later and analyzed for proliferation of OT-I T cells by flow cytometry. Live cells were gated and then plotted based on CD4 and CD8 expression. CD8+CD4 T cells were analyzed for CFSE levels. a Representative dot plots showing percentage of CFSE+ cells in CD8+ T cells. b Percentage of CFSE+ cells in CD8+ T cells of different groups. n = 8–13. One-way ANOVA with Tukey’s multiple comparison test was used to compare differences between groups. *p < 0.05; ***p < 0.001. NS, not significant. Representative of three independent experiments
Fig. 7
Fig. 7
RFA increases rHA-induced humoral and cellular immune responses. C57BL/6 mice were intradermally immunized with 5 µg rHA alone or in the presence of RFA, or intramuscularly immunized with 5 µg rHA in the presence of AddaVax or Alum. Immunization was repeated 2 weeks later. a–c Serum rHA-specific IgG (a), and subtype IgG1 (b) and IgG2c antibody titer (c) measured 2 weeks after boost. d, e PBMCs were isolated 1 week after boost, stimulated with rHA followed by intracellular cytokine staining and flow cytometry analysis of percentage of IFNγ-secreting CD8+ T cells. Representative dot plots were shown in d and percentage of IFNγ-secreting CD8+ T cells was shown in e. n = 4–6. One-way ANOVA with Tukey’s multiple comparison test was used to compare differences between groups. *p < 0.05; **p < 0.01; ***p < 0.001. NS not significant. Representative of two independent experiments
Fig. 8
Fig. 8
RFA boosts pdm09 vaccination. ac C57BL/6 mice were intradermally immunized with 0.3 µg pdm09 vaccine alone (no adjuvant) or in the presence of RFA (RFA), or intramuscularly immunized with the same vaccine dose in the presence of AddaVax (AddaVax), or intradermally injected with the same volume of PBS (non-immunized). Serum HAI titer was measured 3 weeks later (a). Mice were then intranasally challenged with 10 × LD50 of mouse-adapted pdm09 viruses. Survival and body weight loss were monitored daily for 14 days and shown in b and c, respectively. df C57BL/6 mice were similarly immunized as above at 0.06 µg vaccine dose. HAI titer was measured 3 weeks later (d). Mice were then challenged with 10 × LD50 of mouse-adapted pdm09 viruses. Survival and body weight loss were similarly monitored and shown in e and f, respectively. n = 12–14 in ac and 8–9 in df. One-way ANOVA with Tukey’s multiple comparison test was used to compare differences between groups in a and d. Log-rank test with Bonferroni correction was used to compare differences between adjuvant (RFA, AddaVax) and no adjuvant groups in b and e. *p < 0.05; **p < 0.01. NS not significant. Representative of two independent experiments
Fig. 9
Fig. 9
RFA increases HSP70 levels and activates MyD88. a C57BL/6 mice were exposed to RF and skin HSP70, HSc70, and HSP90 levels were then analyzed by western blotting at 6 and 24 h (hr) using GAPDH as internal control. b Representative IHC images of HSP70 expression in RF-treated and non-treated skin at 24 h. Scale: 250 µm. c WT and MyD88 KO mice were exposed to RF or sham treatment followed by ID injection of 10 µg OVA into RF or sham-treated skin. Serum anti-OVA antibody titer was measured 2 weeks later. n = 4–5. d WT mice were intradermally injected with 100 µg Pepinh-Control or Pepinh-MyD, or the same volume of PBS 3 and 1 h before RF treatment and ID OVA immunization at 10 µg dose. OVA immunization alone served as control (No adjuvant). Serum anti-OVA antibody titer was measured 2 weeks later. n = 4–5. One-way ANOVA with Tukey’s multiple comparison test was used to compare differences between groups in c and d. *p < 0.05; **p < 0.01. NS not significant. Representative of two independent experiments in c and d

References

    1. Li W, Joshi MD, Singhania S, Ramsey KH, Murthy AK. Peptide vaccine: progress and challenges. Vaccines. 2014;2:515–536. doi: 10.3390/vaccines2030515. - DOI - PMC - PubMed
    1. Petrovsky N, Aguilar JC. Vaccine adjuvants: current state and future trends. Immunol. Cell Biol. 2004;82:488–496. doi: 10.1111/j.0818-9641.2004.01272.x. - DOI - PubMed
    1. Di Pasquale A, Preiss S, Tavares Da Silva F, Garcon N. Vaccine adjuvants: from 1920 to 2015 and beyond. Vaccines. 2015;3:320–343. doi: 10.3390/vaccines3020320. - DOI - PMC - PubMed
    1. Kool M, Fierens K, Lambrecht BN. Alum adjuvant: some of the tricks of the oldest adjuvant. J. Med. Microbiol. 2012;61:927–934. doi: 10.1099/jmm.0.038943-0. - DOI - PubMed
    1. O’Hagan DT, Ott GS, Nest GV, Rappuoli R, Giudice GD. The history of MF59((R)) adjuvant: a phoenix that arose from the ashes. Expert. Rev. Vaccin. 2013;12:13–30. doi: 10.1586/erv.12.140. - DOI - PubMed

Publication types