. 2018 Sep 12;8(1):13650.
doi: 10.1038/s41598-018-31911-7.

Objective Evaluation of Multiple Sclerosis Lesion Segmentation using a Data Management and Processing Infrastructure

Affiliations

Objective Evaluation of Multiple Sclerosis Lesion Segmentation using a Data Management and Processing Infrastructure

Olivier Commowick et al. Sci Rep. .

Abstract

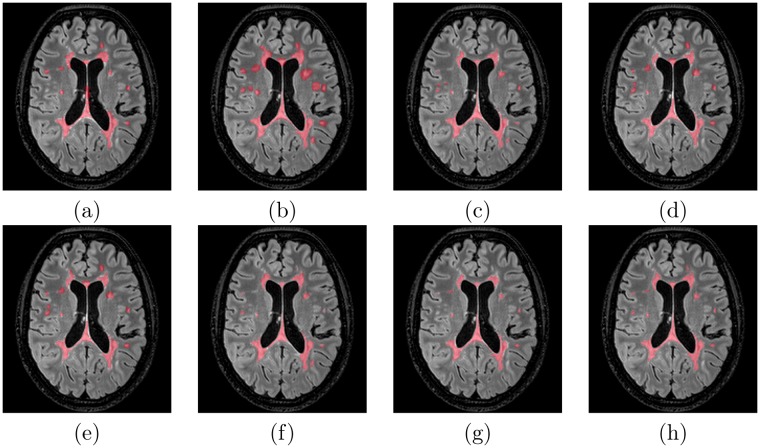
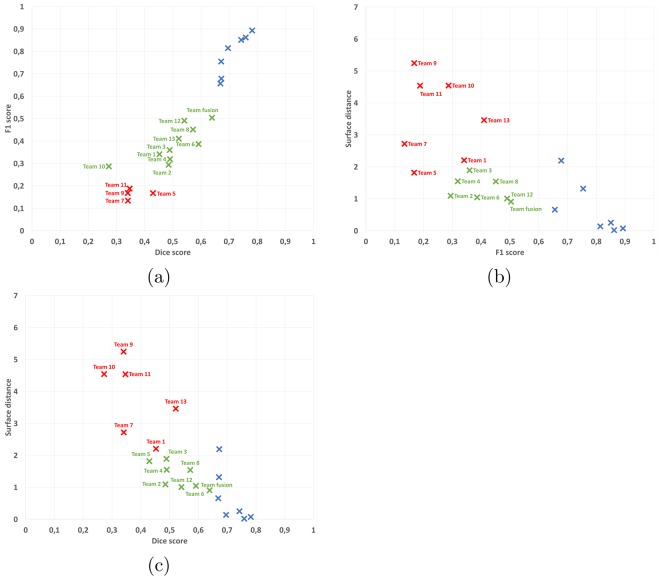
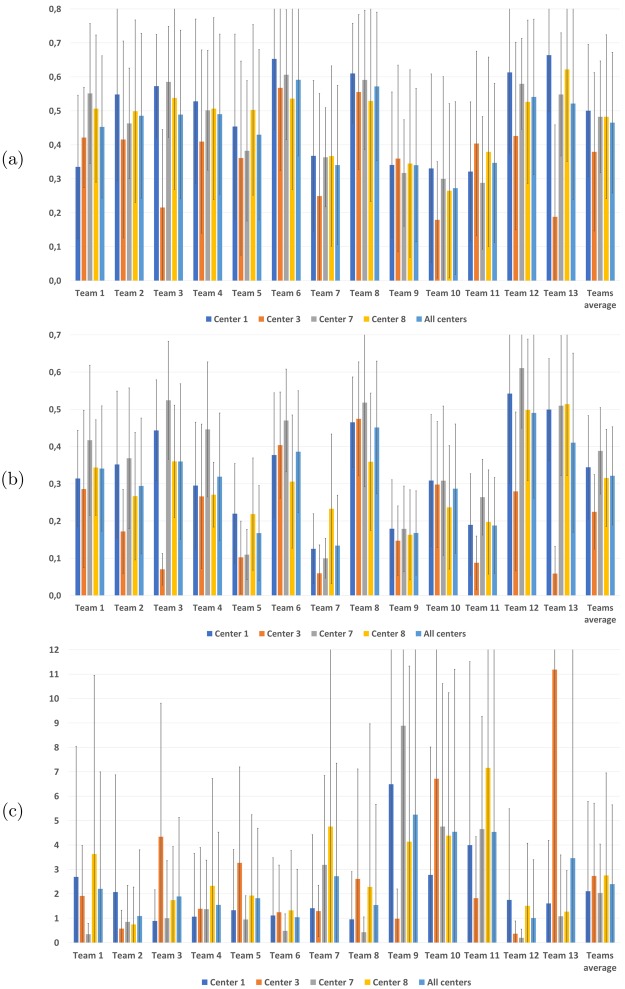
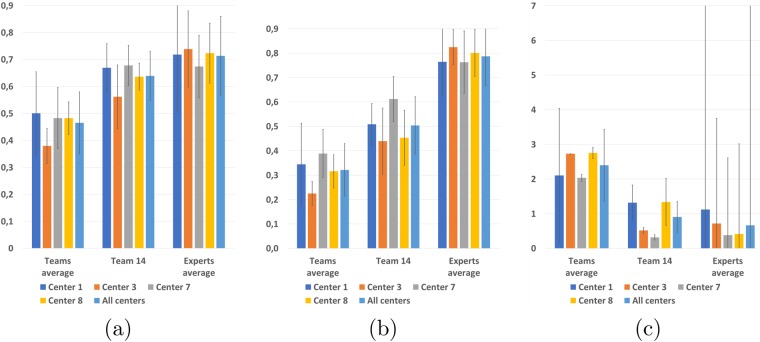
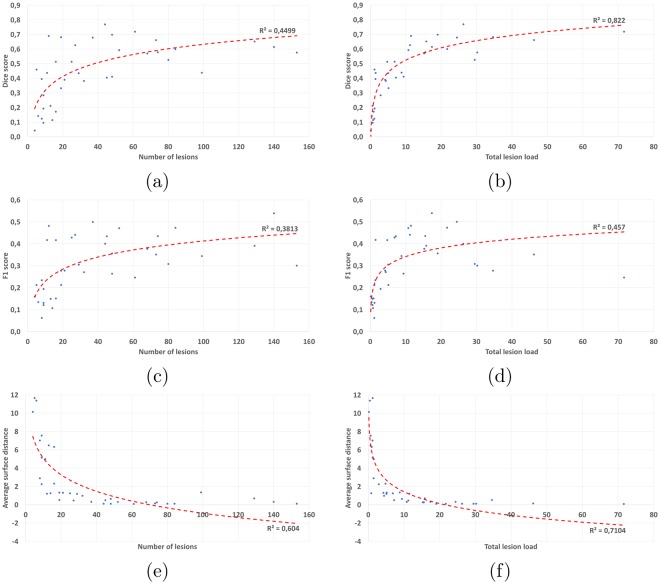
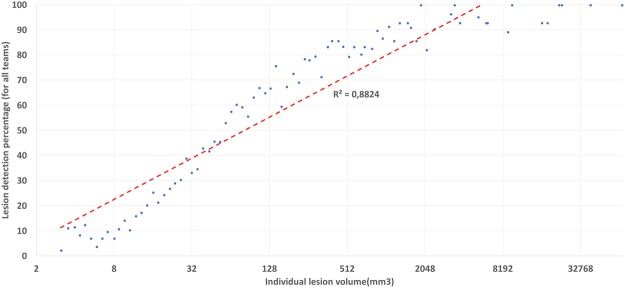
We present a study of multiple sclerosis segmentation algorithms conducted at the international MICCAI 2016 challenge. This challenge was operated using a new open-science computing infrastructure. This allowed for the automatic and independent evaluation of a large range of algorithms in a fair and completely automatic manner. This computing infrastructure was used to evaluate thirteen methods of MS lesions segmentation, exploring a broad range of state-of-theart algorithms, against a high-quality database of 53 MS cases coming from four centers following a common definition of the acquisition protocol. Each case was annotated manually by an unprecedented number of seven different experts. Results of the challenge highlighted that automatic algorithms, including the recent machine learning methods (random forests, deep learning, …), are still trailing human expertise on both detection and delineation criteria. In addition, we demonstrate that computing a statistically robust consensus of the algorithms performs closer to human expertise on one score (segmentation) although still trailing on detection scores.


Conflict of interest statement

The authors declare no competing interests.

Figures

Figure 1
Figure 1
Illustration of an MS patient delineations overlaid on the 3D FLAIR image. (ag) Individual manual delineations of MS lesions from each of the experts, (h) consensus segmentation considered as the ground truth.
Figure 2
Figure 2
Graphical results illustration of automatic clustering of average results for each team and expert into three groups (scatter plots of pairs of two evaluation parameters: (a) Dice and F1 scores, (b) surface distance and F1 scores, (c) surface distance and Dice scores). Legend: blue crosses: group 1 (always containing only the seven experts even though the clustering is automatic), green crosses: group 2 (best performing algorithms), red crosses: group 3 (lower “quality” algorithms). Team numbers associated with each point on the graph are indicated as labels. Team fusion indicates a composite segmentation result further discussed in Section 2.5.
Figure 3
Figure 3
Dice scores (a) F1 scores (b) and average surface distances (c) with respect to the consensus per team for each center and averaged over all centers.
Figure 4
Figure 4
Dice scores (a) F1 scores (b) and average surface distances (c) with respect to the consensus for each center and averaged over all centers for composite Team fusion with respect to the average experts agreement level.
Figure 5
Figure 5
Link between average scores of all methods and number of lesions (first column) and total lesion load (cm3, second column). First line: Dice score, second line: F1 score, third line: average surface distance.
Figure 6
Figure 6
Individual lesion detection rate (average over all methods) as a function of lesion size. X-axis: individual lesion volume on a logarithmic scale. Y-axis: detection rate (in percentages, number of teams detecting a lesion of this volume over all patients).
Figure 7
Figure 7
FLI-IAM architecture.
Figure 8
Figure 8
Workflow for database and computing platform integration.
Figure 9
Figure 9
Illustration of overlap-based segmentation evaluation: quantities used for measures computation. A denotes the evaluated segmentation, G the ground truth, and B the image domain.
Algorithm 1
Algorithm 1
TPG computation algorithm.

References

    1. Pugliatti, M. et al. The epidemiology of multiple sclerosis in europe. European Journal of Neurology 700–722 (2006). - PubMed
    1. Polman CH, et al. Diagnostic criteria for multiple sclerosis: 2010 Revisions to the McDonald criteria. Annals of Neurology. 2011;69:292–302. doi: 10.1002/ana.22366. - DOI - PMC - PubMed
    1. Leray E, et al. Evidence for a two-stage disability progression in multiple sclerosis. Brain. 2010;133:1900–1913. doi: 10.1093/brain/awq076. - DOI - PMC - PubMed
    1. Mortazavi D, Kouzani AZ, Soltanian-Zadeh H. Segmentation of multiple sclerosis lesions in mr images: a review. Neuroradiology. 2012;54:299–320. doi: 10.1007/s00234-011-0886-7. - DOI - PubMed
    1. Lladó X, et al. Segmentation of multiple sclerosis lesions in brain mri: A review of automated approaches. Information Sciences. 2012;186:164–185. doi: 10.1016/j.ins.2011.10.011. - DOI

Publication types

MeSH terms

LinkOut - more resources