. 2018 Sep;561(7722):263-267.
doi: 10.1038/s41586-018-0475-6. Epub 2018 Sep 12.

GAPDH inhibits intracellular pathways during starvation for cellular energy homeostasis

Affiliations

GAPDH inhibits intracellular pathways during starvation for cellular energy homeostasis

Jia-Shu Yang et al. Nature. 2018 Sep.

Abstract

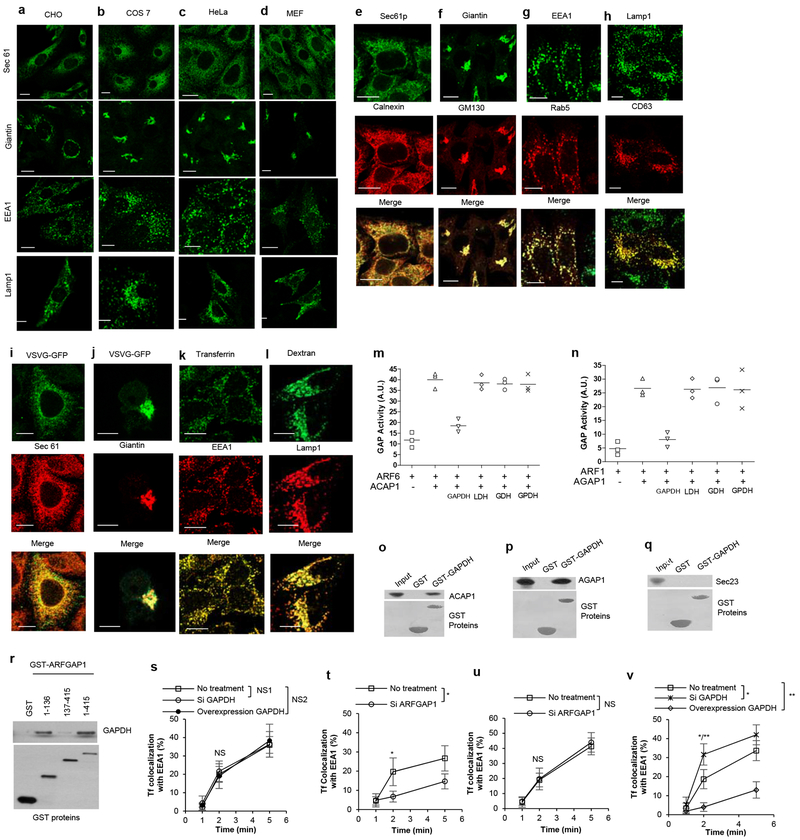
Starvation poses a fundamental challenge to cell survival. Whereas the role of autophagy in promoting energy homeostasis in this setting has been extensively characterized1, other mechanisms are less well understood. Here we reveal that glyceraldehyde 3-phosphate dehydrogenase (GAPDH) inhibits coat protein I (COPI) transport by targeting a GTPase-activating protein (GAP) towards ADP-ribosylation factor 1 (ARF1) to suppress COPI vesicle fission. GAPDH inhibits multiple other transport pathways, also by targeting ARF GAPs. Further characterization suggests that this broad inhibition is activated by the cell during starvation to reduce energy consumption. These findings reveal a remarkable level of coordination among the intracellular transport pathways that underlies a critical mechanism of cellular energy homeostasis.


Figures

ED Fig 1.
ED Fig 1.. Further characterizing how GAPDH inhibits COPI transport.
a,b, HeLa cells were treated as indicated, and then the COPI transport assay was performed. A confocal image from a representative experiment (out of three) is shown, VSVG-KDELR (green), giantin (red), bar = 10 um. Line-scan analysis for the image is also shown. c, HeLa cells were treated as indicated, and then the COPI transport assay was performed. Quantitation of a representative experiment (out of three) is shown, n=10 fields of cells examined, mean +/− SD, two-tailed t-test, *p=2.8E-07, **p=8.2E-07. d, HeLa cells were treated as indicated, and then cell death was quantified by flow cytometry, n=10, mean +/− SD, two-tailed t-test, NS=0.7314. e, HeLa cells were treated as indicated, and then the COPI transport assay was performed. A confocal image from a representative experiment (out of three) is shown, VSVG-KDELR (green), giantin (red), bar = 10 um. Line-scan analysis for the image is also shown. f, HeLa cells were treated as indicated, and then whole cell lysates were immunoblotted for proteins as indicated, n=3. g, GST fusion proteins were incubated with purified GAPDH in a pulldown experiment, followed by immunoblotting for proteins as indicated, n=3. h, HeLa cells were transfected with constructs as indicated, followed by immunoprecipitation for the Myc tag and then immunoblotting for GAPDH, n=2. i, GST fusion proteins as indicated were bound to beads and then incubated with purified coatomer in a pulldown experiment, followed by immunoblotting to detect β-COP or Coomassie-staining to detect GST fusion proteins, n=3. j, Cytoplasmic tails of cargoes as indicated were fused to GST, bound to beads, and then incubated with ARFGAP1, followed by immunoblotting with antibody against ARFGAP1 or Coomassie staining to detect GST fusion proteins, n=2. k, HeLa cells were treated as indicated, and then COPI transport was assessed. Quantitation of a representative experiment (out of three) is shown, n=10 fields of cells examined, mean +/− SD, two-tailed t-test, *p=1.4E-06. l, HeLa cells were transfected with GAPDH constructs as indicated, followed by immunoprecipitation of ARFGAP1 and then immunoblotting for the different forms of GAPDH as indicated, n=2.
ED Fig 2.
ED Fig 2.. Further characterizing how GAPDH affects other pathways.
a, HeLa cells were treated as indicated, and then subjected to fractionation into cytosol (C) versus total membrane (M), followed by immunoblotting for proteins as indicated, n=2. b-f, HeLa cells were treated as indicated, and then examined for the colocalization between GAPDH and different organelle markers. A confocal image from a representative experiment (out of three) is shown, bar, 10 um (left); quantitation is also shown (right), n=10 fields of cells examined, mean +/− SD, two-tailed t-test: (b) Colocalization of GAPDH (red) with giantin (green), *p=2.9E-04. (c) Colocalization of GAPDH (red) with TGN46 (green), *p=1.5E-04. (d) Colocalization of GAPDH (red) with EEA1 (green), *p=1.9E-03. (e) Colocalization of GAPDH (red) with Lamp1 (green), *p=7.2E-04. (f) Colocalization of GAPDH (red) with Sec61p (green), NS=0.8531. g-l, Transport assays were performed in HeLa cells. A confocal image from a representative experiment (out of three) is shown, bar = 10 um. Line-scan analysis for the representative image is also shown. (g) Transport from the ER to the Golgi, VSVG (green) and giantin (red), (h) Transport from the Golgi to the PM, VSVG (green) and TGN46 (red), (i) Transport from the RE to the PM, Tf (red), Rab11 (green), (j) Transport from the PM to the Golgi, CT (red), TGN46 (green), (k) Transport from the PM to the lysosome, EGF (red), Lamp1 (green), (l) Transport from the PM to the EE, dextran (red), EEA1 (green). m,n, Transport assays in HeLa cells, a representative experiment (out of three) is shown, n=10 fields of cells examined, mean +/− SD, two-tailed t-test: (m) CT endocytosis, NS1=1, NS2=0.3205. (n) interleukin-2 receptor beta subunit (IL2R-β) endocytosis, NS1=0.063, NS2=0.9264. o-r, HeLa cells were treated as indicated followed by immunofluorescence microscopy using different antibodies against GAPDH (o,q) or imaging for GFP-tagged GAPDH (p,r), n=2. Image from a representative experiment is shown, bar, 10 um.
ED Fig 3.
ED Fig 3.. Additional characterizations on GAPDH and its effects on the transport pathways.
a-d, The distribution of different organelle markers in CHO (a), COS-7 (b), HeLa (c), or MEF (d) cells were assessed by immunofluorescence microscopy, n=2. Image from a representative experiment is shown, bar, 10 um. e-h, Comparing the distribution of two markers against the same intracellular compartment using confocal microscopy, n=2. Image from a representative experiment is shown, bar, 10 um. (e) ER markers, Sec61p (green), calnexin (red). (f) Golgi markers, giantin (green), GM130 (red). (g) EE markers, EEA1 (green), Rab5 (red). (h) Lysosome markers, lamp1 (green), CD63 (red). i-l, Confirming the staining specificity of organelle markers using model cargoes that reside at specific intracellular compartments through confocal microcopy, n=2. Image from a representative experiment is shown, bar, 10 um. (i) GFP-tagged VSVG at the ER (green), Sec61p (red). (j) GFP-tagged VSVG at the Golgi (green), giantin (red), (k) fluorescently labeled Tf (green), EEA (red), (l) fluorescently labeled dextran (green), lamp1 (red). m-n, The GAP assay was performed using ARF6 and ACAP1 (m), or using ARF1 and AGAP1 (n), in the presence of different metabolic enzymes as indicated, n= 3. o-r, Pulldown studies to detect GAPDH binding directly to: ACAP1 (o), AGAP1 (p), Sec23p (q), or different portions of ARFGAP1 as indicated (r), n=3. s-v, HeLa (s,u) or BSC-1 (t,v) cells were treated as indicated, followed by transport assay for Tf endocytosis. Quantitation of a representative experiment (out of three) is shown, n=10 fields of cells examined, mean +/− SD, two-tailed t-test. (s) NS1=0.4646, NS2=0.6973. (t) *p=1.8E-04. (u) NS=0.8073. (v) *p=3.6E-05. **p=1.7E-06.
ED Fig 4.
ED Fig 4.. Different ways of starving cells lead to identical pathways being inhibited, and these inhibitions require GAPDH.
a-h, HeLa cells were incubated in Hank’s medium, and then transport assays were performed. Quantitation of an experiment (out of three) is shown, n=10 fields of cells examined, mean +/− SD, two-tailed t-test: (a) Transport of VSVG from the ER to the Golgi, NS1=0.1944, NS2=0.05. (b) COPI transport of VSVG-KDELR from the Golgi to the ER, *p=2.4E-06, **p=4.2E-10. (c) Transport of VSVG from the Golgi to the PM, *p=1.7E-05, **p=6.7E-08. (d) Transport of Tf from the early endosome (EE) to the PM, *p=2.9E-05, **p=6.9E-09. (e) Transport of CT from the PM to the Golgi, *p=2.4E-03, **p=7.8E-07. (f) Transport of EGF from the PM to the lysosome, *p=1.9E-06, **p=1.5E-02. (g) Transport of dextran from the PM to the EE. *p=7.8E-03, **p=3.4E-07. (h) Transport of EGF from the PM to the EE, NS1=0.1485, NS2=0.6378. i-p, HeLa cells were incubated in medium without glucose, and then transport assays were performed. Quantitation of an experiment (out of three) is shown, n=10 fields of cells examined, mean +/− SD, two-tailed t-test: (i) Transport of VSVG from the ER to the Golgi, NS1=0.6921, NS2=0.5648. (j) COPI transport of VSVG-KDELR from the Golgi to the ER, *p=4.4E-04, **p=6.5E-07. (k) Transport of VSVG from the Golgi to the PM, *p=1.6E-02, **p= 6.7E-05. (l) Transport of Tf from the early endosome (EE) to the PM, *p=1.9E-04, **p=2.8E-09. (m) transport of CT from the PM to the Golgi, *p=7.4E-04, **p=4.2E-05. (n) Transport of EGF from the PM to the lysosome, *p=7.6E-03, **p=3.2E-09. (o) Transport of dextran from the PM to the EE, *p=2.2E-03, **p=1.6E-05. (p) Transport of EGF from the PM to the EE, NS1=0.8648, NS2=0.8946. q-x, HeLa cells were incubated in medium without amino acids, and then transport assays were performed. Quantitation of a representative experiment (out of three) is shown, n=10 fields of cells examined, mean +/− SD, two-tailed t-test: (q) Transport of VSVG from the ER to the Golgi, NS1=0.1419, NS2=0.3379. (r) COPI transport of VSVG-KDELR from the Golgi to the ER, *p=1.9E-05, **p=1.1E-06. (s) Transport of VSVG from the Golgi to the PM, *p=1.1E-03, **p=6.6E-07. (t) Transport of Tf from the early endosome (EE) to the PM, *p=7.2E-05, **p=8.4E-07. (u) transport of CT from the PM to the Golgi, *p=1.1E-05, **p=1.8E-06. (v) Transport of EGF from the PM to the lysosome, *p=1.1E-02, **p=9.3E-08. (w) Transport of dextran from the PM to the EE, *p=7.8E-03, **p=1.2E-08. (x) Transport of EGF from the PM to the EE, NS1=0.9731, NS2=0.8159.
ED Fig 5.
ED Fig 5.. Further characterizing the effects of starvation and GAPDH.
a-c, HeLa cells were starved using Hank’s medium (a), medium that lacks glucose (b), or medium that lacks amino acids (c), and then total ATP level was measured, n=3. d, HeLa cells were treated as indicated, followed measurement of lactate production, n=3. e, HeLa cells were treated as indicated, followed measurement of oxygen consumption rate, n=3. f, The relative abundance of various glycolytic enzymes in HeLa cells. Data is derived from a public database (https://pax-db.org/protein). g-n, HEK293 cells were treated as indicated. Transport assays were then performed. Quantitation of a representative experiment (out of three) is shown, n=10 fields of cells examined, mean +/− SD, two-tailed t-test: (g) Transport of VSVG from the ER to the Golgi, NS1=0.6468, NS2=0.2133. (h) COPI transport of VSVG-KDELR from the Golgi to the ER, *p=4.3E-07, **p=1.3E-03. (i) Transport of VSVG from the Golgi to the PM, *p=2.1E-03, **p=1.9E-05. (j) Transport of Tf from the early endosome (EE) to the PM, *p=6.3E-05, **p=4.7E-04. (k) transport of CT from the PM to the Golgi, *p=6.5E-04, **p=1.5E-02. (l) Transport of EGF from the PM to the lysosome, *p=7.8E-07, **p=6.5E-08. (m) Transport of dextran from the PM to the EE, *p=3.6E-06, **p=3.4E-02. (n) Transport of EGF from the PM to the EE, NS1=0.2375, NS2=0.5291. o-v, HEK293 cells were treated as indicated. Transport assays were then performed. Quantitation of a representative experiment (out of three) is shown, n=10 fields of cells examined, mean +/− SD, two-tailed t-test: (o) Transport of VSVG from the ER to the Golgi, NS1=0.6649, NS2=0.84. (p) COPI transport of VSVG-KDELR from the Golgi to the ER, *p=4.6E-03, **p=2.5E-06. (q) Transport of VSVG from the Golgi to the PM, *p=7.1E-05, **p=1.1E-06. (r) Transport of Tf from the early endosome (EE) to the PM, *p=7.2E-06, **p=6.5E-09. (s) transport of CT from the PM to the Golgi, *p=5.6E-03, **p=8.8E-09. (t) Transport of EGF from the PM to the lysosome, *p=1.1E-02, **p=2.9E-08. (u) Transport of dextran from the PM to the EE, *p=2.4E-04, **p=2.4E-06. (v) Transport of EGF from the PM to the EE, NS1=0.7924, NS2=0.4675. w,x, HEK293 cells were treated as indicated, followed by starvation, and then quantitation of total ATP level (w) or cell death (x), n=3, mean with SD are shown.
ED Fig 6.
ED Fig 6.. Inhibition of transport pathways by starvation and AMPK.
a-h, HeLa cells were starved using a general starvation medium (lacking glucose and amino acids), and then transport assays were performed. Quantitation of a representative experiment (out of three) is shown, n=10 fields of cells examined, mean +/− SD, two-tailed t-test: (a) Transport of VSVG from the ER to the Golgi, NS1=0.3506, NS2=0.9126. (b) COPI transport of VSVG-KDELR from the Golgi to the ER, *p=8.6E-04, **p=5.8E-07. (c) Transport of VSVG from the Golgi to the PM. *p=1.0E-07, **p=4.4E-09. (d) Transport of Tf from the early endosome (EE) to the PM, *p=4.2E-05, **p=4.4E-10. (e) transport of CT from the PM to the Golgi, *p=2.6E-04, **p=9.5E-07. (f) Transport of EGF from the PM to the lysosome, *p=2.0E-04, **p=2.2E-13. (g) Transport of dextran from the PM to the EE, *p=1.4E-04, **p=1.6E-06. (h) Transport of EGF from the PM to the EE, NS1=0.1085, NS2=0.1408. i, HeLa cells were treated as indicated and then the whole cell lysate was immunoblotted for proteins as indicated, n=2 experiments. j, HeLa cells were starved, and then the COPI transport assay was performed. Quantitation of a representative experiment (out of three) is shown, n=10 fields of cells examined, mean +/− SD, two-tailed t-test, *p=1.1E-04, **p=3.5E-06. k, HeLa cells were treated as indicated and then the whole cell lysate was immunoblotted for proteins as indicated, n=2 experiments. l-s, HeLa cells were starved, and then transport assays were performed. Quantitation of a representative experiment (out of three) is shown, n=10 fields of cells examined, mean +/− SD, two-tailed t-test: (l) Transport of VSVG from the ER to the Golgi, NS1=0.6077, NS2=0.5535. (m) COPI transport of VSVG-KDELR from the Golgi to the ER, *p=3.5E-06, **p=3.6E-10. (n) Transport of VSVG from the Golgi to the PM, *p=4.1E-03, **p=4.4E-06. (o) Transport of Tf from the early endosome (EE) to the PM, *p=3.7E-06, **p=1.1E-09. (p) transport of CT from the PM to the Golgi, *p=7.6E-04, **p=8.7E-11. (q) Transport of EGF from the PM to the lysosome, *p=3.1E-08, **p=1.3E-02. (r) Transport of dextran from the PM to the EE, *p=1.1E-06, **p=3.7E-10. (s) Transport of EGF from the PM to the EE, NS1=0.228, NS2=0.1738.
ED Fig 7.
ED Fig 7.. Effects of AMPK on GAPDH distribution and transport pathways.
a-e, HeLa cells were treated as indicated, and then examined for the colocalization between GAPDH and different organelle markers. A confocal image from a representative experiment (out of three) is shown, bar, 10 um (left); quantitation is also shown (right), n=10 fields of cells examined, mean +/− SD, two-tailed t-test: (a) Colocalization of GAPDH (red) with giantin (green), *p=2.9E-03, NS=0.6397. (b) Colocalization of GAPDH (red) with TGN46 (green), *p=6.5E-03, NS=0.6413. (c) Colocalization of GAPDH (red) with EEA1 (green), *p=3.5E-03, NS=0.8793. (d) Colocalization of GAPDH (red) with Lamp1 (green), *p=9.4E-04, NS=0.551. (e) Colocalization of GAPDH (red) with Sec61p (green), NS1=0.5361, NS2=0.4243. f-m, HeLa cells were treated as indicated, and then transport assays were performed. Quantitation of a representative experiment (out of three) is shown, n=10 fields of cells examined, mean +/− SD, two-tailed t-test: (f) Transport of VSVG from the ER to the Golgi, NS1=0.5250, NS2=0.8291. (g) COPI transport of VSVG-KDELR from the Golgi to the ER, *p=4.6E-05, **p=2.9E-08. (h) Transport of VSVG from the Golgi to the PM, *p=1.4E-04, **p=6.9E-10. (i) Transport of Tf from the early endosome (EE) to the PM, *p=2.0E-07, **p=1.0E-11. (j) transport of CT from the PM to the Golgi, *p=4.0E-04, **p=3.9E-08. (k) Transport of EGF from the PM to the lysosome, *p=7.1E-04, **p=4.2E-08. (l) Transport of dextran from the PM to the EE, *p=1.4E-07, **p=1.9E-09. (m) Transport of EGF from the PM to the EE, NS1=0.6088, NS2=0.4061. n-u, HeLa cells were treated as indicated, and then transport assays were performed. Quantitation of a representative experiment (out of three) is shown, n=10 fields of cells examined, mean +/− SD, two-tailed t-test: (n) Transport of VSVG from the ER to the Golgi, NS1=0.5559, NS2=0.8576. (o) COPI transport of VSVG-KDELR from the Golgi to the ER, *p=4.1E-05, **p=2.3E-09. (p) Transport of VSVG from the Golgi to the PM, *p=4.2E-03, **p=6.3E-05. (q) Transport of Tf from the early endosome (EE) to the PM, *p=7.2E-04, **p=3.7E-11. (r) transport of CT from the PM to the Golgi, *p=2.3E-04, **p=3.0E-08. (s) Transport of EGF from the PM to the lysosome, *p=2.9E-03, **p=5.8E-06. (t) Transport of dextran from the PM to the EE, *p=2.9E-02, **p=1.6E-08. (u) Transport of EGF from the PM to the EE, NS1=0.6856, NS2=0.9248.
ED Fig 8.
ED Fig 8.. Further characterizing how AMPK acts on GAPDH.
a-e, HeLa cells were treated as indicated, and then examined for the colocalization between GAPDH and different organelle markers. A confocal image from a representative experiment (out of three) is shown, bar, 10 um (left); quantitation is also shown (right), n=10 fields of cells examined, mean +/− SD, two-tailed t-test: (a) Colocalization of GAPDH (red) with giantin (green), *p=1.5E-04. (b) Colocalization of GAPDH (red) with TGN46 (green), *p=2.2E-04. (c) Colocalization of GAPDH (red) with EEA1 (green), *p=2.1E-03. (d) Colocalization of GAPDH (red) with Lamp1 (green), *p=7.1E-05. (e) Colocalization of GAPDH (red) with Sec61p (green), NS=0.9933. f, Purity of GAPDH forms assessed by Coomassie gel staining, n=2. g, Purity of AMPK complex assessed by Coomassie gel staining, n=2. h-j, AMPK was incubated with wild-type GAPDH (h), S122A mutant GAPDH (i), or a peptide derived from ACC known as SAMS (j) in the in vitro kinase assay, followed by quantitation of phosphorylation over time, n=3. k, calculation of the stoichiometry of phosphorylation from the results shown in (h-j). l-q, Whole cell lysates, derived from HeLa (l-n) or HEK293 (o-q) cells, were treated as indicated and then immunoblotted for proteins as indicated, n=2.
ED Fig 9.
ED Fig 9.. Further characterizing how GAPDH mediates the ability of starvation to inhibit the transport pathways.
a-h, HeLa cells were transfected with the S122A mutant GAPDH, followed by starvation. Transport assays were then performed. Quantitation of a representative experiment (out of three) is shown, n=10 fields of cells examined, mean +/− SD, two-tailed t-test done for the following transport assays: (a) Transport of VSVG from the ER to the Golgi, NS1=0.4144, NS2=0.7463 (b) COPI transport of VSVG-KDELR from the Golgi to the ER, *p=3.8E-05, **p=1.9E-09. (c) Transport of VSVG from the Golgi to the PM. *p=3.6E-03, **p=1.4E-06. (d) Transport of Tf from the early endosome (EE) to the PM, *p=1.4E-03, **p=1.4E-05. (e) transport of CT from the PM to the Golgi, *p=7.9E-05, **p=1.5E-07. (f) Transport of EGF from the PM to the lysosome, *p=4.0E-03, **p=1.3E-09. (g) Transport of dextran from the PM to the EE, *p=3.1E-05, **p=1.2E-08. (h) Transport of EGF from the PM to the EE, NS1=0.7549, NS2=0.2279. i-p, HeLa cells were transfected with the S122D mutant GAPDH. Transport assays were then performed. Quantitation of a representative experiment (out of three) is shown, n=10 fields of cells examined, mean +/− SD, two-tailed t-test: (i) Transport of VSVG from the ER to the Golgi, NS=0.8289. (j) COPI transport of VSVG-KDELR from the Golgi to the ER, *p=2.2E-05. (k) Transport of VSVG from the Golgi to the PM, *p=6.3E-04. (l) Transport of Tf from the early endosome (EE) to the PM, *p=6.9E-06. (m) transport of CT from the PM to the Golgi, *p=1.3E-04. (n) Transport of EGF from the PM to the lysosome, *p=1.6E-03. (o) Transport of dextran from the PM to the EE, *p=7.4E-04. (p) Transport of EGF from the PM to the EE, NS=0.5473.
ED Fig 10.
ED Fig 10.. Further confirmation that the roles of GAPDH in transport and autophagy are distinct.
a, HeLa cells were transfected with GFP-tagged forms of GAPDH as indicated followed by immunofluorescence microscopy, n=2. Representative image from an experiment is shown, bar, 10 um. b, HeLa cells were transfected with GFP-tagged forms of GAPDH as indicated followed assessment of Sirt1 activity, n=3. c, HeLa cells were transfected with GFP-tagged forms of GAPDH as indicated, and then LC3 puncta formation was quantified. Quantitation of a representative experiment (out of three) is shown, n=10 fields of cells examined, mean +/− SD, two-tailed t-test, *p=2.3E-05, NS=0.5598. d, HeLa cells were transfected with GFP-tagged forms of GAPDH as indicated, and then LC3 lipidation was assessed by immunoblotting, n=2. e, HeLa cells were treated as indicated, and then LC3 puncta formation was quantified. Quantitation of a representative experiment (out of three) is shown, n=10 fields of cells examined, mean +/− SD, two-tailed t-test, *p=1.7E-05. f, HeLa cells were treated as indicated, and then LC3 lipidation was assessed by immunoblotting, n=2. g, HeLa cells were treated as indicated, and then p62 level was assessed by immunoblotting, n=2. h-o, HeLa cells were treated as indicated. Transport assays were then performed. Quantitation of a representative experiment (out of three) is shown, n=10 fields of cells examined, mean +/− SD, two-tailed t-test: (h) Transport of VSVG from the ER to the Golgi, NS=0.8155. (i) COPI transport of VSVG-KDELR from the Golgi to the ER, *p=1.4E-05. (j) Transport of VSVG from the Golgi to the PM, *p=5.5E-04. (k) Transport of Tf from the early endosome (EE) to the PM, *p=3.3E-07. (l) transport of CT from the PM to the Golgi, *p=2.0E-03. (m) Transport of EGF from the PM to the lysosome, *p=2.4E-06. (n) Transport of dextran from the PM to the EE, *p=3.9E-05. (o) Transport of EGF from the PM to the EE, NS=0.7725. p,q, HeLa cells were treated as indicated, followed by quantitation of total ATP level (p) or cell death (q), n=3, mean +/− SD is shown. r, HeLa cells were treated as indicated, followed by quantitation of total ATP level, n=3, mean +/− SD is shown. s,t HeLa cells were treated as indicated, and then COPI transport was assessed. Quantitation of a representative experiment (out of three) is shown, n=10 fields of cells examined, mean +/− SD, two-tailed t-test, *p=3.5E-05 (s), NS=0.7907 (t). (u) HeLa cells were treated as indicated, followed by quantitation of total ATP level, n=3, mean +/− SD is shown.
Fig 1.
Fig 1.. GAPDH inhibits COPI vesicle fission by targeting the GAP activity of ARFGAP1.
a,b, COPI transport in HeLa cells, n=10 fields of cells examined in a representative experiment (out of 3), mean +/− SD, two-tailed t-test: (a) *p=9.8E-07, **p=9.2E-09, (b) *p=6.8E-06. c, Vesicle reconstitution system, n=3, GDH (glutamate dehydrogenase), LDH (lactate dehydrogenase), GPDH (glycerol-3-phosphate dehydrogenase). d, Vesicle reconstitution system: EM image of Golgi membrane (left), bar = 50 nm; vesicle quantitation (right), n=10 EM meshes examined from a representative experiment (out of 3), *p=8.9E-07, e, GAP assay using ARF1 and ARFGAP1, and also with metabolic enzymes as indicated, n=3. f, Vesicle reconstitution system: EM image of Golgi membrane (left), bar = 50 nm; vesicle quantitation (right), n=10 EM meshes examined from a representative experiment (out of 3), *p=6.2E-06.
Fig 2.
Fig 2.. GAPDH inhibits other intracellular pathways by also targeting ARF GAPs. a-g.
Transport assays in HeLa cells, n=10 fields of cells examined in a representative experiment (out of 3), mean +/− SD, two-tailed t-test. (a) Transport of vesicular stomatitis virus G protein (VSVG) from the ER to the Golgi, NS1 (not significant)=0.625, NS2=0.438. (b) Transport of VSVG from the Golgi to the PM, *p=7.6E-08, **p=5.4E-06. (c) Endocytic recycling of transferrin (Tf) from the early endosome (EE) to the PM, *p=1.05E-07, **p=1.05E-07. (d) Endocytic transport of cholera toxin (CT) from the PM to the Golgi, *p=2.7E-09, **p=4.5E-04. (e) Endocytic transport of epidermal growth factor (EGF) from the PM to the lysosome, *p=1.6E-08, **p=7.2E-07. (f) Dextran endocytosis, *p=1.1E-10, **p=1.8E-06. (g) EGF endocytosis, NS1=0.9997, NS2=0.418. h-j, GAP assays using ARF6 and ACAP1 (h), using ARF1 and AGAP1 (i), or using Sar1p and Sec23p (j), n= 3.
Fig 3.
Fig 3.. AMPK phosphorylates GAPDH to inhibit the transport pathways for energy homeostasis.
a-h, Transport assays in HeLa cells, n=10 fields of cells examined in a representative experiment (out of 3), mean +/− SD, two-tailed t-test. (a) ER to Golgi, NS1=0.7084, NS2=0.175. (b) Golgi to ER, *p=5.7E-06, **p=6.3E-15. (c) Golgi to PM, *p=5.4E-06, **p=4.3E-11. (d) EE to the PM, *p=5.5E-09, **p=1.2E-12. (e) PM to Golgi, *p=5.4E-04, **p=6.2E-06. (f) PM to lysosome, *p= 1.7E-03, **p=1.9E-08. (g) Dextran endocytosis, *p=7.8E-08, **p=2.1E-12. (h) EGF endocytosis, NS1= 0.9994, NS2=0.7437. i, Total ATP level, n=3. j, Cell death, n=3. k, AMPK phosphorylation of GAPDH assessed by an in vitro kinase assay, n= 3. l,m, Distribution of GAPDH assessed by subcellular fraction, membranes (M), cytosol (C), n=2. n,p, Total ATP level, n=3. (o,q) Cell death, n=3.
Fig 4.
Fig 4.. The roles of GAPDH in transport and autophagy are distinct.
a,b, Autophagy in HeLa cells assessed by (a) LC3 puncta formation, n=10 fields of cells examined in a representative experiment (out of 2), mean +/− SD, two-tailed t-test, *p=0.000152, or (b) LC3 gel shift, n=2. c, GAPDH recruitment to the Golgi in HeLa cells, n=6 fields of cells examined in one experiment. d, LC3 puncta formation in HeLa cells, n=10 fields of cells examined in one experiment. e, COPI transport assay in HeLa cells, n=10 fields of cells examined in a representative experiment (out of 3), mean +/− SD, two-tailed t-test, NS=0.8490. f, LC3 puncta formation in HeLa cells, n=10 fields of cells examined in a representative experiment (out of 2), mean +/− SD, two-tailed t-test, *p=0.00174. g-n, Transport assays in Atg5-deficient MEFs, n=10 fields of cells examined in a representative experiment (out of 3), mean +/− SD, two-tailed t-test, (g) ER to Golgi, NS=0.25. (h) Golgi to ER, *p=9.9E-08. (i) Golgi to PM, *p=5.9E-07 (j) EE to PM, *p=6.4E-05. (k) PM to Golgi, *p=7.6E-07. (l) PM to lysosome, *p=3.2E-07. (m) Dextran endocytosis, *p=1.2E-09, (n) EGF endocytosis, NS=0.9994. o, Total ATP level, n=3. p, Cell death, n=3. q, Summarizing how transport inhibition by GAPDH promotes cellular energy homeostasis.

References

    1. Singh R & Cuervo AM Autophagy in the cellular energetic balance. Cell Metab 13, 495–504 (2011). - PMC - PubMed
    1. Donaldson JG & Jackson CL ARF family G proteins and their regulators: roles in membrane transport, development and disease. Nat Rev Mol Cell Biol 12, 362–375 (2011). - PMC - PubMed
    1. Yang JS et al. ARFGAP1 promotes the formation of COPI vesicles, suggesting function as a component of the coat. J Cell Biol 159, 69–78 (2002). - PMC - PubMed
    1. Lee SY, Yang JS, Hong W, Premont RT & Hsu VW ARFGAP1 plays a central role in coupling COPI cargo sorting with vesicle formation. J Cell Biol 168, 281–290 (2005). - PMC - PubMed
    1. Sirover MA On the functional diversity of glyceraldehyde-3-phosphate dehydrogenase: biochemical mechanisms and regulatory control. Biochim Biophys Acta 1810, 741–751 (2011). - PubMed

Publication types

MeSH terms

Substances