. 2018 Sep;561(7723):416-419.
doi: 10.1038/s41586-018-0500-9. Epub 2018 Sep 12.

In vivo CRISPR editing with no detectable genome-wide off-target mutations

Affiliations

In vivo CRISPR editing with no detectable genome-wide off-target mutations

Pinar Akcakaya et al. Nature. 2018 Sep.

Abstract

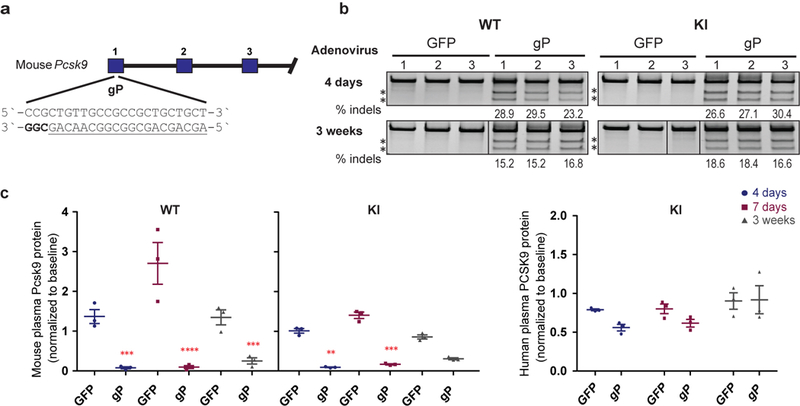
CRISPR-Cas genome-editing nucleases hold substantial promise for developing human therapeutic applications1-6 but identifying unwanted off-target mutations is important for clinical translation7. A well-validated method that can reliably identify off-targets in vivo has not been described to date, which means it is currently unclear whether and how frequently these mutations occur. Here we describe 'verification of in vivo off-targets' (VIVO), a highly sensitive strategy that can robustly identify the genome-wide off-target effects of CRISPR-Cas nucleases in vivo. We use VIVO and a guide RNA deliberately designed to be promiscuous to show that CRISPR-Cas nucleases can induce substantial off-target mutations in mouse livers in vivo. More importantly, we also use VIVO to show that appropriately designed guide RNAs can direct efficient in vivo editing in mouse livers with no detectable off-target mutations. VIVO provides a general strategy for defining and quantifying the off-target effects of gene-editing nucleases in whole organisms, thereby providing a blueprint to foster the development of therapeutic strategies that use in vivo gene editing.


Figures

Extended Data Fig. 1.
Extended Data Fig. 1.. gP/SpCas9 efficiently mutates the mouse Pcsk9 gene and reduces Pcsk9 protein plasma levels in vivo
(a) The gP gRNA was designed to target a sequence within exon 1 of the mouse Pcsk9 gene that has many closely related genomic sites (i.e., those with one to three mismatches relative to the on-target site; Extended Data Table 1). Blue bars indicate exons for the mouse genomic region. (b) Surveyor assay and next-generation DNA sequencing data demonstrating efficient in vivo modification of the on-target mouse Pcsk9 gene site in mouse liver by gP/SpCas9. Assays were performed 4 days and 3 weeks after administration of adenoviral vectors encoding gP/SpCas9 (“gP”) or negative control GFP/SpCas9 (“GFP”). For each time point, the assays used genomic DNA isolated from livers of n=3 biologically independent wild-type C57BL/6N (WT) mice or C57BL/6N-derivative mice harbouring a single copy of the human PCSK9 ORF under Albumin promoter knocked into the Rosa26 locus (KI). Asterisks indicate cleaved PCR products expected following treatment with Surveyor nuclease. Percentages show the frequencies of indel mutations determined by targeted amplicon sequencing using next-generation sequencing (these are the same values shown for the on-target site in Fig. 1b). Lines divide lanes taken from different locations on the same gel. For source data for Surveyor assays and targeted amplicon sequencing, see Supplementary Figure 1 and Supplementary Table 2, respectively. (c) Plasma mouse Pcsk9 protein levels measured in n=3 biologically independent WT and KI mice and plasma human PCSK9 protein levels measured in n=3 biologically independent KI mice following nuclease treatment. Protein levels were assessed 4 days, 7 days, and 3 weeks following administration of gP or control GFP adenoviral vectors and normalized to baseline levels. Significant differences between experimental and control groups were determined using two-way ANOVA and Sidak’s two-sided adjusted multiple comparisons test, P: *<0.05, **<0.01, ***<0.001, ****<0.0001. See source data for Extended Data Figure 4b for exact adjusted P values. All values are presented as group means, error bars represent standard error of the mean (SEM). The enhanced reduction of plasma Pcsk9 relative to the frequency of Pcsk9 genetic alteration observed is consistent with previously published studies (Supplementary Discussion).
Extended Data Fig. 2.
Extended Data Fig. 2.. Bio-distribution studies of adenovirus-serotype 5 in mice
(a) Schematic of integrated reporter construct in R26R mice used to assess delivery of Cre recombinase using adenovirus-serotype 5 vector. Cre-mediated excision of a loxP-flanked transcriptional stop signal upstream of a lacZ gene results in expression of beta-galactosidase enzyme. Beta-galactosidase expression can be quantified by staining dissected tissues with X-gal, a compound that turns blue when cleaved by this enzyme. (b) Quantification of beta-galactosidase expression in sections of various dissected organs from n=2 biologically independent R26R mice intravenously injected with adenovirus-serotype 5 vector encoding Cre. Matched organs sections from a R26R mouse intravenously injected with an adenovirus-serotype 5 vector encoding GFP were used to determine background staining levels and serve as a negative control. Matched organ sections from Z/EG mice that constitutively express lacZ (beta-galactosidase) and intravenously injected with PBS (rather than adenovirus) were used to provide positive staining controls. All mice were evaluated one week after adenovirus or PBS injection. The experiment was performed one time.
Extended Data Fig. 3.
Extended Data Fig. 3.. Breeding strategy for generation of experimental mice containing human PCSK9 open reading frame knocked into the Rosa26 locus
C57BL/6N-derivative mouse line harbouring a single copy of the human PCSK9 open reading frame knocked into the Rosa26 locus (C57BL/6N hPCSK9 KI +/−) are used for breeding with C57BL/6N mice. Offspring yielded experimental animals that are C57BL/6N hPCSK9 KI +/− (referred as “KI”) and C57BL/6N hPCSK9 KI −/− (referred as “WT”) males.
Extended Data Fig. 4.
Extended Data Fig. 4.. Scatterplot of CIRCLE-seq read counts for sites identified with gP/SpCas9 on genomic DNA from n=3 biologically independent WT and KI mice.
Read counts are shown on a log scale and colors indicate the number of mismatches in each off-target site relative to the on-target site. Sites shown as triangles were chosen for targeted amplicon sequencing. The correlation R2 value obtained using all values in the scatterplot is shown in the upper left-hand corner and was obtained using a linear regression.
Extended Data Fig. 5.
Extended Data Fig. 5.. Comparison of closely matched sites identified in silico and off-target cleavage sites identified by CIRCLE-seq
Venn diagrams comparing off-target cleavage sites in mouse genomic DNA identified by CIRCLE-seq experiments with closely matched sites (up to six mismatches relative to the on-target site) in the mouse genome identified in silico by Cas-OFFinder are shown for SpCas9 gRNAs gP, gM, and gMH.
Extended Data Fig. 6.
Extended Data Fig. 6.. Genetic and phenotypic alterations induced by delivery of gM/SpCas9 and gMH/SpCas9 in vivo
(a) Sequence and location of the SpCas9 gM (mouse) and gMH (mouse & human) gRNA target sites in the endogenous mouse Pcsk9 gene and human PCSK9 transgene inserted at the mouse Rosa26 locus. The single base position that differs between the gMH target sites in the mouse Pcsk9 gene and the human PCSK9 transgene is highlighted in red. Blue bars indicate exons for the mouse genomic region while purple bars represent exons for the human genomic locus; PAM sequence for the sites is in bold and the spacer sequence is underlined. (b) Surveyor assay and next-generation DNA sequencing data demonstrating efficient in vivo modification of the on-target endogenous mouse Pcsk9 site and human PCSK9 transgene in mouse liver. Assays were performed 4 days and 3 weeks following administration of adenoviral vectors encoding gM and SpCas9 (“gM”), gMH and SpCas9 (“gMH”) or GFP and SpCas9 (“GFP”) using genomic DNA isolated from livers of n=3 biologically independent WT and KI mice. Asterisks indicate cleaved PCR products expected following treatment with Surveyor nuclease. Percentages show the frequencies of indel mutations determined by targeted amplicon sequencing using next-generation sequencing (these are the same values shown for the on-target sites in Fig. 3 and Extended Data Fig. 7). Lines divide lanes taken from different locations on the same gel. For source data for Surveyor assays, see Supplementary Fig. 1. For source data for targeted amplicon sequencing, see Supplementary Tables 6 and 7 for gM and gMH, respectively. (b) Plasma mouse Pcsk9 protein levels in n=3 biologically independent WT and KI mice, and plasma human PCSK9 protein levels in n=3 biologically independent KI mice following CRISPR-Cas nuclease treatment. Plasma protein levels were assessed 4 days, 7 days, and 3 weeks following administration of gM, gMH, or control GFP adenoviral vectors and normalized to baseline levels at each timepoint. Significant differences between groups were determined using two-way ANOVA and Dunnett`s two-sided adjusted multiple comparisons test, p *<0.05, **<0.01, ***<0.001, ****<0.0001. See source data for Extended Data Figure 6 for exact adjusted P values. Values are presented as group means, error bars represent standard errors of the mean (SEM).
Extended Data Fig. 7.
Extended Data Fig. 7.. Assessment of in vivo off-target indel mutations induced by gMH/SpCas9
Indel mutation frequencies determined by targeted amplicon sequencing (using high-throughput sequencing) are presented as heat maps for the gMH/SpCas9 on-target site (black square) and 63 off-target sites identified from CIRCLE-seq experiments. Each locus was assayed in n=3 biologically independent mice (1, 2, 3) using genomic DNA isolated from the liver of WT and KI mice treated with experimental adenoviral vector encoding gMH/SpCas9 (gRNA +) or control adenoviral vector GFP/SpCas9 (gRNA -). For each site, mismatches relative to the on-target site are shown with colored boxes and bases in the spacer sequence are numbered from 1 (most PAM-proximal) to 20 (most PAM-distal). The number of read counts found for each site from the CIRCLE-seq experiments on WT and KI mouse genomic DNA are shown in the left columns (ranked from highest to lowest based on counts in the WT genomic DNA CIRCLE-seq experiment). Each box in the heatmap represents a single sequencing experiment. Sites that were significantly different between the experimental gRNA + and control gRNA – samples are highlighted with an orange outline around the boxes. Additional closely matched sites in the mouse genome (not identified from the CIRCLE-seq experiments) that were examined for indel mutations are boxed in red at the bottom of the figure. See Supplementary Table 7 for source data and P values (negative binomial).
Figure 1.
Figure 1.. Overview and validation of VIVO
(a) Schematic illustrating the two-step VIVO method. In Step 1, CIRCLE-seq identifies off-target sites cleaved in vitro. In Step 2, the sites identified in Step 1 are assessed in vivo for indel mutations by targeted amplicon sequencing performed with genomic DNA isolated from the livers of nuclease-treated mice. (b) Assessment of in vivo off-target indels induced by gP/SpCas9. Indel frequencies as determined by targeted amplicon sequencing are presented as heat maps for the gP/SpCas9 on-target site (black square) and the Class I, Class II, and Class III off-target sites (identified from CIRCLE-seq experiments). Each locus was assayed in n=3 biologically independent WT and KI mice (1, 2, 3) using genomic DNA isolated from the liver of mice treated with experimental adenoviral vector encoding gP/SpCas9 (gRNA +) or control adenoviral vector GFP/SpCas9 (gRNA -). Mismatches relative to the on-target site are shown with colored boxes and spacer sequence is numbered from 1 (most PAM-proximal) to 20 (most PAM-distal). CIRCLE-seq read count numbers for each site are shown. Sites that showed a significant difference between the experimental gRNA + and gRNA - samples are outlined with orange boxes and labelled by genomic locus with coding regions shown in purple text. P values and significance were obtained by fitting a negative binomial generalized linear model (for source data and P values, see Supplementary Table 2).
Figure 2.
Figure 2.. Characterization of Pcsk9-targeted gRNAs designed to be orthogonal to the mouse genome by CIRCLE-seq
Scatterplots of CIRCLE-seq read counts for off-target cleavage sites identified in vitro with gM/SpCas9 and gMH/Cas9 on genomic DNA from WT (n=1) and KI (n=1) mice (for source data, see Supplementary Tables 3 and 4). Each site is color-coded for the number of mismatches it has relative to the on-target site. Sites represented as triangles were chosen for targeted amplicon sequencing. Correlation R2 values shown were obtained by linear regression performed using all values in each scatterplot.
Figure 3.
Figure 3.. Assessment of in vivo off-target indels induced by gM/SpCas9
Indel frequencies determined by targeted amplicon sequencing for the gM/SpCas9 on-target site (black square) and 181 off-target sites identified by CIRCLE-seq. Each condition shown was assayed in n=3 biologically independent mice (1, 2, 3) using genomic DNA isolated from the liver of mice treated with experimental adenoviral vector encoding gM/SpCas9 (gRNA +) or control adenoviral vector GFP/SpCas9 (gRNA -). Data are presented as in Fig. 1b. The single site (the on-target site) that was significantly different between the experimental gRNA + and control gRNA – samples is highlighted with orange boxes. Additional closely matched sites in the mouse genome (not identified from the CIRCLE-seq experiments) examined for indel mutations are boxed in red. For source data and P values (negative binomial), see Supplementary Table 6.

Comment in

References

    1. Musunuru K The Hope and Hype of CRISPR-Cas9 Genome Editing: A Review. JAMA cardiology 2, 914–919 (2017). - PubMed
    1. Fellmann C, Gowen BG, Lin PC, Doudna JA & Corn JE Cornerstones of CRISPR-Cas in drug discovery and therapy. Nat Rev Drug Discov 16, 89–100 (2017). - PMC - PubMed
    1. Komor AC, Badran AH & Liu DR CRISPR-Based Technologies for the Manipulation of Eukaryotic Genomes. Cell 168, 20–36 (2017). - PMC - PubMed
    1. Koo T & Kim JS Therapeutic applications of CRISPR RNA-guided genome editing. Brief Funct Genomics 16, 38–45 (2017). - PubMed
    1. Cornu TI, Mussolino C & Cathomen T Refining strategies to translate genome editing to the clinic. Nat Med 23, 415–423 (2017). - PubMed

Publication types