. 2018 Oct;562(7727):373-379.
doi: 10.1038/s41586-018-0436-0. Epub 2018 Sep 12.

The genetic basis and cell of origin of mixed phenotype acute leukaemia

Affiliations

The genetic basis and cell of origin of mixed phenotype acute leukaemia

Thomas B Alexander et al. Nature. 2018 Oct.

Abstract

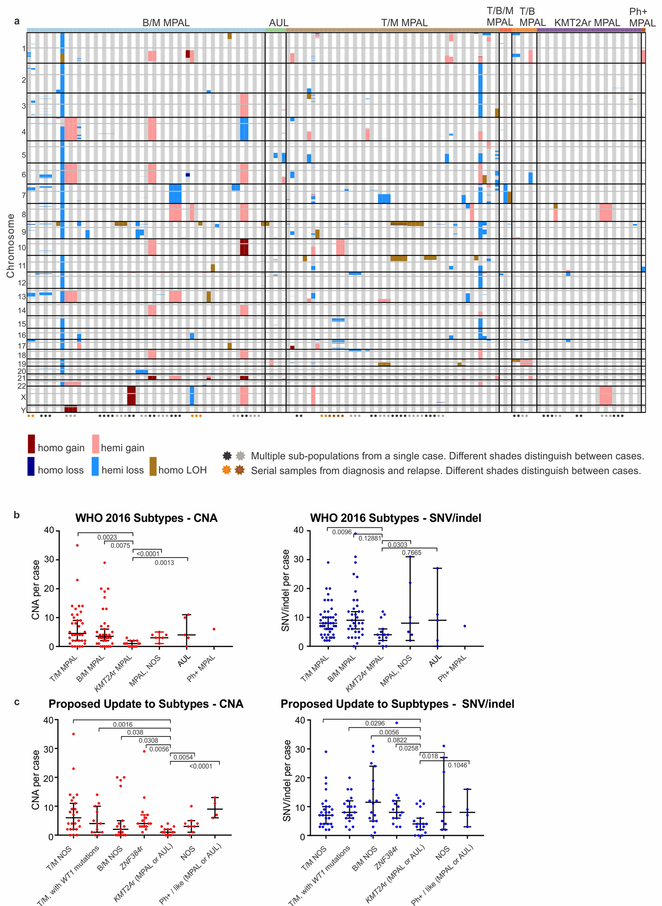
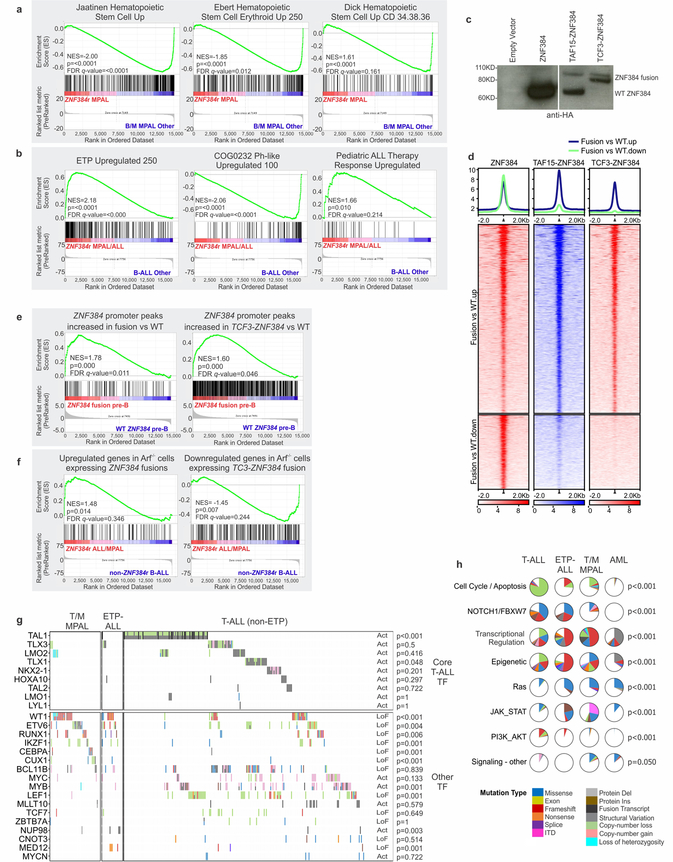
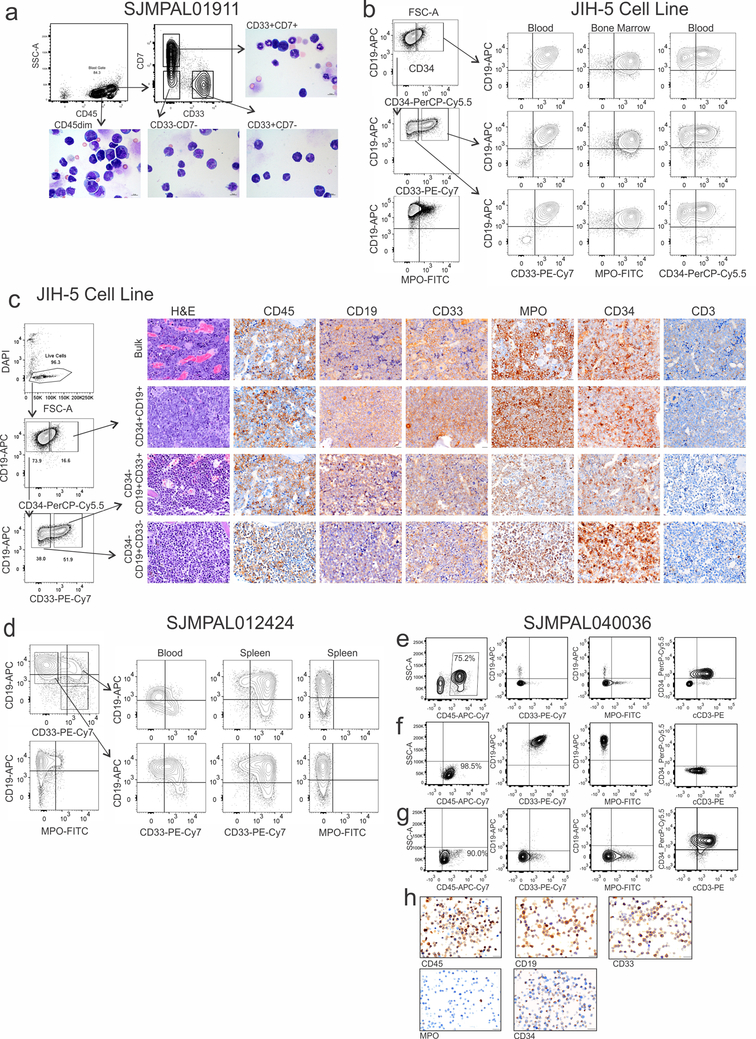
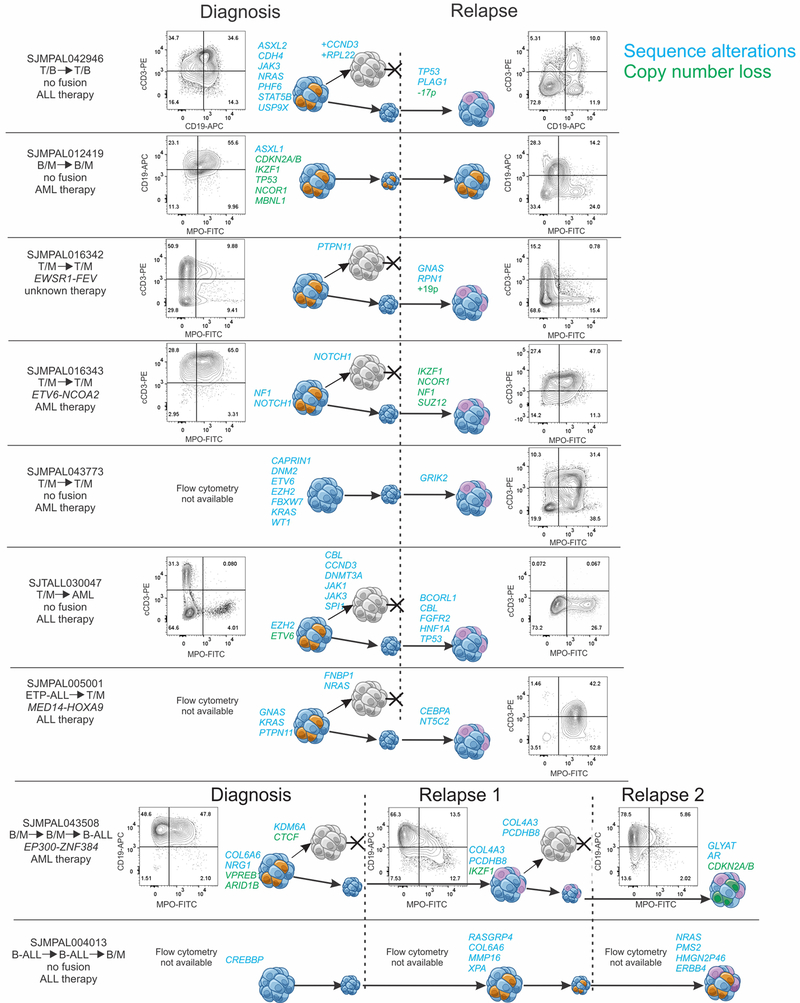
Mixed phenotype acute leukaemia (MPAL) is a high-risk subtype of leukaemia with myeloid and lymphoid features, limited genetic characterization, and a lack of consensus regarding appropriate therapy. Here we show that the two principal subtypes of MPAL, T/myeloid (T/M) and B/myeloid (B/M), are genetically distinct. Rearrangement of ZNF384 is common in B/M MPAL, and biallelic WT1 alterations are common in T/M MPAL, which shares genomic features with early T-cell precursor acute lymphoblastic leukaemia. We show that the intratumoral immunophenotypic heterogeneity characteristic of MPAL is independent of somatic genetic variation, that founding lesions arise in primitive haematopoietic progenitors, and that individual phenotypic subpopulations can reconstitute the immunophenotypic diversity in vivo. These findings indicate that the cell of origin and founding lesions, rather than an accumulation of distinct genomic alterations, prime tumour cells for lineage promiscuity. Moreover, these findings position MPAL in the spectrum of immature leukaemias and provide a genetically informed framework for future clinical trials of potential treatments for MPAL.


Conflict of interest statement

Competing interests: The authors declare no competing interests.

Figures

Extended Data Fig. 1 |
Extended Data Fig. 1 |. Criteria for diagnosis of ALAL.
a, Subtypes of ALAL according to the WHO 2008 criteria and consistent with minor revisions of WHO 2016 criteria. b, Antigen requirements for lineage assignment for MPAL according to WHO 2008 criteria. The 2016 revisions to the WHO classification for ALAL did not change the above categories or requirements. Rather, the revision emphasized that care should be taken before making a diagnosis of B/M MPAL when low-intensity myeloperoxidase is the only myeloid-associated feature. Additionally, the revision emphasized that in cases in which it is possible to resolve two distinct blast populations, it is not necessary that the specific markers be present, but only that each population would meet the criteria for B, T, or myeloid leukaemia. c, Proposed update to WHO ALAL subtypes incorporating critical newer genomic information (new subtypes in red). d, Flow chart of ALAL cohort showing reasons for exclusion and initial diagnosis in cases for which initial ALAL diagnosis occurring at relapse.
Extended Data Fig. 2 |
Extended Data Fig. 2 |. Illustrative immunophenotype and overall survival.
ae, Representative flow cytometry pseudocolour dot plots and contour plots for five different MPAL cases gated on blast area from CD45 and side scatter area (SSC-A). There are a wide variety of immunophenotypic patterns, including classic bilineal phenotype (a), classic biphenotypic case (b), myeloid predominance (c), lymphoid predominance (d) and complex phenotype with more than two immunophenotypic clones (e). f, g, Morphology of cells from two patients with MPAL showing both lymphoid (orange arrow) and myeloid (black arrow) morphology. f, Bone marrow aspirate stained with myeloperoxidase from a patient with T/M MPAL showing multiple blasts with moderate MPO positivity along with one normal granulocyte. g, Peripheral blood haematoxylin and eosin stain from a patient with B/M MPAL. ho, Kaplan–Meier survival curves with overall survival (OS) distributions of patients whose initial diagnosis was MPAL or AUL compared using log-rank tests. At risk numbers for each analysis are provided in the figures. Outcome associations were analysed with the log-rank test. OS according to WHO 2016 subtype (h), initial therapy (i), WT1 status within the T/M MPAL cohort (j), ZNF384 status within the B/M MPAL cohort (k), RAS pathway alteration within the entire cohort (l) and FLT3 alteration within the entire cohort (m). n, OS according to initial therapy for patients with B/M MPAL with ZNF384r. o, OS according to initial therapy for patients with B/M MPAL without ZNF384r. Patients included in this cohort were collected from a range of treatment eras, treatment locations, treatment regimens, and include a range of ages and genomic subtype, limiting the conclusions that may be drawn from these analyses.
Extended Data Fig. 3 |
Extended Data Fig. 3 |. Copy number alterations and mutation burden in ALAL.
a, Map showing spectrum of CNAs, visually recapitulating the data shown in Supplementary Table 10. Twenty-seven patients had SNP arrays for multiple subpopulations, annotated by stars. b, CNA and non-silent SNVs or indels in ALAL subtypes according the WHO 2016 classification. (CNA, T/M MPAL n = 36, B/M MPAL n = 34, KMT2Ar MPAL n = 15, MPAL NOS n = 7, AUL n = 5, Ph+ MPAL n = 1; SNV/indel, T/M MPAL n = 46, B/M MPAL n = 35, KMT2Ar MPAL n = 15, MPAL NOS n = 7, AUL n = 5, Ph+ MPAL n = 1) Patients with KMT2Ar MPAL have a lower mutation burden than those with T/M MPAL or B/M MPAL. c, CNAs and non-silent SNVs or indels in our proposed updated classification system. (CNA, T/M MPAL NOS n = 24, T/M MPAL with WT1 alteration, n = 12, B/M MPAL NOS n = 17, B/M MPAL with ZNF384r n = 15, KMT2Ar MPAL/AUL n = 17, MPAL/AUL NOS n = 9, Ph+/Ph-like MPAL/AUL n = 4; SNV/indel, T/M MPAL NOS n = 27, T/M MPAL with WT1 alteration, n = 19, B/M MPAL NOS n = 18, B/M MPAL with ZNF384r n = 15, KMT2Ar MPAL/AUL n = 17, MPAL/AUL NOS n = 9, Ph+/Ph-like MPAL/AUL n = 4) Data shown as median ± 95% confidence interval. Comparisons assessed by two-sided unpaired t-test. One data point is outside the SNV/indel graph for the B/M NOS subtype (1 patient with 167 SNV/indels). SNV/indels per case shown for cases with DNA sequencing completed.
Extended Data Fig. 4 |
Extended Data Fig. 4 |. Complete ALAL mutation oncoprint.
Mutation spectrum of ALAL.
Extended Data Fig. 5 |
Extended Data Fig. 5 |. Features of MPAL genomic analysis.
a, WT1 alterations were observed in 28 patients, commonly as frameshift mutations (31/47 mutations) in exon 7 (29/47 mutations) and were frequently biallelic. In 16 patients, two clonal alterations were detected, and in 9 patients the locations of the alteration were encompassed by the same sequencing read, providing definitive demonstration that the mutations were in trans. Additionally, one patient (SJMPAL043773) had a frameshift mutation and copy number loss of the second allele, while another had a frameshift mutation with copy-neutral loss of heterozygosity (SJMPAL040036). Data are shown for two representative patients with MPAL, showing double-hit mutations on WT1. The read alignment view was generated by Samtools. The reference human genome is on the first row and sequence reads are aligned below, with matched nucleotides as dots (forward strand match) and commas (reverse strand match) and mismatched ones showing the differences. Alignment gaps are shown as asterisks. Adjacent mutations are shown on different sequence reads, indicating that the mutations are on different alleles. b, Frequency of alteration by pathway analysis and MPAL subtype. The similarity of somatic alteration prevalence in different leukaemia subtypes was evaluated by two-sided Fisher’s exact test (n = 100 biologically independent cases). See also Supplementary Tables 12, 13 for numbers and P values for each gene and pathway. c, Schematic representation of ZNF384r observed in B/M MPAL. NLS, nuclear localization signal; TAZ1, transcriptional adaptor zinc-binding; LZ, leucine rich domain; QA, glycine/alanine repeat. d, Fluorescence-activated sorting schema in a representative case with a ZNF384r, and variant allele frequency of SNVs/indels present in the respective sorted subpopulations, demonstrating genomic similarity of the sorted populations. e, tSNE plot of RNA-seq gene expression of all patients with ZNF384r show no clear segregation of B/M MPAL and B-ALL cases. f, FLT3 gene expression in subtypes of ALAL showing that patients with ZNF384r B/M MPAL have high levels of FLT3 expression. As in patients with KMT2Ar, this occurs in the absence of FLT3 alteration in most cases. By contrast, high levels of FLT3 expression in T/M MPAL appears to be driven by FLT3 alterations. Data shown as median ± 95% confidence interval. Comparisons assessed by unpaired t-test, two sided. T/M MPAL FLT3 wild type n = 18, B/M MPAL NOS n = 10, T/M MPAL with FLT3 alteration n = 16, B/M MPAL NOS n = 17, B/M MPAL with ZNF384r n = 15, KMT2Ar MPAL/AUL n = 11, MPAL/AUL NOS n = 7, Ph+/Ph-like MPAL/AUL n = 5, KMT2A-like MPAL/AUL n = 8.
Extended Data Fig. 6 |
Extended Data Fig. 6 |. ZNF384r leukaemia analysis and T/M MPAL mutation comparisons.
a, GSEA of ZNF384r B/M MPAL versus non-ZNF384r B/M MPAL. HSC gene sets are negatively enriched, supporting the proposed update to MPAL subtypes in which ZNF384r leukaemia has distinct biology compared with other B/M MPAL cases,,. b, GSEA of all ZNF384r cases versus other B-ALL cases indicates immaturity of this subtype compared to B-ALL, with positive enrichment for genes upregulated in ETP-ALL (a stem cell leukaemia), and negative enrichment for genes upregulated in Ph-like ALL in other B-ALL cases. ZNF384r acute leukaemia is also enriched for genes upregulated in patients with detectable minimal residual disease at end of induction,,. c, Western blot analysis to validate expression of ZNF384, TAF15–ZNF384, and TCF3–ZNF384 in transduced Arf−/− pre-B cells. Proteins contain an HA epitope tag and are detected by anti-HA antibody. d, Heatmap showing the ChIP–seq signal, centred on ZNF384 peaks, of wild-type (WT) ZNF384 compared to TAF15–ZNF384 and TCF3–ZNF384. Middle, peaks with increased binding of fusion proteins compared to wild-type. Bottom, peaks with decreased binding of the fusion proteins compared to wild-type. e, GSEA showing enrichment of genes whose promoters exhibit increased binding by ZNF384 fusions in the GEP of ZNF384r versus WT pre-B cells. f, GSEA showing similarity of the GEP of mouse pre-B cells expressing ZNF384r to the GEP of human ZNF384r leukaemia cells, supporting the notion that perturbation of ZNF384 binding contributes to deregulated gene expression in human ZNF384r leukaemia. g, Oncoprint of mutations in transcription factor genes across T/M MPAL (n = 49), ETP-ALL (n = 19) and T-ALL (other) (n = 245), showing lack of TAL1 alterations in T/M MPAL and few core T-ALL transcription factor alterations in T/M MPAL or ETP-ALL. The association of leuekmia subtype with individual transcription factor alterations was evaluated using two-sided Fisher exact test. Act, activating mutation; LoF, loss-of-function mutation. h, Gene pathway analyses showing similarity of ETP-ALL and T/M MPAL, specifically in frequency of mutations in pathways regulating cell cycle or apoptosis, transcriptional regulation, and signalling pathways. The similarity of somatic alteration prevalence in different leukaemia subtypes was evaluated by two sided Fisher’s exact tests in these four subtypes (T/M MPAL n = 49, ETP-ALL n = 19, non-ETP T-ALL n = 245, AML n = 197).
Extended Data Fig. 7 |
Extended Data Fig. 7 |. MPAL subpopulation analysis and methylation analysis.
a, Results of genomic analysis of the 50 patients with sorted subpopulations with WGS or WES results. Listed here are all genes with mutations that were either recurrent in the ALAL cohort or were in known cancer consensus genes. *CNA results also available for sorted subpopulations in these cases. bd, Methylation analysis of MPAL, comparison with acute leukaemia and normal lymphocytes. The top 5,000 probes with highest mean absolute deviation were used to assess the clustering through a 2D t-SNE plot and heatmap with Pearson correlation clustering. See Supplementary Table 37 for sample details. b, Heatmap of all samples used for methylation analysis showing the general alignment of samples by leukaemia phenotype with B/M cases clustering with B-ALL, T/M MPAL, ETP-ALL cases together, and AML cases clustering separately. c, tSNE analysis of the same samples as in the top heatmap, showing general alignment by leukaemia phenotype with B/M cases clustering with B-ALL, T/M MPAL, ETP-ALL cases together, and AML cases clustering separately. d, Heatmap of all MPAL cases, again showing some clustering by phenotype between B/M and T/M cases. Subpopulations sorted by distinct immunophenotype in MPAL cases clustered tightly with samples from the same patient, rather than with samples with similar phenotype from a different patient. e, Methylation analysis of sorted subpopulations from 11 patients with MPAL, demonstrating that methylation profiles cluster by patient and not by immunophenotype lineage.
Extended Data Fig. 8 |
Extended Data Fig. 8 |. Xenograft analysis.
a, Flow cytometry analysis of bulk leukaemic cells from patient SJMPAL011911 before sorting, and cytospins from bone marrow samples from representative primary recipient mice transplanted with different leukaemia subpopulations or bulk, confirming the presence of leukaemic blasts from each engrafted population. Scale bars, 10 μm. b, Phenotypic subpopulations from JIH-5 cells in the first column were sorted and injected into NSG-SGM3 mice. Remaining plots show the immunophenotypes of engrafted leukaemia propagated from each sorted subpopulation, demonstrating recapitulation of biphenotypic leukaemia from each. c, Flow cytometry analysis of bulk JIH-5 cells prior to sorting (left) and haematoxylin and eosin staining and IHC labelling for human CD45, CD19, CD33, MPO, CD34 and CD3 in sternum samples from representative primary recipient mice transplanted with different leukaemia subpopulations or bulk. Scale bars, 20 μm. d, Phenotypic subpopulations from patient SJMPAL012424 were sorted (left) and injected into irradiated NSG-SGM3 mice. Remaining plots show the immunophenotypes of engrafted leukaemia from each starting subpopulation, demonstrating recapitulation of mixed phenotype leukaemia from two sorted subpopulations. e, Flow cytometry analyses of bone marrow cells from an engrafted primary mouse transplanted with leukaemia cells from a patient with T/M MPAL (SJMPAL040036). f, g, Flow cytometry analyses of representative engrafted secondary recipient mice transplanted with leukaemia cells from the mouse in e showing lineage plasticity with mice developing an emerging CD19+CD33+ population (f) and other mice recapitulating the immunophenotype in the primary recipient (g). h, IHC labelling for human CD45, CD19, CD33, MPO and CD34 from harvested and fixed spleen cells from a representative secondary recipient mouse showing high expression of CD19 and CD33 and thus confirming the leukaemic lineage plasticity. Scale bars are 20 μm.
Extended Data Fig. 9 |
Extended Data Fig. 9 |. Haematopoietic progenitor cell analysis.
a, Progenitor cell sorting scheme for diagnosis sample from patient SJMPAL040028. Progenitor populations were all gated on CD19CD33CD34+ and sorted into HSC (CD38CD34+CD90+CD45RA; 2 replicates: HSC_1 and HSC_2); MPP (CD38CD34+CD90CD45RA); MLP (CD38CD34+CD45RA+); megakaryocyte erythroid progenitors/common myeloid progenitors (CD38+CD34+CD7CD10CD45RA); and granulocyte monocyte progenitor (CD38+CD34+CD7CD10CD45RA+) populations. b, Blast cell sorting scheme for diagnosis sample from patient SJMPAL040028. Cells were gated on CD45dim and sorted into four different immunophenotypic populations (CD33+CD19+CD10; CD33+CD19modCD10; CD33+CD19CD10; and CD33CD19). c, Sanger sequencing electropherograms for the mutational status of DNAH17, NDST2 and MYCN and for the fusion TCF3–ZNF384 in isolated progenitor and blast populations from patient SJMPAL040028 at diagnosis. The identification of somatic missense mutations and TCF3–ZNF384 fusion in early haematopoietic progenitors indicate that the ambiguous phenotype of MPAL is the result of the acquisition of alterations within an immature haematopoietic progenitor cells.
Extended Data Fig. 10 |
Extended Data Fig. 10 |. Phenotypic and genotypic evolution from diagnosis to relapse.
Patients for which diagnosis and relapse pairs with matching non-tumour controls are available show recapitulation of the diagnostic multilineage phenotype in some cases and phenotype plasticity in others. The first column shows the case ID, the leukaemia subtype at diagnosis and then subsequent relapse, the in-frame fusion if present, and initial therapy received by the patient. Flow plots are shown of cells gated on CD45dim versus SSC-Alow. The diagram depicts the inferred clonal evolution based on WES and/or WGS and SNP array data (where available). Mutated genes (either recurrent in ALAL cohort or known cancer consensus genes) are listed. The genes beside the initial diagnostic cell cluster remained present at relapse. The grey cells represent clones that were extinguished with therapy. The genes in the relapse column represent mutations that were gained at relapse.
Fig. 1 |
Fig. 1 |. Genomic overview of ALAL.
a, Distribution of the most frequently altered genes by MPAL subtype. Frequency of mutations in the different MPAL subtypes were compared by two-sided Fisher exact tests; **P < 0.001, *0.001 < P < 0.01 (see Supplementary Table 13 for numbers for each group and P values for each gene). #KMT2A alterations were present in all cases in the KMT2Ar subgroup. b, Oncoprint of mutations in transcriptional regulation and cell cycle/apoptosis pathways. c, Oncoprint of mutations in signalling pathways. Mutations altering genes involved in transcription and signalling pathways in these subtypes are distinct.
Fig. 2 |
Fig. 2 |. Genomic comparisons across leukaemia subtypes.
a, Mutations observed in ZNF384r B-ALL (n = 19) and ZNF384r B/M MPAL (n = 15), showing similar mutational profile between the two phenotypically defined subtypes. b, tSNE plot of top 1,000 variably expressed genes of ALAL, B-ALL, T-ALL, ETP-ALL, AML, and normal lymphocytes, showing that B/M MPAL has a GEP more similar to B-ALL than AML, and T/M MPAL more similar to ETP-ALL than AML. ZNF384r cases cluster together, without separation based upon B/M MPAL or B-ALL phenotype. Cases in the ALAL-other category, including KMT2Ar MPAL, AUL, and MPAL NOS, are intermixed across the transcriptional continuum, primarily between AML and B-ALL clusters. c, Depiction of the frequency of mutations of the five most frequently altered genes from each disease cohort, demonstrating that T/M MPAL (n = 49) and ETP-ALL (n = 19) share a high frequency of mutations in ETV6, WT1, EZH2 and FLT3, while lacking the most characteristically mutated genes in T-ALL (n = 245) and AML (n = 197).
Fig. 3 |
Fig. 3 |. Plasticity is independent of mutation.
a, Flow cytometric scatter plots of representative cases of MPAL, showing the primary lymphoid marker (CD19 or cytoplasmic CD3) and myeloid marker (myeloperoxidase or lysozyme) used for sorting subpopulations. P1–P4 represent sorted subpopulations subjected to DNA sequencing. b, Variant allele frequency (VAF, represented by length of blue bar) from each of the purified populations in a demonstrating concordance of mutational VAF of SNV or indel between distinct immunophenotypically defined subpopulations. c, Phenotypic subpopulations from case SJMPAL011911 were sorted (first column) and injected into irradiated NSG-SGM3 mice. Key gene alterations are show above the flow scatter plots (ITD, internal tandem duplication). Remaining plots show the immunophenotype of harvested bone marrow of engrafted leukaemia from each starting subpopulation, demonstrating recapitulation of mixed phenotype leukaemia from two sorted subpopulations. The third subpopulation (CD7, CD33+) also engrafted with hCD45+ cells and morphologic leukaemia, but with an undifferentiated immunophenotype. ND=not detected
Fig. 4 |
Fig. 4 |. Model of MPAL leukaemogenesis.
a, Schematic and simplified representation of human haematopoietic hierarchy showing HSCs, multipotent progenitors (MPPs), multilymphoid progenitors (MLPs), megakaryocyte erythroid progenitors (MEPs), common myeloid progenitors (CMPs), granulocyte monocyte progenitors (GMPs), and mature lymphocytes: B cells, T cells, and NK cells. b, Summary of the presence of ZNF384r and additional somatic alterations in isolated stem/progenitor, mature and blast cell populations showing the presence of each alteration throughout haematopoietic development. c, d, Potential models of bilineal MPAL leukaemogenesis. Different colours represent clones with different genomic alterations. c, A model of MPAL in which phenotypic divergence is driven by acquisition of secondary genomic alterations (yellow and green cells), which is inconsistent with the results of the current study. d, A model of MPAL showing that necessary and sufficient mutations are acquired in an early haematopoietic progenitor that retains myeloid and lymphoid potential, thus propagating similar mutation profiles in the different phenotypes. The results of the current study support this model of leukaemogenesis.

References

    1. Gerr H et al. Acute leukaemias of ambiguous lineage in children: characterization, prognosis and therapy recommendations. Br. J. Haematol 149, 84–92 (2010). - PubMed
    1. Rubnitz JE et al. Acute mixed lineage leukemia in children: the experience of St Jude Children’s Research Hospital. Blood 113, 5083–5089 (2009). - PMC - PubMed
    1. Matutes E et al. Mixed-phenotype acute leukemia: clinical and laboratory features and outcome in 100 patients defined according to the WHO 2008 classification. Blood 117, 3163–3171 (2011). - PubMed
    1. Maude SL et al. Efficacy of JAK/STAT pathway inhibition in murine xenograft models of early T-cell precursor (ETP) acute lymphoblastic leukemia. Blood 125, 1759–1767 (2015). - PMC - PubMed
    1. Zhang J et al. The genetic basis of early T-cell precursor acute lymphoblastic leukaemia. Nature 481, 157–163 (2012). - PMC - PubMed

Publication types