. 2018 Sep;561(7724):547-550.
doi: 10.1038/s41586-018-0515-2. Epub 2018 Sep 12.

Touch and tactile neuropathic pain sensitivity are set by corticospinal projections

Affiliations

Touch and tactile neuropathic pain sensitivity are set by corticospinal projections

Yuanyuan Liu et al. Nature. 2018 Sep.

Abstract

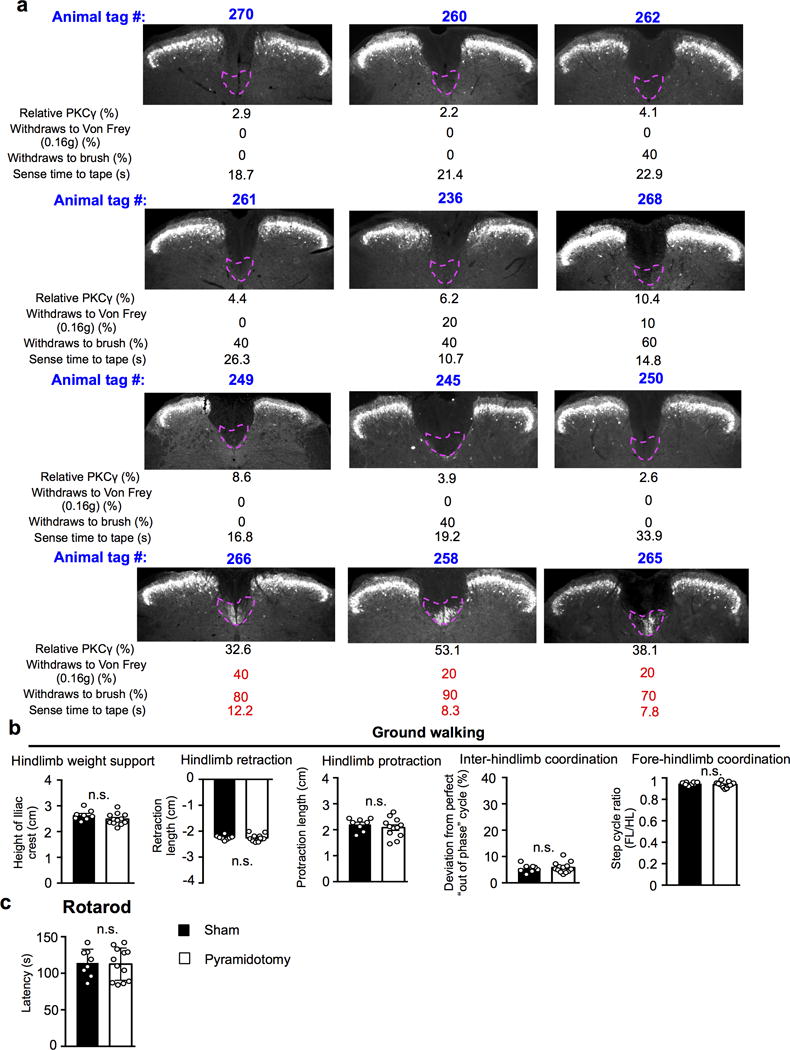
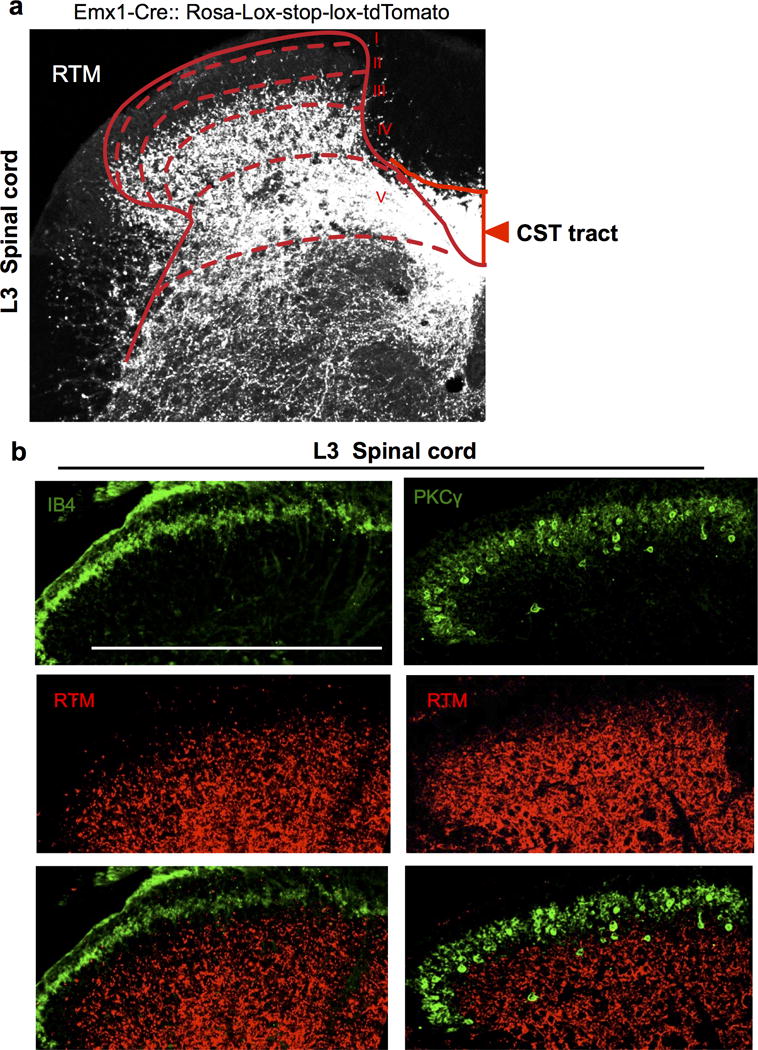
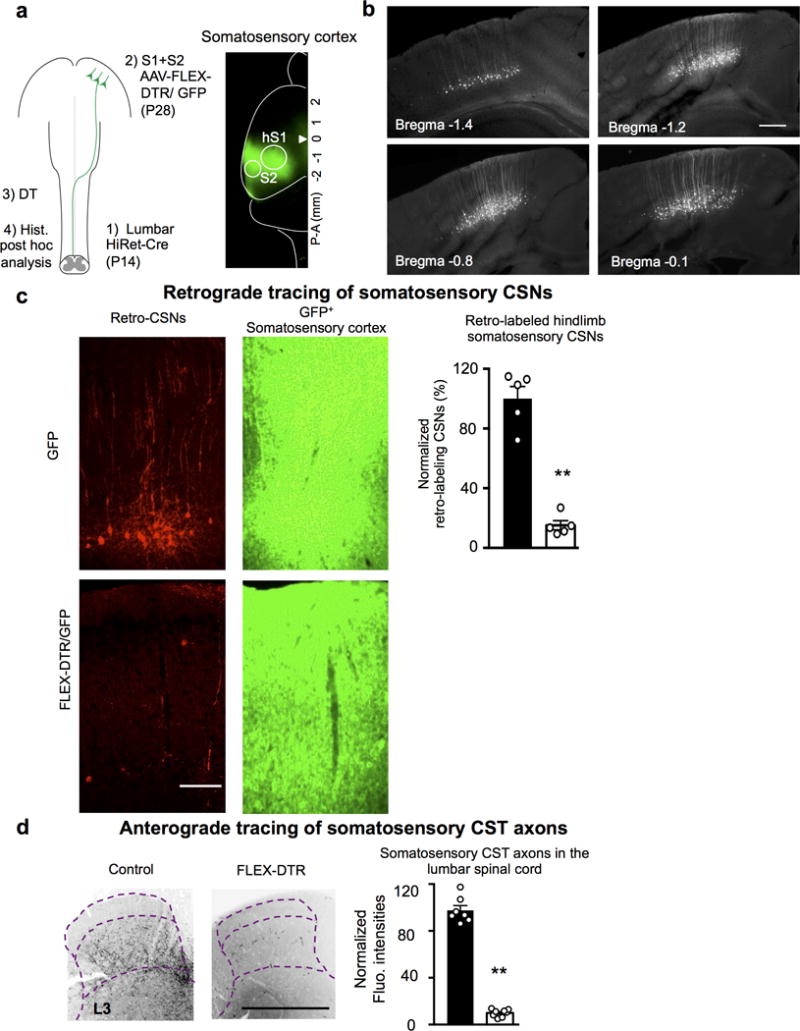
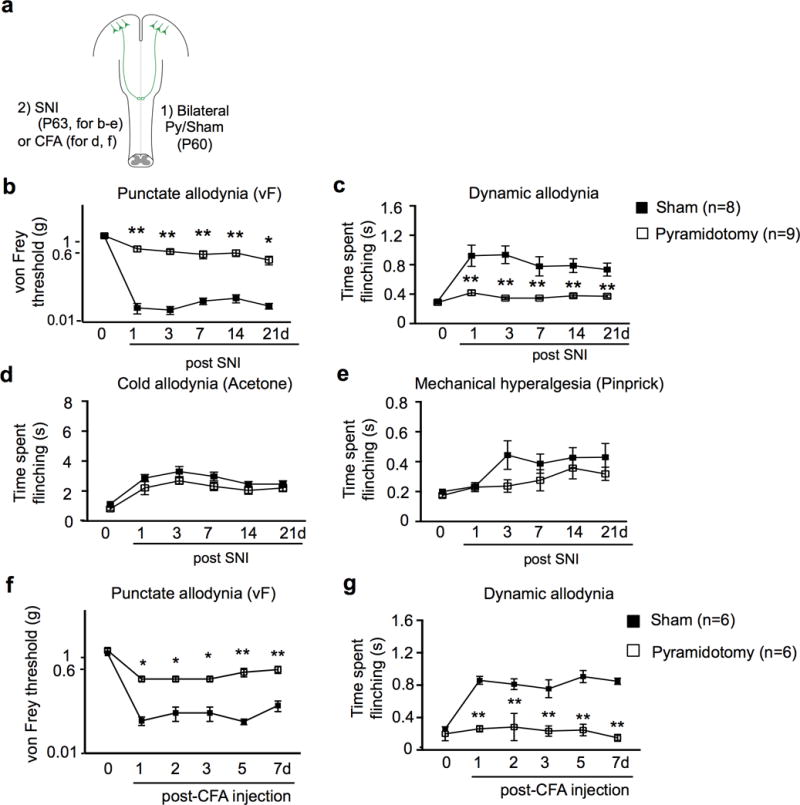
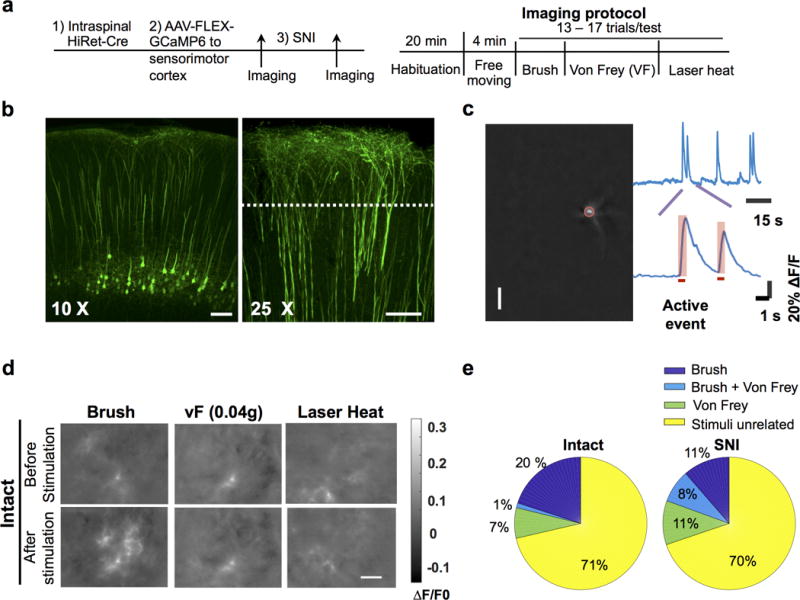
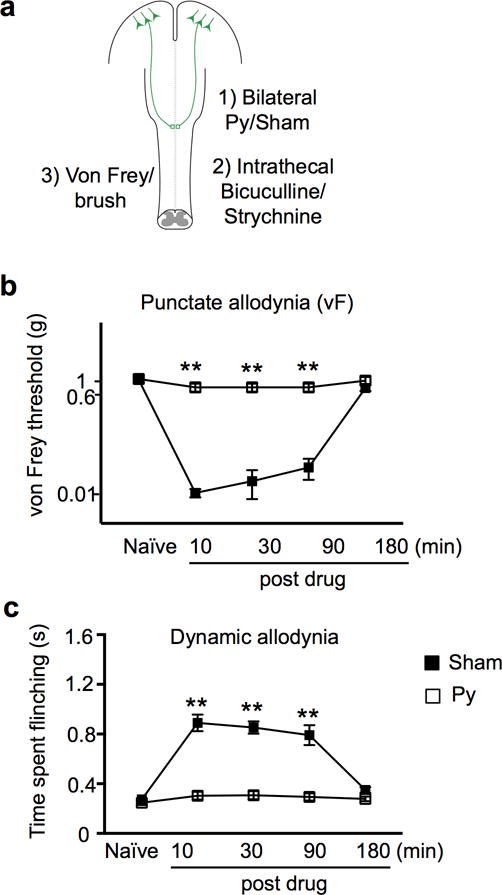
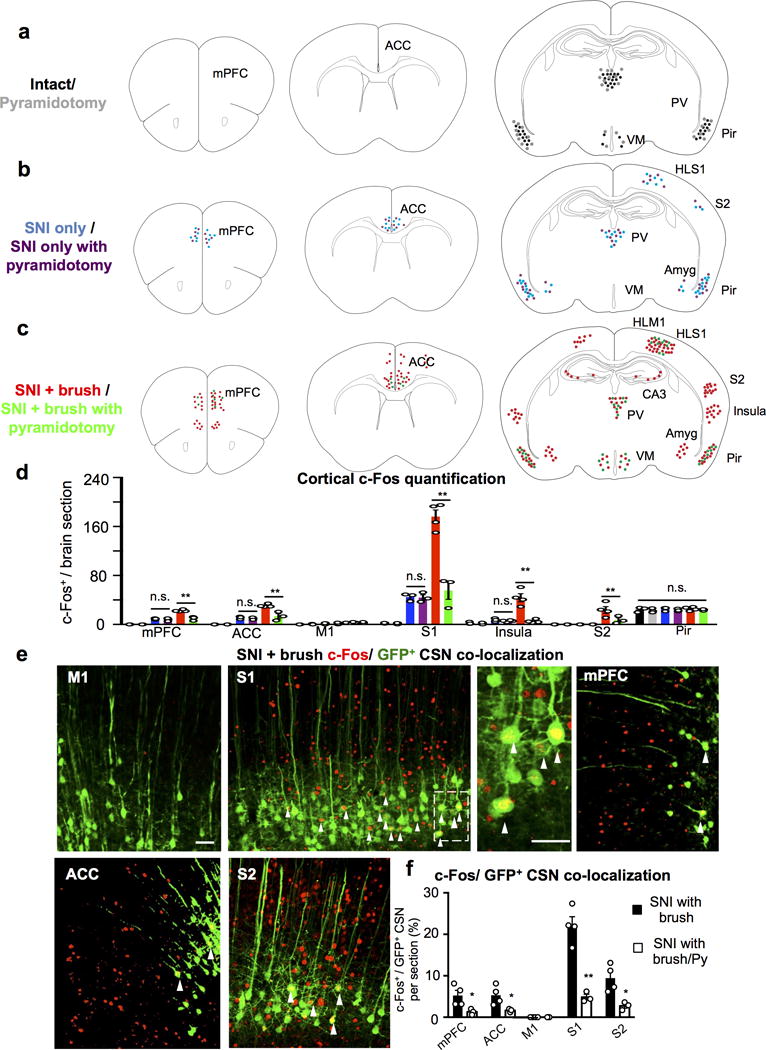
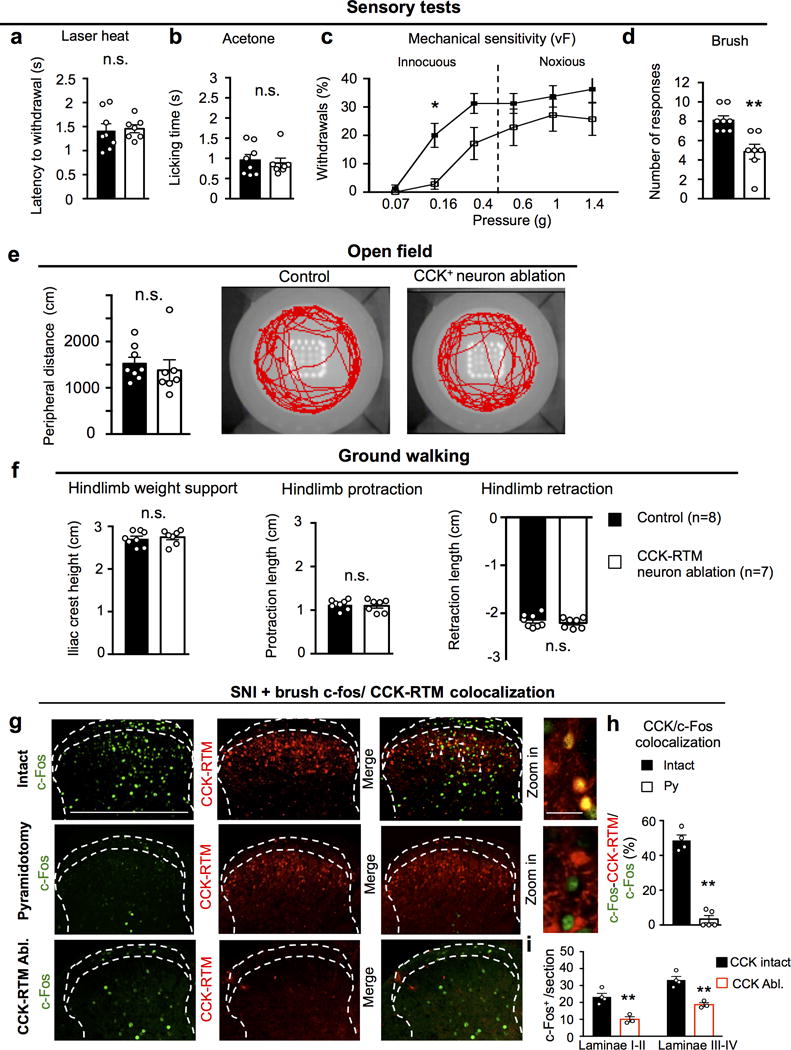
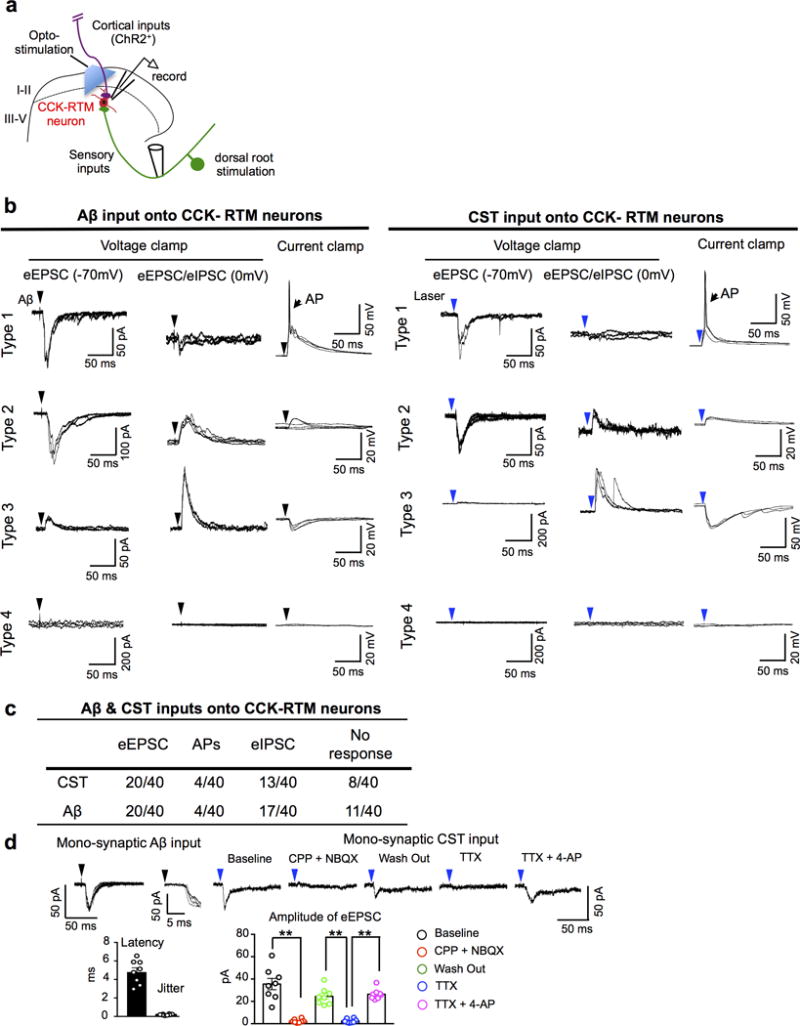
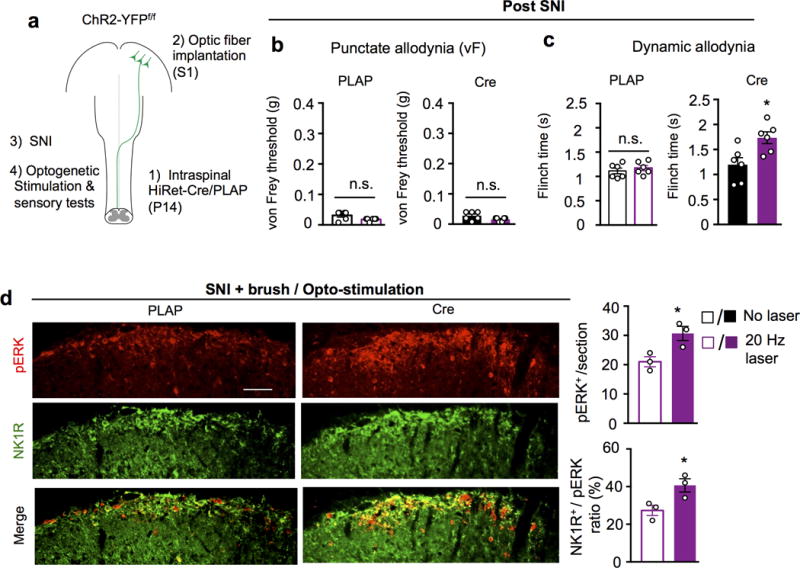
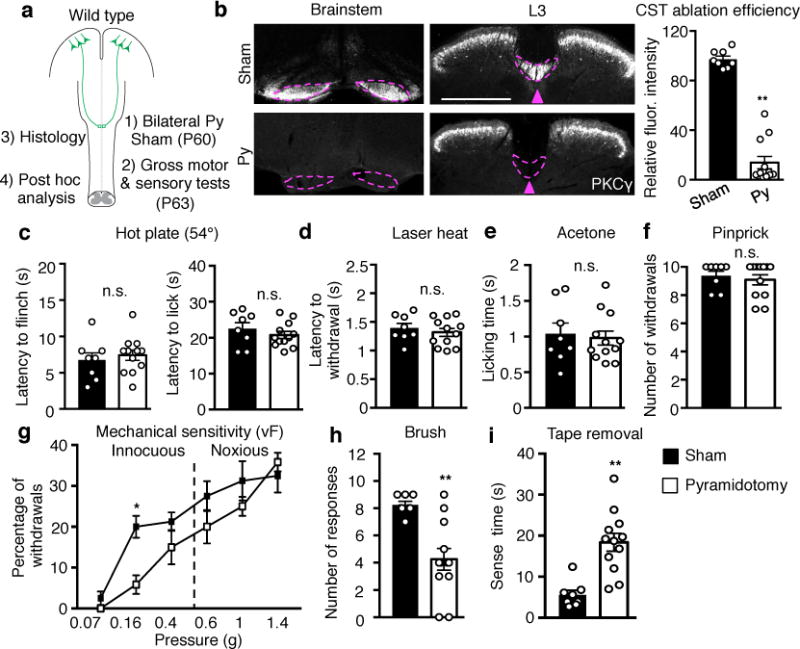
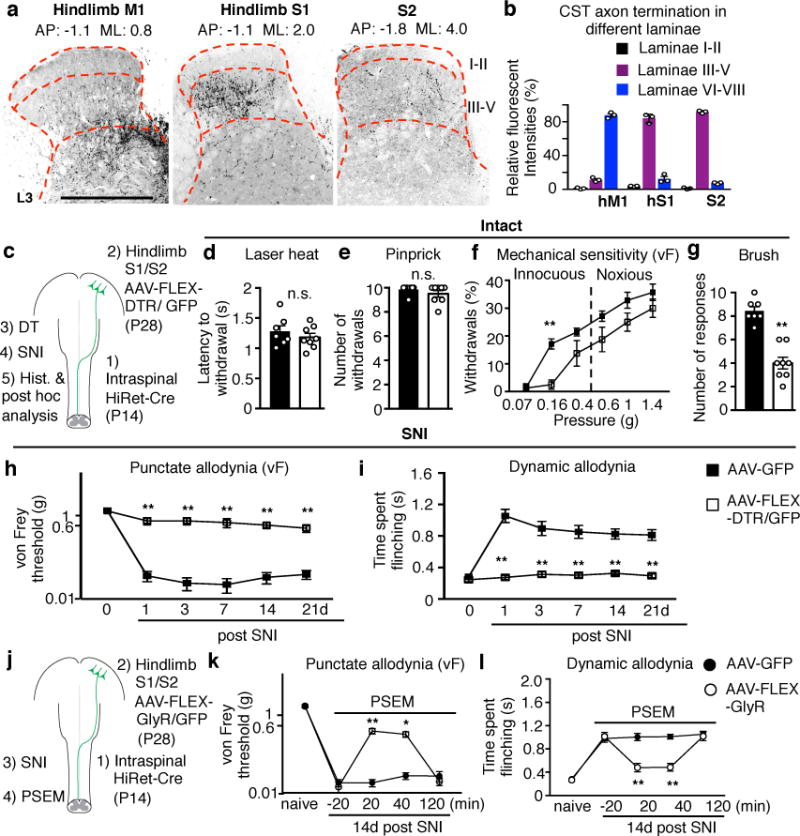
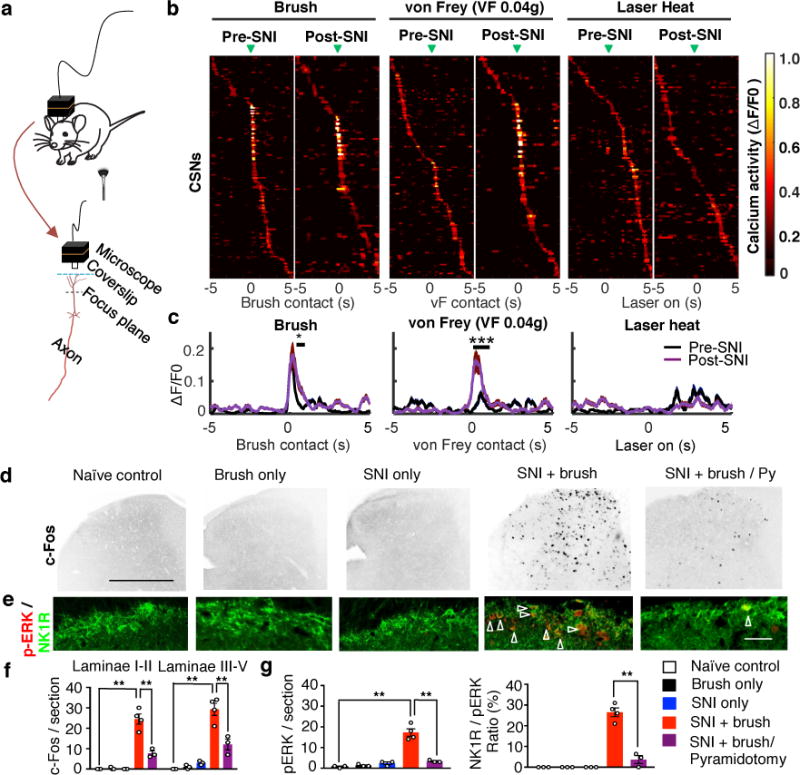
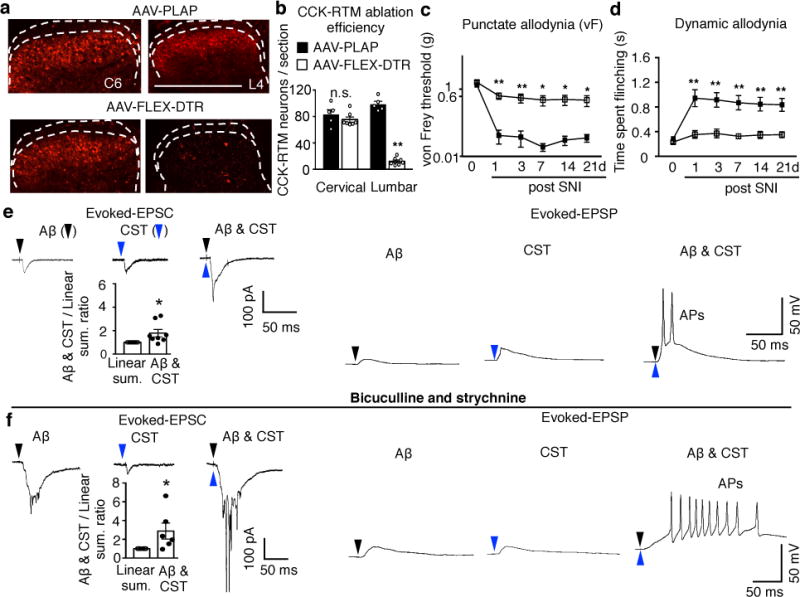
Current models of somatosensory perception emphasize transmission from primary sensory neurons to the spinal cord and on to the brain1-4. Mental influence on perception is largely assumed to occur locally within the brain. Here we investigate whether sensory inflow through the spinal cord undergoes direct top-down control by the cortex. Although the corticospinal tract (CST) is traditionally viewed as a primary motor pathway5, a subset of corticospinal neurons (CSNs) originating in the primary and secondary somatosensory cortex directly innervate the spinal dorsal horn via CST axons. Either reduction in somatosensory CSN activity or transection of the CST in mice selectively impairs behavioural responses to light touch without altering responses to noxious stimuli. Moreover, such CSN manipulation greatly attenuates tactile allodynia in a model of peripheral neuropathic pain. Tactile stimulation activates somatosensory CSNs, and their corticospinal projections facilitate light-touch-evoked activity of cholecystokinin interneurons in the deep dorsal horn. This touch-driven feed-forward spinal-cortical-spinal sensitization loop is important for the recruitment of spinal nociceptive neurons under tactile allodynia. These results reveal direct cortical modulation of normal and pathological tactile sensory processing in the spinal cord and open up opportunities for new treatments for neuropathic pain.


Conflict of interest statement

Author information The authors declare no competing financial interests. Readers are welcome to comment on the online version of the paper.

Figures

Extended Data Figure 1
Extended Data Figure 1. Effects on tactile behaviors and gross locomotion in mice with pyramidotomy
a, Correlation between CST ablation and tactile behaviors in mice with pyramidotomy. For individual animals, tag number, image and quantification of L3 spinal cord sections stained with anti- PKCγ antibody showing remaining CST axons, percentage of withdrawal response to low-threshold von Frey (0.16g) and light brush, and sense time to the tape were present in the group receiving pyramidotomy. b-c, Performance on over ground walking (b, P=0.14, hindlimb weight support; P=0.81, hindlimb retraction; P=0.41, hindlimb protraction; P=0.81, inter-limb coordination; P=0.20, fore-hindlimb coordination), and rotarod test (c, P=0.87) in mice with sham (n=8) or pyramidotomy (n=12). n.s.: no statistical significance. Two-sided student’s t-test. Data are presented as mean ± SEM.
Extended Data Figure 2
Extended Data Figure 2. CST axon termination in the lumbar spinal cord
a-b, Representative transverse spinal section (L3) from an Emx1-tdTomato (red) reporter line (a). Sections were co-stained with IB4 (green), a lamina IIi marker and anti- PKCγ, a laminae IIi/III marker in the spinal dorsal horn (b). Scale bar: 500 μm. For a, b, 3 and 4 animals showed similar results, respectively.
Extended Data Figure 3
Extended Data Figure 3. Evaluation of ablation efficiency for somatosensory CSNs by P14 intraspinal injection
a, Left: Schematic of regional CSN ablation by P14 lumbar (T13-L6) intraspinal injection. Right: Representative image (n=8 animals with similar results) of the cortex with GFP+ areas covering hindlimb S1/S2. b, Representative images (n=6 animals with similar results) of cortical sections showing retrogradely labeled hindlimb CSNs by a lumbar (T13-L6) intraspinal HiRet-GFP injection at P14. Scale bar: 100 μm. c, To assess ablation efficiency, at the end point, retrograde-targeting rAAV-mCherry was injected into the lumbar spinal cord in some animals. Representative images of cortical sections showing retrogradely labeled mCherry+ CSNs (left) within the GFP+ cortical areas (right) (S1/S2) in control or AAV-FLEX-DTR injected animals with quantification (normalized to those in controls as 100). **, P < 0.01 (P<0.0001), two-sided student’s t-test. n=5, 5 for control or AAV-FLEX-DTR injected mice, respectively. Scale bar: 100 μm. d, Representative images of transverse lumbar spinal cord sections showing residual CST axons labeled by GFP (from AAV-GFP co-injected to S1/S2 with AAV-FLEX-DTR) in control or S1/S2 CSN ablated animals with quantification. **, P < 0.01 (P<0.0001), two sided student’s t-test. n= 7,8 for control or AAV-FLEX-DTR injected mice, respectively. Scale bar: 500 μm. Data are presented as mean ± SEM.
Extended Data Figure 4
Extended Data Figure 4. Mechanical allodynia induced by SNI or CFA injection, but not cold allodynia and mechanical hyperalgesia induced by SNI, is compromised in mice with pyramidotomy
a, Schematic drawing of experimental paradigm. b-e, Measurement of punctate (b) and dynamic (c) mechanical allodynia, cold allodynia (d) or mechanical hyperalgesia (e) after SNI in mice receiving sham (n=8), or pyramidotomy (n=9) surgeries at 1-21 days post SNI. b: P<0.0001, P<0.0001, P=0.0012,P=0.0004,P=0.041; c: P<0.0001, P<0.0001, P=0.0004,P=0.001, P=0.0045; d: P=0.26, P=0.33, P=0.29, P>0.99, P>0.99; e: P>0.99,P=0.15,P=0.56,P>0.99,P=0.74 for 1d, 3d, 7d, 14d, and 21d, respectively. f-g, Measurement of punctate (f) and dynamic (g) mechanical allodynia in mice receiving sham (n=6), or pyramidotomy (n=6) surgeries at 1-7 days post hindpaw CFA injection. f: P=0.01, P=0.01, P=0.01, P<0.0001, P<0.0001; g: P<0.0001 for 1, 2, 3, 5, and 7d, respectively. Two-way repeated measures ANOVA followed by Bonferroni correction. Data are presented as mean ± SEM.
Extended Data Figure 5
Extended Data Figure 5. Calcium imaging of CSN activity in intact and SNI mice
a, Schematic of experimental procedures. b, Confocal fluorescence images of coronal brain sections showing specific expression of GCaMP6s in CSNs. Left, a 10X image showing labeled CSN soma and dendrites; Right, a 25X image showing the magnified view of apical dendritic trunks. Dotted line: the expected focal plane of head-mounted microscope. Scale bar: 100 μm. c, Procedures for identifying the active events of CSN dendrites. Left: an example of dendrites identified from a calcium movie by ICA analysis. The brightest spot in a dendritic tree, corresponding to the trunk (highlighted by a red circle), is used as region of interest for temporal signal analysis. The upper trace: the temporal signal of the dendrite. The bottom trace: magnified calcium events. The horizontal bar indicates the rising phase of the calcium event, which is associated with neuronal activation and used in subsequent analysis. d, Example calcium movie frames showing dendritic activities of hindlimb S1 CSNs upon different sensory stimuli in intact mice. In these examples, brush stimuli activated CSNs, whereas von Frey (0.04g) and laser heat did not. Calcium signals are expressed as ΔF/F0 (F0 is the time average of the whole movie). For b, d, the experiments were repeated independently 4 times with similar results. e, Pie charts showing the proportions of neurons responded to brush, Von Frey or both brush and Von Frey in pre-SNI and post-SNI conditions. Few neurons responded to both stimuli pre-SNI, but this overlapping proportion increased post-SNI, potentially reflecting disinhibited sensory pathways after SNI.
Extended Data Figure 6
Extended Data Figure 6. Mechanical allodynia induced by spinal disinhibition (bicuculline/strychnine) is compromised in mice with pyramidotomy
a, Schematic drawing of experimental paradigm. b-c, Measurement of punctate (b) and dynamic (c) mechanical allodynia after intrathecal injection of bicuculline/strychnine in mice receiving sham (n=6), or pyramidotomy (n=7). **, P < 0.01 (P<0.0001 for both b and c at 10, 30, and 90 min post drug), two-way repeated measures ANOVA followed by Bonferroni correction. Data are presented as mean ± SEM.
Extended Data Figure 7
Extended Data Figure 7. Neuronal activity in cortical and subcortical areas upon light touch after SNI
a-c, Cartoon drawing of c-Fos immunostaining in intact (a), SNI only (b) and SNI with light brush (c) conditions from control and mice with pyramidotomy. mPFC: medial prefrontal cortex, ACC: anterior cingulate cortex, S1HL: hindlimb primary somatosensory cortex, S2: secondary somatosensory cortex, Pir: piriform cortex, PV: periventricular nucleus of the thalamus, VM: ventromedial nucleus of the hypothalamus, and Amyg: amygdala. d, Quantification of c-Fos+ cells in multiple cortical areas in intact (with CSN: n=3, with pyramidotomy: n=3), SNI only (with CSN: n=3, with pyramidotomy: n=3), SNI with light brush (with CSN: n=4, with pyramidotomy, n=3) mice. **, P < 0.01, n.s., no statistical significance. PFC SNI only with or without Py: P>0.99; PFC SNI+ brush with or without Py: P<0.0001; ACC SNI only with or without Py: P>0.99; ACC SNI+ brush with or without Py: P=0.0002; M1 SNI only with or without Py: P>0.99; M1 SNI+ brush with or without Py: P>0.99; S1 SNI only with or without Py: P>0.99; S1 SNI+ brush with or without Py: P<0.0001; Insula SNI only with or without Py: P>0.99; Insula SNI+ brush with or without Py: P<0.0001; S2 SNI+ brush with or without Py: P=0.0075; Pir all conditions (ANOVA): P=0.82. One Way ANOVA followed by Bonferroni correction. e, Representative images of multiple cortical areas stained with c-Fos (red) and GFP (green, HiRet-GFP injection) in SNI mice with light brush. Arrowheads mark the co-localization of c-fos and GFP+ CSNs. Scale bar: 20 μm. f, Quantification of c-Fos+/GFP+ CSN co-localization in multiple cortical areas in animals with SNI following light brush without (n=4) or with pyramidotomy (Py, n=3). * or **, P < 0.05 or P < 0.01, P=0.03, 0.04, 0.0009, 0.02 for mPFC, ACC, S1, and S2, respectively. two-sided student’s t test. Data are presented as mean ± SEM.
Extended Data Figure 8
Extended Data Figure 8. Tactile sensitivity and dorsal horn neuronal activation post SNI, but not nociceptive response or gross locomotion, is reduced in mice with lumbar CCK+ interneuron ablation
a-d, Measurements of the sensitivity to laser heat (a, P=0.76), acetone (b, P=0.86), von Frey (c, P=0.03 for 0.016g) and brush (d, P=0.002) stimuli in control (n=8) or CCK-RTM interneuron ablated (n=7) animals. a, b, d, two-sided Student’s t-test; c, two-way repeated measures ANOVA followed by Bonferroni correction. e-f, Performance on open field (e, P=0.54) and ground walking (f, P=0.68, 0.72, 0.50 for hindlimb weight support, protraction, and retraction.) in control (n=8) or CCK-RTM interneuron ablated (n=7) mice. n.s.: no statistical significance, two-sided Student’s t-test. g-i, Representative images of c-Fos (green) activity (g) and quantification of CCK-RTM+/c-Fos+ cells (h), c-Fos+ neurons in different laminae (i) of the dorsal horn of the spinal cord (L3-L4) of CCK-RTM (red) mice after SNI and brush receiving sham (n=4), pyramidotomy (n=5) or lumbar CCK-RTM ablation (n=3). Scale bars: 500 and 50 μm. **, p < 0.01, two-side student’s t test. For h: P<0.0001, i: P=0.0045 and 0.0028 for laminae I-II, laminae III-V, respectively. Data are presented as mean ± SEM.
Extended Data Figure 9
Extended Data Figure 9. Characterization Aβ and CST inputs onto CCK-RTM neurons
a, Schematic of the stimulation–whole cell patch recording set-up for RTM-labeled CCK-RTM interneurons. CST axons labeled by AAV-ChR2-YFP were stimulated with a 473nm laser. A single dorsal root (L4-L6) was stimulated with a glass suction electrode. b, c, Representative consecutive traces (n=3) of Aβ (left) and opto-CST (right) stimulation evoked responses (b) and summarization (c) of whole cell patch clamping recordings on CCK-RTM interneurons. Three recording conditions were used: First, to detect evoked excitatory post-synaptic currents (eEPSCs), we held the membrane potential at −70 mV, which is the equilibrium potential of Cl and thereby minimizes the flow of inhibitory post-synaptic currents (eIPSCs). Second, by holding the membrane potential at 0 mV, we examined the polysynaptic, inhibitory inputs (eIPSCs) on CCK- RTM interneurons. Third, we used current clamp mode to examine whether the stimulation drives action potential (AP) firing at the resting membrane potential. Type 1: CCK-RTM neurons only receive excitatory inputs, few of them generated AP output when Aβ or CST inputs were respectively stimulated; Type 2: CCK-RTM neurons receive both excitatory inputs and feed forward, inhibitory inputs, with no AP output; Type 3: CCK-RTM neurons only receive feed forward inhibition, with no AP output; Type 4: CCK-RTM neurons show no response at either voltage or current clamp recording. d, Left: Representative recording of an Ab (25 mA) dorsal root evoked EPSC at −70mV. Latency and jitter properties (magnified in inset) with quantifications (n=8 neurons) are consistent with mono-synaptic sensory connectivity. Right: Opto-stimulation evoked EPSC (averaged traces) at −70mV in the same cell shown on the left. The evoked EPSC was blocked by AMPA/NMDA antagonist [NBQX (5 mM)/CPP (20 mM)]. In addition, such opto-stimulation evoked EPSC was eliminated by TTX (0.5 mM), and reinstated by 4-AP (2 mM), indicating the monosynaptic connection between CST and CCK-RTM interneurons. Bar graph: Quantification of eEPSCs amplitude with drug administration. **, P < 0.0001 for all comparisons with **, One-way ANOVA followed by Bonferroni correction. n=8 neurons. Data are presented as means ± SEM.
Extended Data Figure 10
Extended Data Figure 10. Reinforcement or without induction of tactile allodynia in animals with or without SNI by optogenetic stimulation of somatosensory CSNs
a, Schematic drawing of experimental paradigm. b-c, Measurement of punctate (von Frey), dynamic (brush) mechanical allodynia upon opto-stimulation in control (n=6) and ChR2-YFP+ CSNs (n=6) mice after SNI. n.s. and *, no statistical significance and P < 0.05, For b and c, P=0.18, 0.08 and 0.41, 0.02 for PLAP and Cre, without or with laser, respectively, two-sided student’s t-test. d, Representative images and quantification of pERK (red) and NK1R (green) immunostaining in the superficial dorsal horn (laminae I-II) of the spinal cord (L3-L4) in control (n=3) or hindlimb ChR2-YFP+ CSNs (n=3) animals receiving SNI and brush, coupled with opto-stimulation. Scale bar: 100 μm. *, P < 0.05, P=0.02 and 0.01 for pERK and pERK/NK1R ratio, respectively, two-sided student’s t-test. 6 sections crossing the lumbar spinal cord (L3-L4) were quantified for individual animals. Data are presented as mean ± SEM.
Fig. 1
Fig. 1. Adult CST ablation impairs light touch but not nociceptive behavioral responses
a, Schematic of experimental paradigm. Py: pyramidotomy. b, Left: Representative images of transverse sections of the brain stem at pyramids and dorsal spinal cord (L3) in sham (n=8) or pyramidotomized (n=12) mice for sensory tests stained with anti-PKCY. Arrowhead and dashed lines indicate the location of main CST. Scale bar: 500 μm. Right: Quantification of PKCY immunofluorescence intensity (normalized to control) in the lumbar dorsal funiculus of sham or pyramidotomized mice. P <0.0001. c-i, Measurement of thermal and mechanical sensitivities by: hot plate (c, P=0.59 and 0.35 for flinch and lick, respectively), laser heat (d, P=0.50), acetone (e, P=0.73), pinprick (f, P=0.58), von Frey filaments (g, P=0.016 for 0.16g), dynamic light brush (h, P=0.001), and tape removal (i, P=0.0003) in sham (n=8) or pyramidotomized mice (n=12). In b, c-f, h, and i, two-sided t-test; In g, two-way repeated measures ANOVA followed by Bonferroni correction. Data are presented as mean±SEM.
Fig. 2
Fig. 2. Hindlimb somatosensory CSN ablation causes specific loss of light touch response and mechanical allodynia
a, Representative images showing projection patterns of CST axons originating from indicated cortical areas. Scale bar: 500 μm. b, Quantification of relative CST termination percentile within different laminae from indicated cortical areas (n=3). c, Schematic of regional CSN ablation where HiRet viruses were injected into the lumbar spinal cord (T13-L6) at P14. d-g, Measurements of sensitivity to laser heat (d, P=0.40), pinprick (e, P=0.28), von Frey filaments (f, P=0.004 for 0.16g) and brush stimuli (g, P<0.0001) in control (n=7), or hindlimb somatosensory CSN ablated (n=8) animals. h-i, Measurement of punctate and dynamic mechanical allodynia after SNI in control (n=7) and hindlimb somatosensory CSN ablated (n=8) animals. j, Schematic of S1/S2 CSN silencing when HiRet-Cre was injected into the lumbar spinal cord at P14. k-l, Measurement of punctate and dynamic allodynia after SNI with PSEM administration in AAV-FLEX-GlyR (n=7) or AAV-GFP (n=8) injected mice. In h, i, k, l, P= 0.0001 & 0.0006 for 14 and 21d in I; P=0.002 & 0.016 for 20 & 40 min in k, P<0.0001 for others with **. In d,e,g, two-sided t-test. In f, h, i, k, l, two-way repeated measures ANOVA followed by Bonferroni correction. Data are presented as mean±SEM.
Fig. 3
Fig. 3. Light touch elicited activation of somatosensory CSNs and spinal dorsal horn neurons
a, Diagrams showing calcium activity imaging in S1 CSNs by a head-mounted miniaturized microscope. b, Trial-average activity of CSNs in response to indicated sensory stimuli before and after SNI. Active calcium event traces were aligned to the time when the brush (Pre-SNI: n=156 neurons from 4 mice, Post-SNI: n=103 neurons from 4 mice), von Frey (Pre-SNI: n=151 neurons from 4 mice, Post-SNI: n= 94 neurons from 4 mice), or laser (Pre- SNI: n=156 neurons from 4 mice, Post-SNI: n= 116 neurons from 4 mice) affected the hindpaw (green arrowheads). Trial averages (13-17 trials/mouse) were sorted based on peak activity time. Arrowheads indicate onset of stimulation. c, Average response to brush, von Frey (0.04g) and laser heat stimuli pre- and post-SNI. Number of neurons is the same as listed in b. *and ***, P=0.03 and 0.0002 for brush and von Frey, respectively, ranksum test. d-g Representative images (d,e) and quantification (f,g) of c-Fos and pERK (red)/NK1R (green) immunoreactivity in the dorsal horn of the spinal cord (L3-L4) in naïve control (n=3), brush only (n=3), SNI only (n=3), SNI and brush (n=4), SNI and brush with pyramidotomy (n=3) animals. Scale bar: 500 and 100 μm in d, e, respectively. Arrowheads indicate the co-localization of pERK and NK1R immunostaining. For f and g, one-way ANOVA followed by Bonferroni correction. P=0.0008 for SNI+brush with/without Py in f, P<0.0001 for all others with **. Data are presented as mean±SEM.
Fig. 4
Fig. 4. Lumbar CCK+ neurons receive convergent Aβ and CST inputs and are required for mechanical allodynia
a-b, Representative images (a) of cervical and lumbar spinal cord dorsal horn in control (AAV-PLAP, n=5) or CCK-RTM neuron ablated (AAV-FLEX-DTR, n=7) mice with quantification (b). P =0.35 and < 0.0001 for cervical and lumbar, respectively, two-sided t test. c-d, Measurement of punctate and dynamic mechanical allodynia after SNI in control (n=8) or CCK-RTM interneuron ablated (n=7) mice. Two-way repeated measures ANOVA followed by Bonferroni correction. P=0.002,0.01,0.03,0.03,0.04 and P<0.0001, =0.0003,0.0003,0.0009,0,0014 for 1,3,7,14, and 21d, respectively. e-f, Averaged traces of EPSCs evoked by Aβ, CST, and co-stimulation (−70mV, voltage clamp, left) or representative trace of EPSP/AP (current clamp, right) in CCK-RTM neurons without (e) or with bicuculline/strychnine treatment (f). Bar graphs under EPSC curves: Relative change of eEPSC amplitude evoked by Aβ/CST co-stimulation compared to the sum of amplitudes evoked by individual stimulation (n=8, in e, P=0.02; n=6, in f, P=0.04), one-sided paired t-test. Data are presented as mean±SEM.

References

    1. Owens DM, Lumpkin EA. Diversification and specialization of touch receptors in skin. Cold Spring Harb Perspect Med. 2014;4:12. - PMC - PubMed
    1. Abraira VE, Ginty DD. The sensory neurons of touch. Neuron. 2013;79:618–639. - PMC - PubMed
    1. Basbaum AI, Bautista DM, Scherrer G, Julius D. Cellular and molecular mechanisms of Pain. Cell. 2009;139:267–284. - PMC - PubMed
    1. Costigan M, Scholz J, Woolf CJ. Neuropathic pain: a maladaptive response of the nervous system to damage. Annu Rev Neurosci. 2009;32:1–32. - PMC - PubMed
    1. Lemon RN. Descending pathways in motor control. Annu Rev Neurosci. 2008;31:195–218. - PubMed

Publication types

MeSH terms

Substances