. 2018 Oct;562(7725):69-75.
doi: 10.1038/s41586-018-0519-y. Epub 2018 Sep 12.

Necroptosis microenvironment directs lineage commitment in liver cancer

Affiliations

Necroptosis microenvironment directs lineage commitment in liver cancer

Marco Seehawer et al. Nature. 2018 Oct.

Erratum in

Abstract

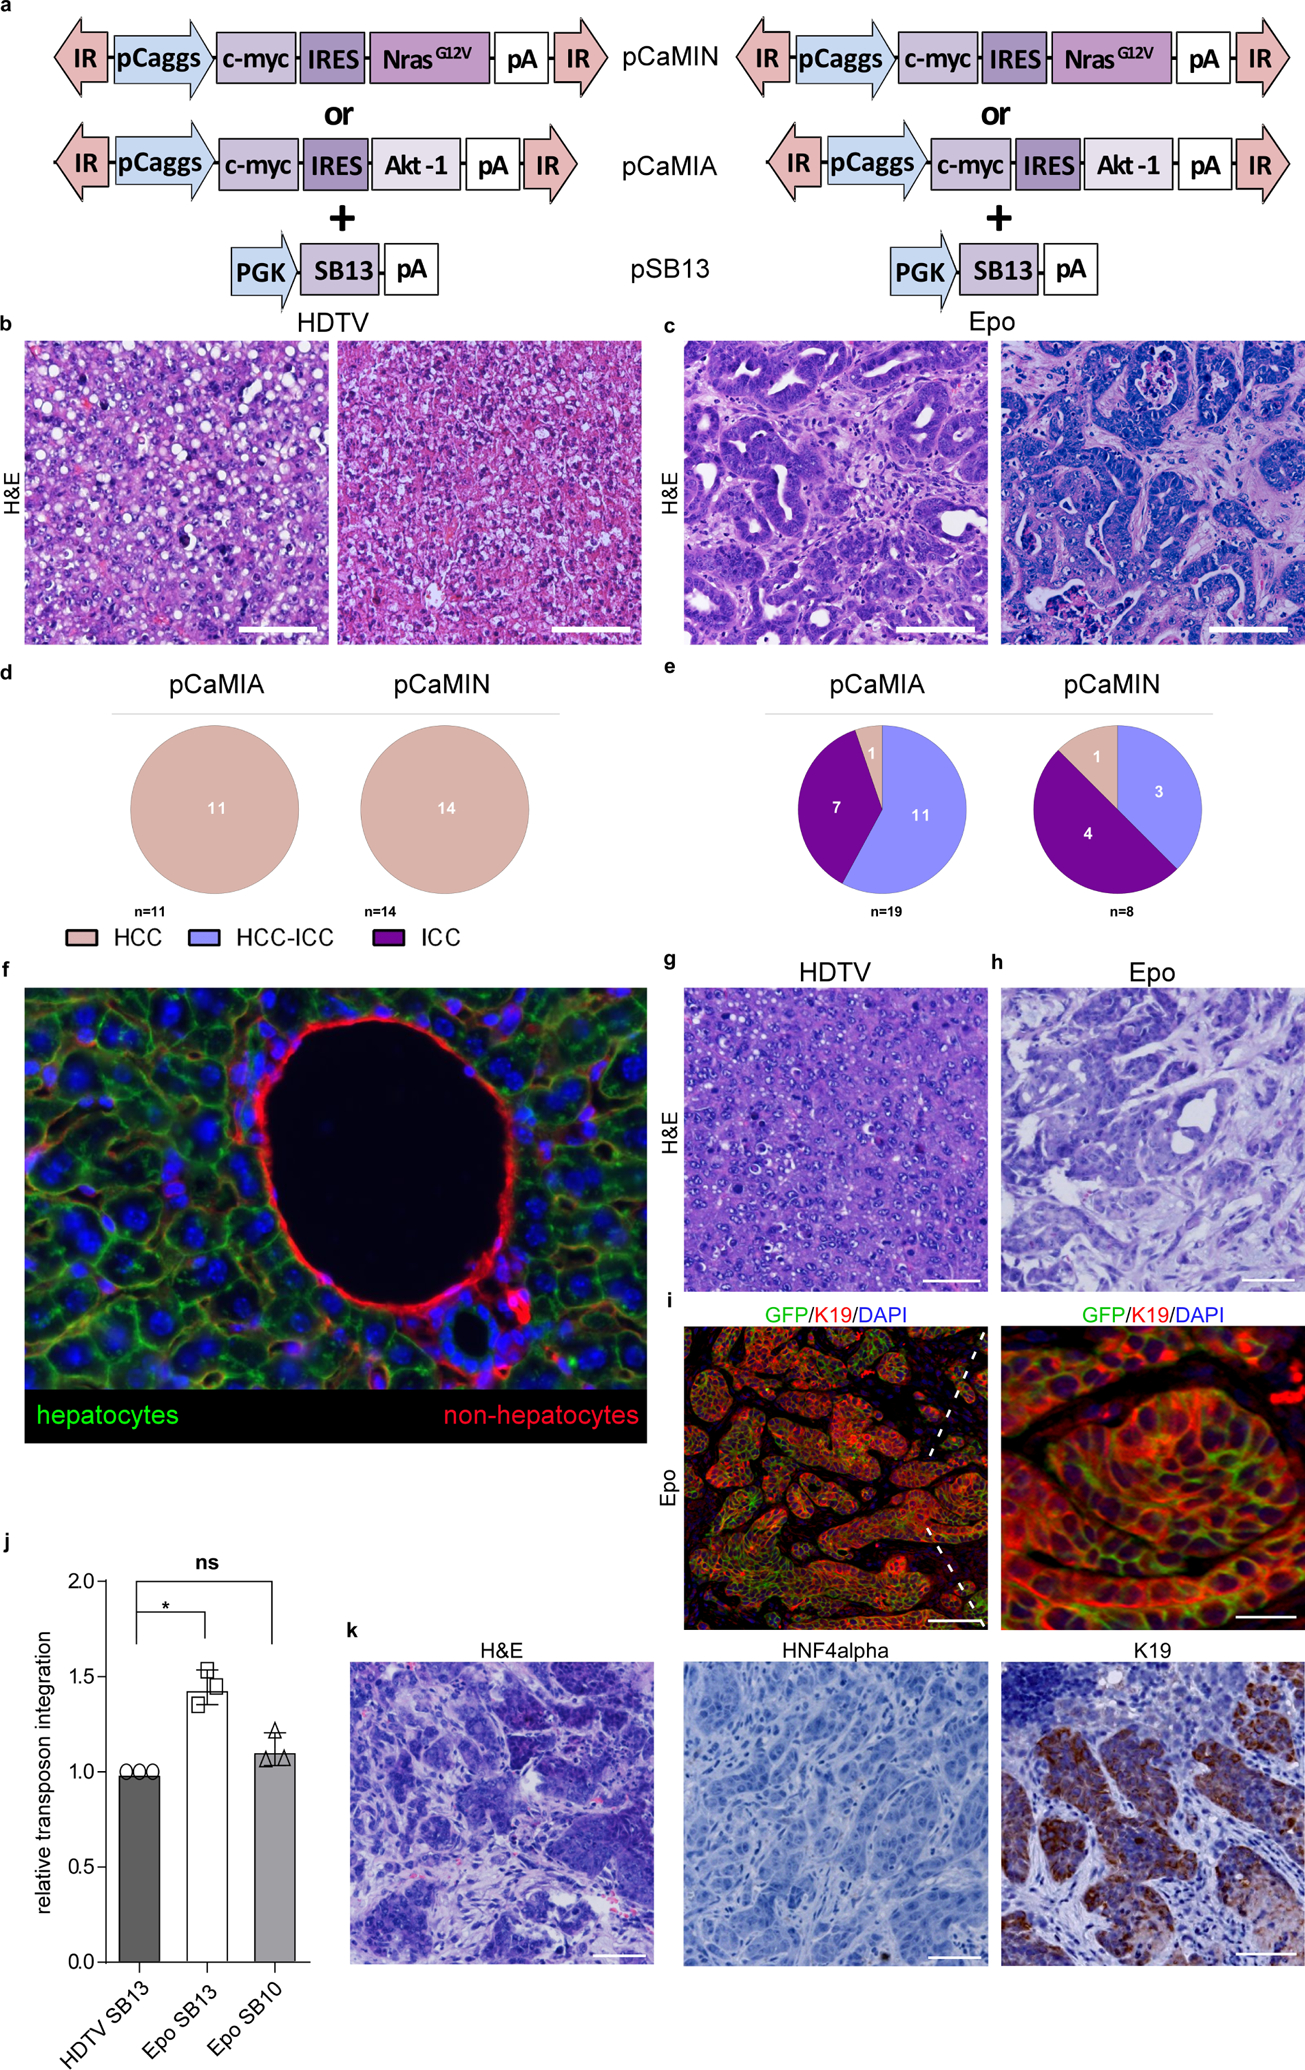
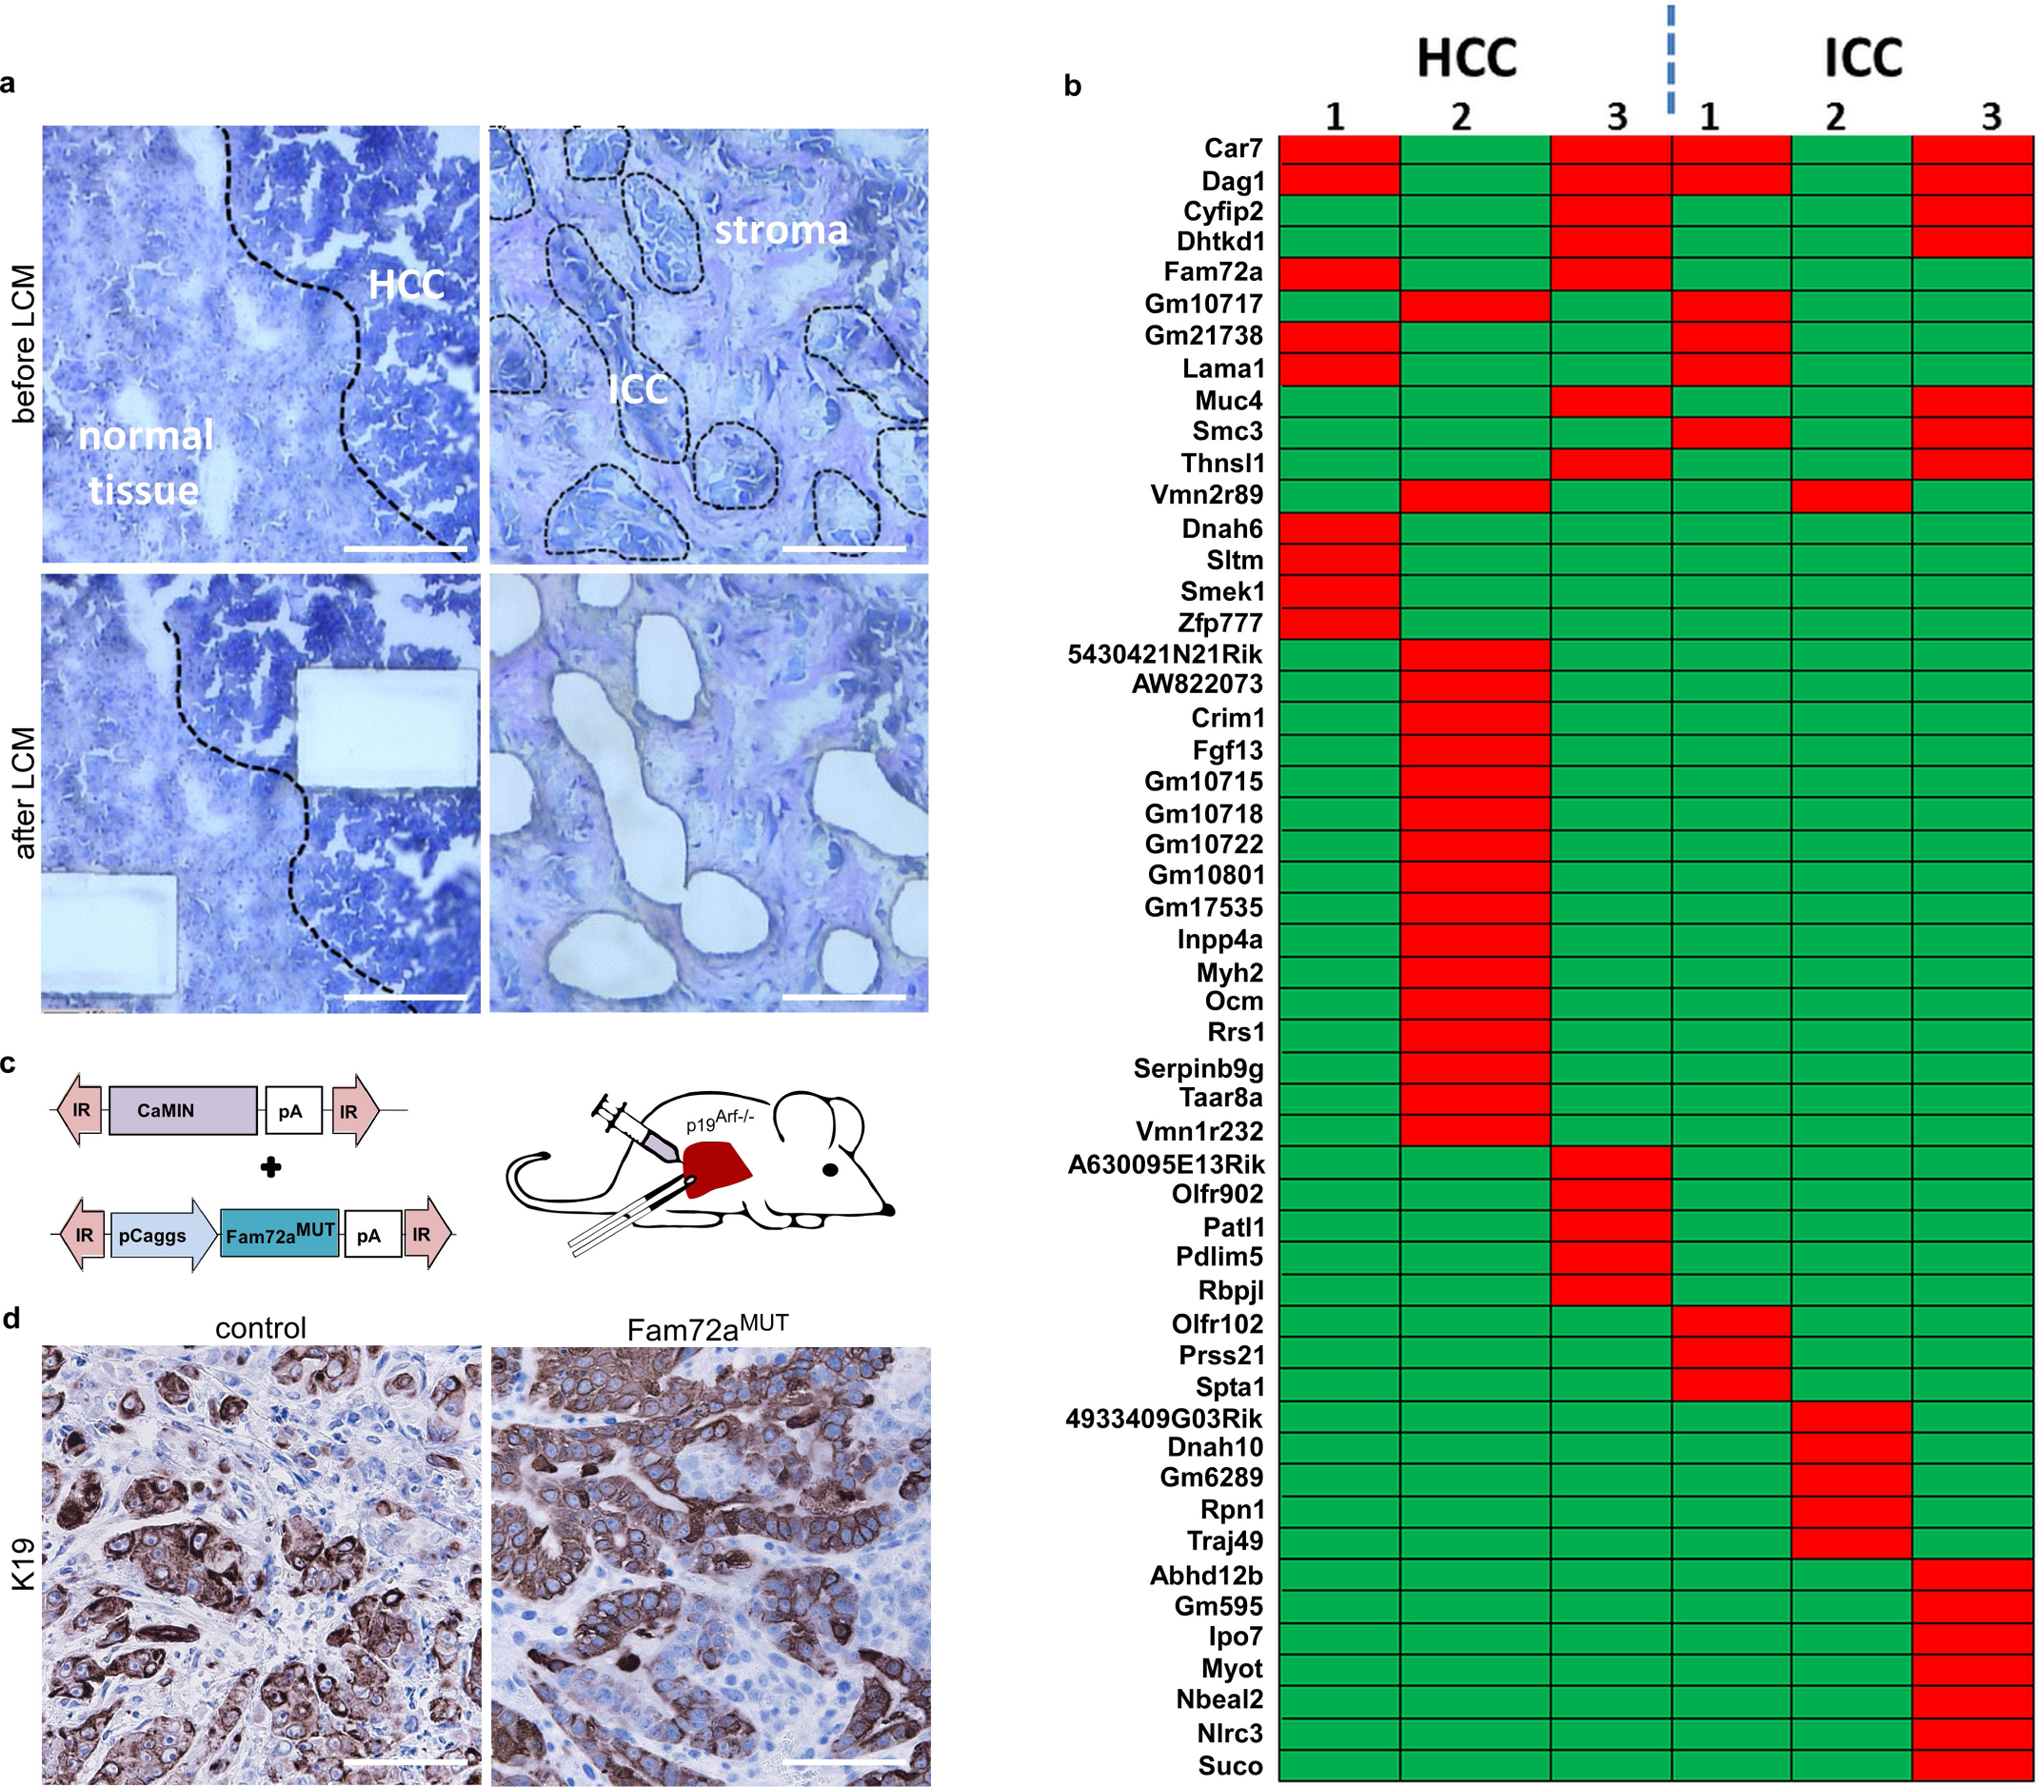
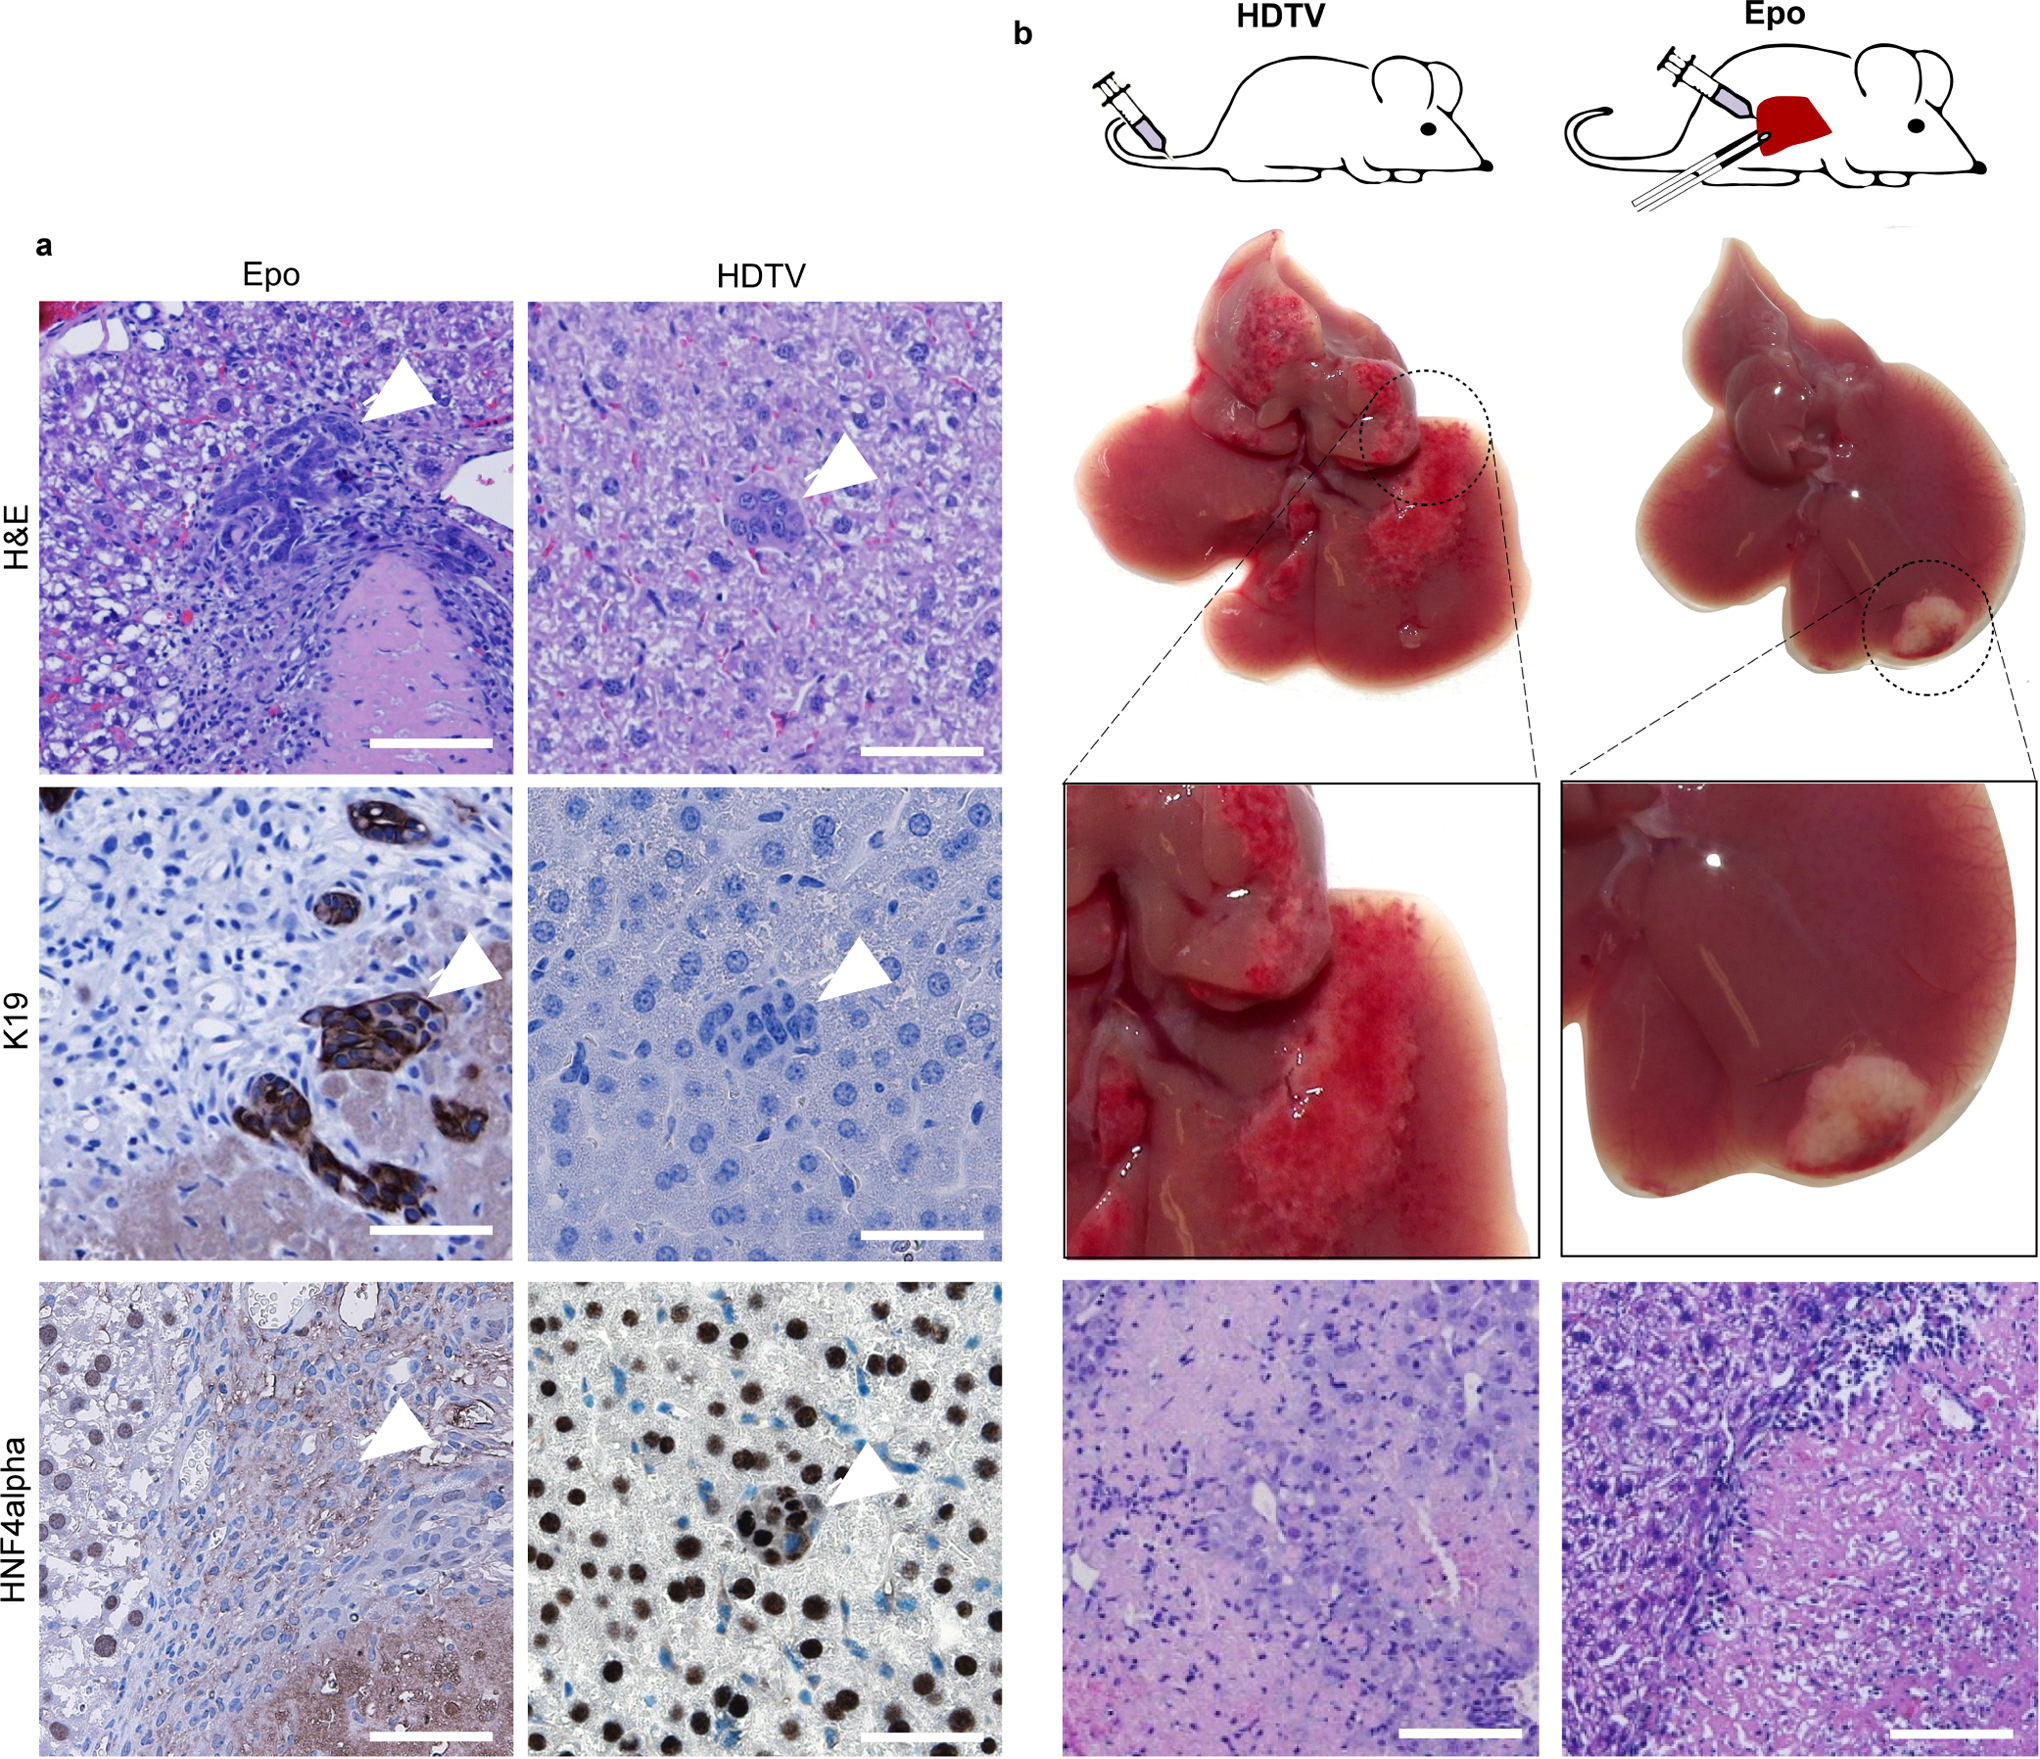
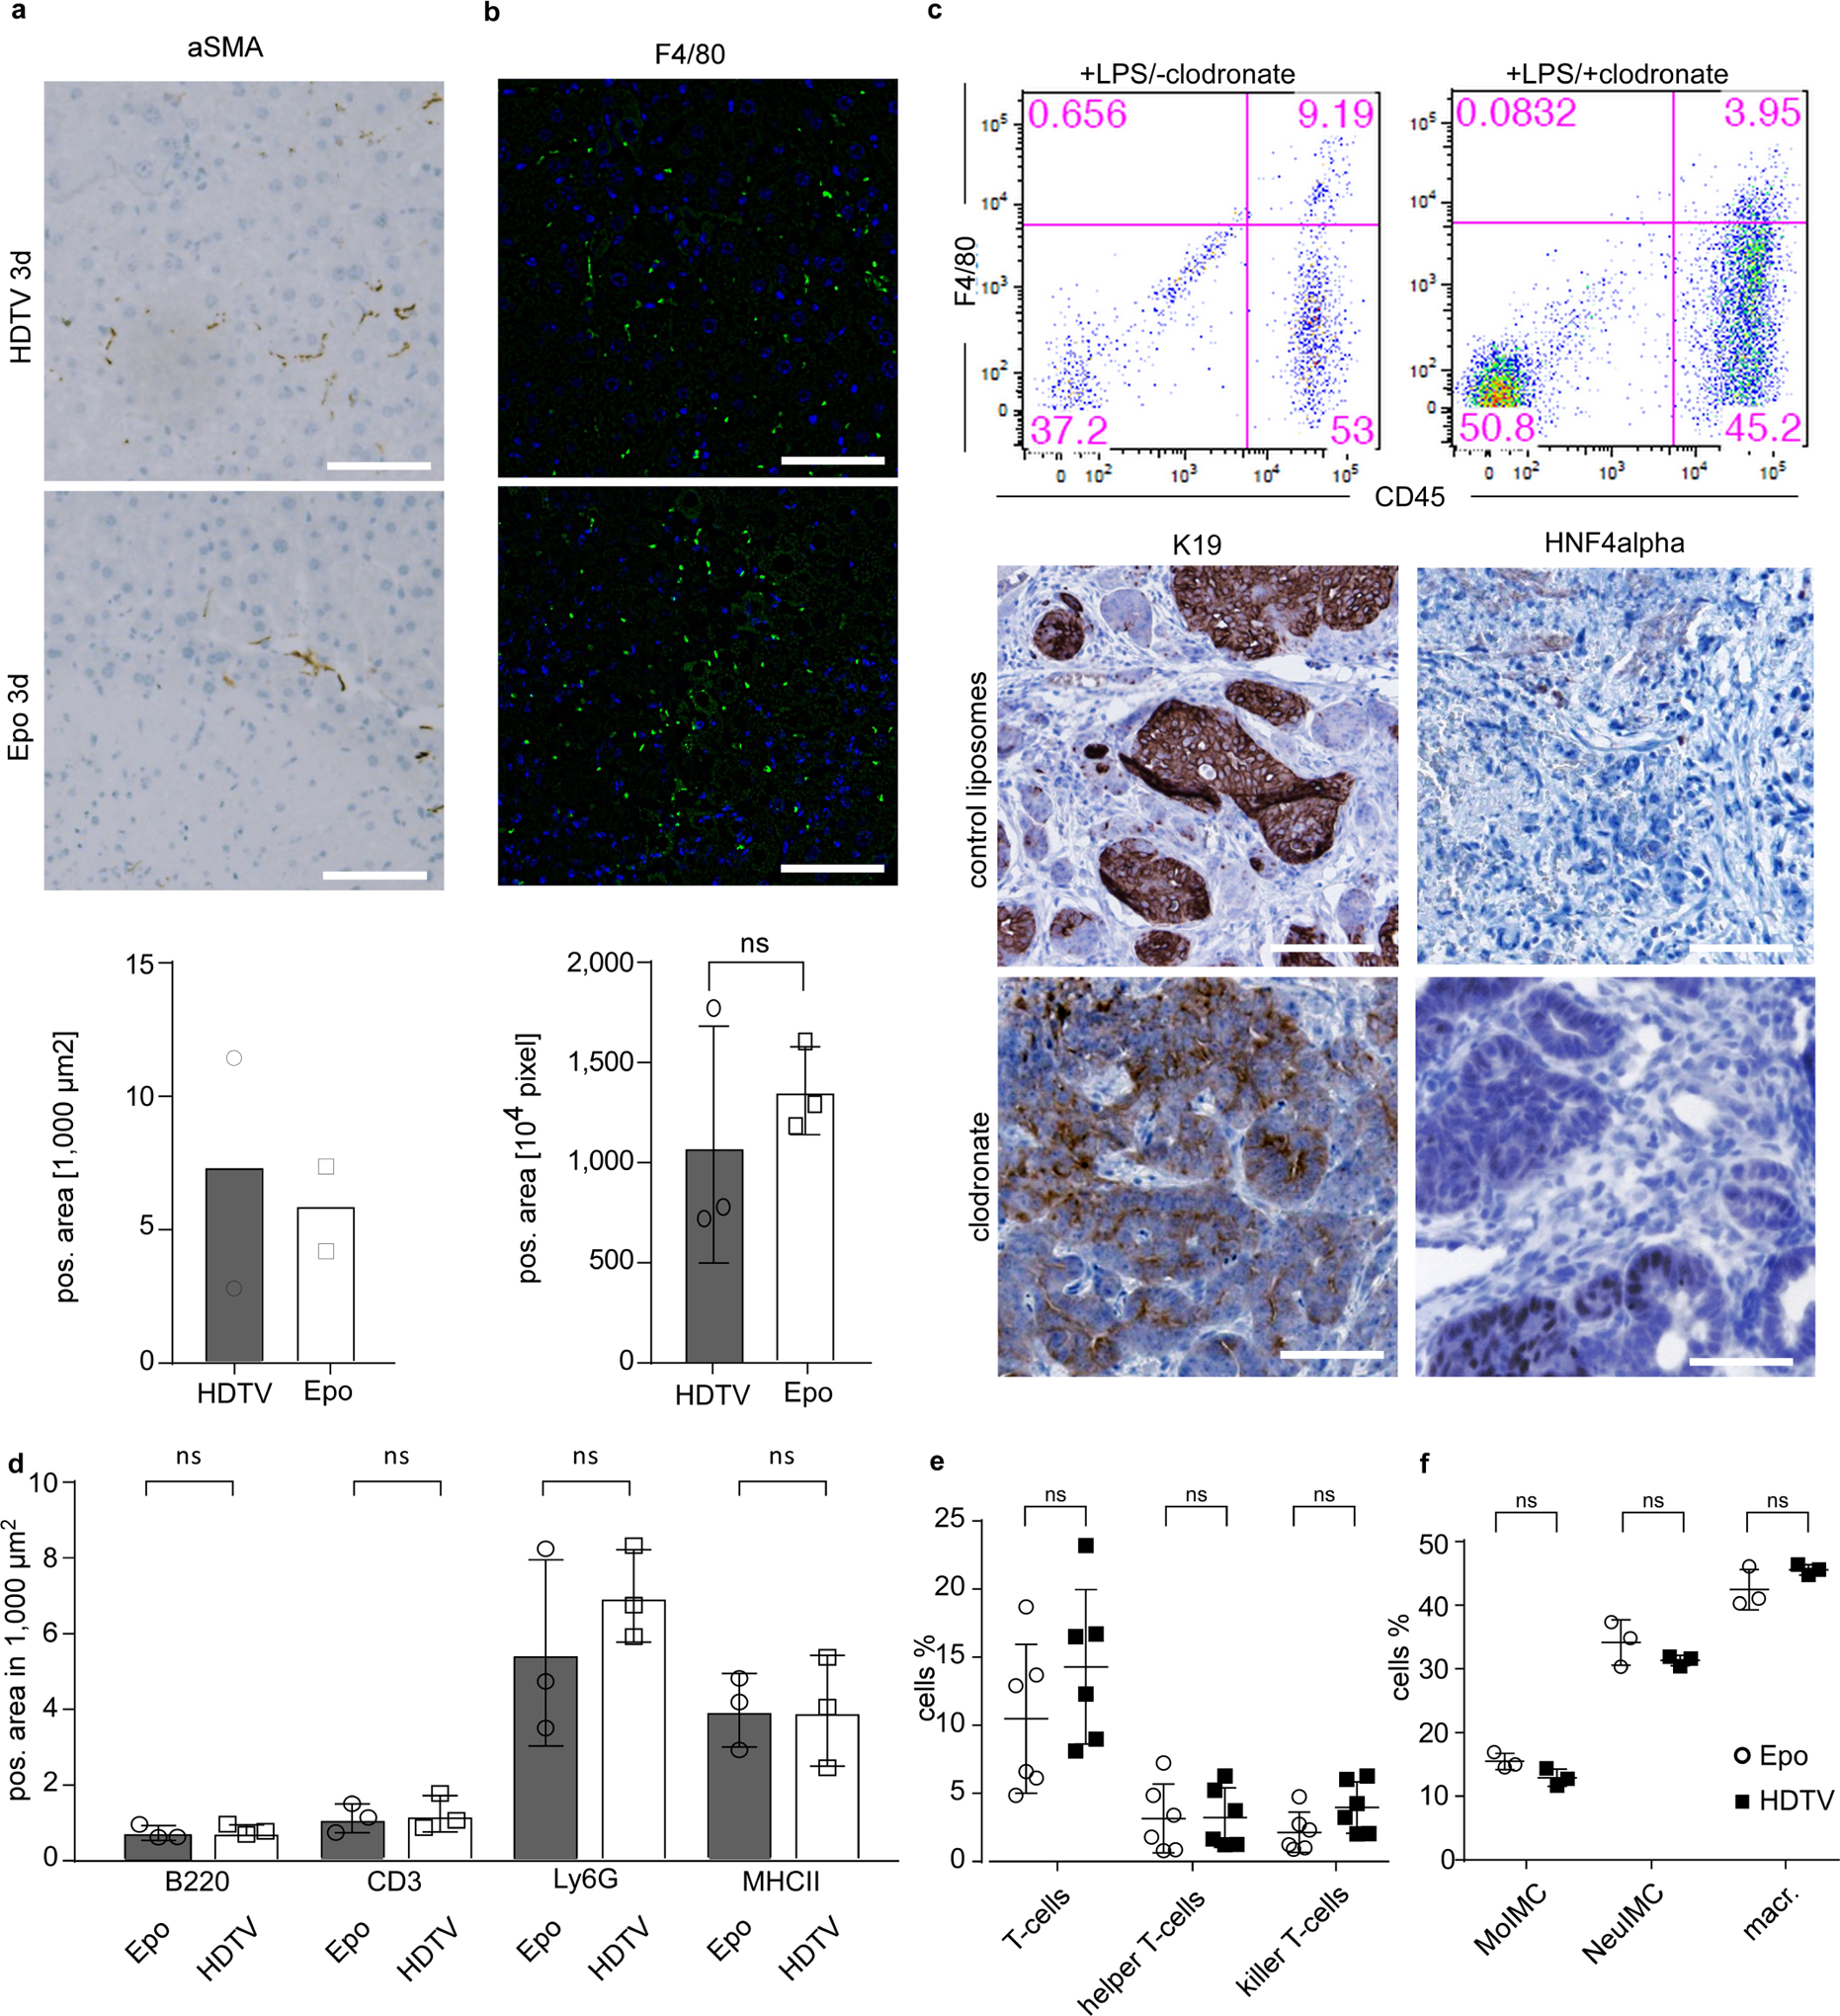
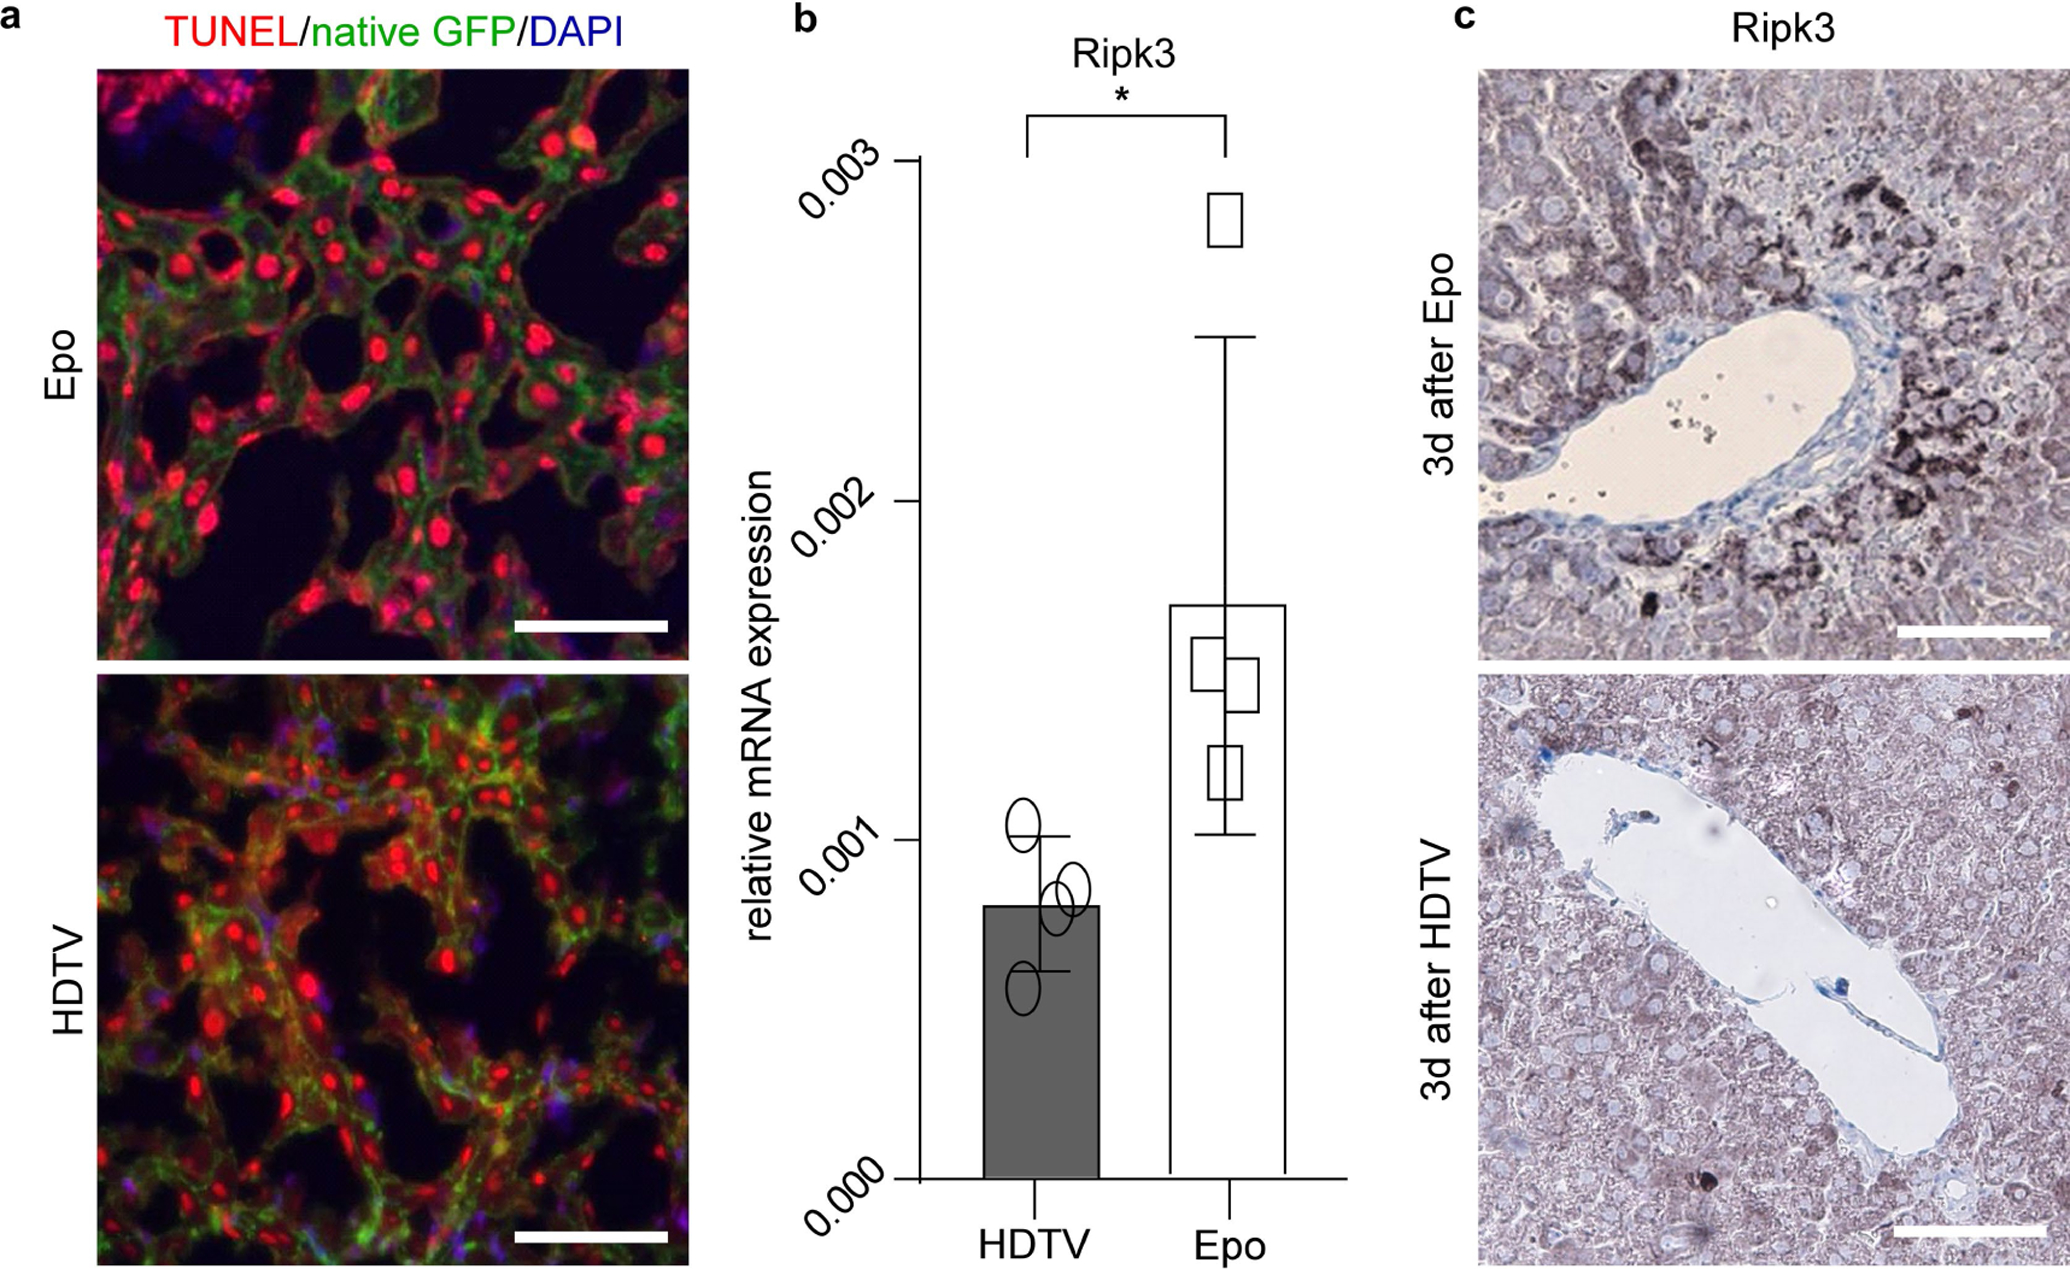
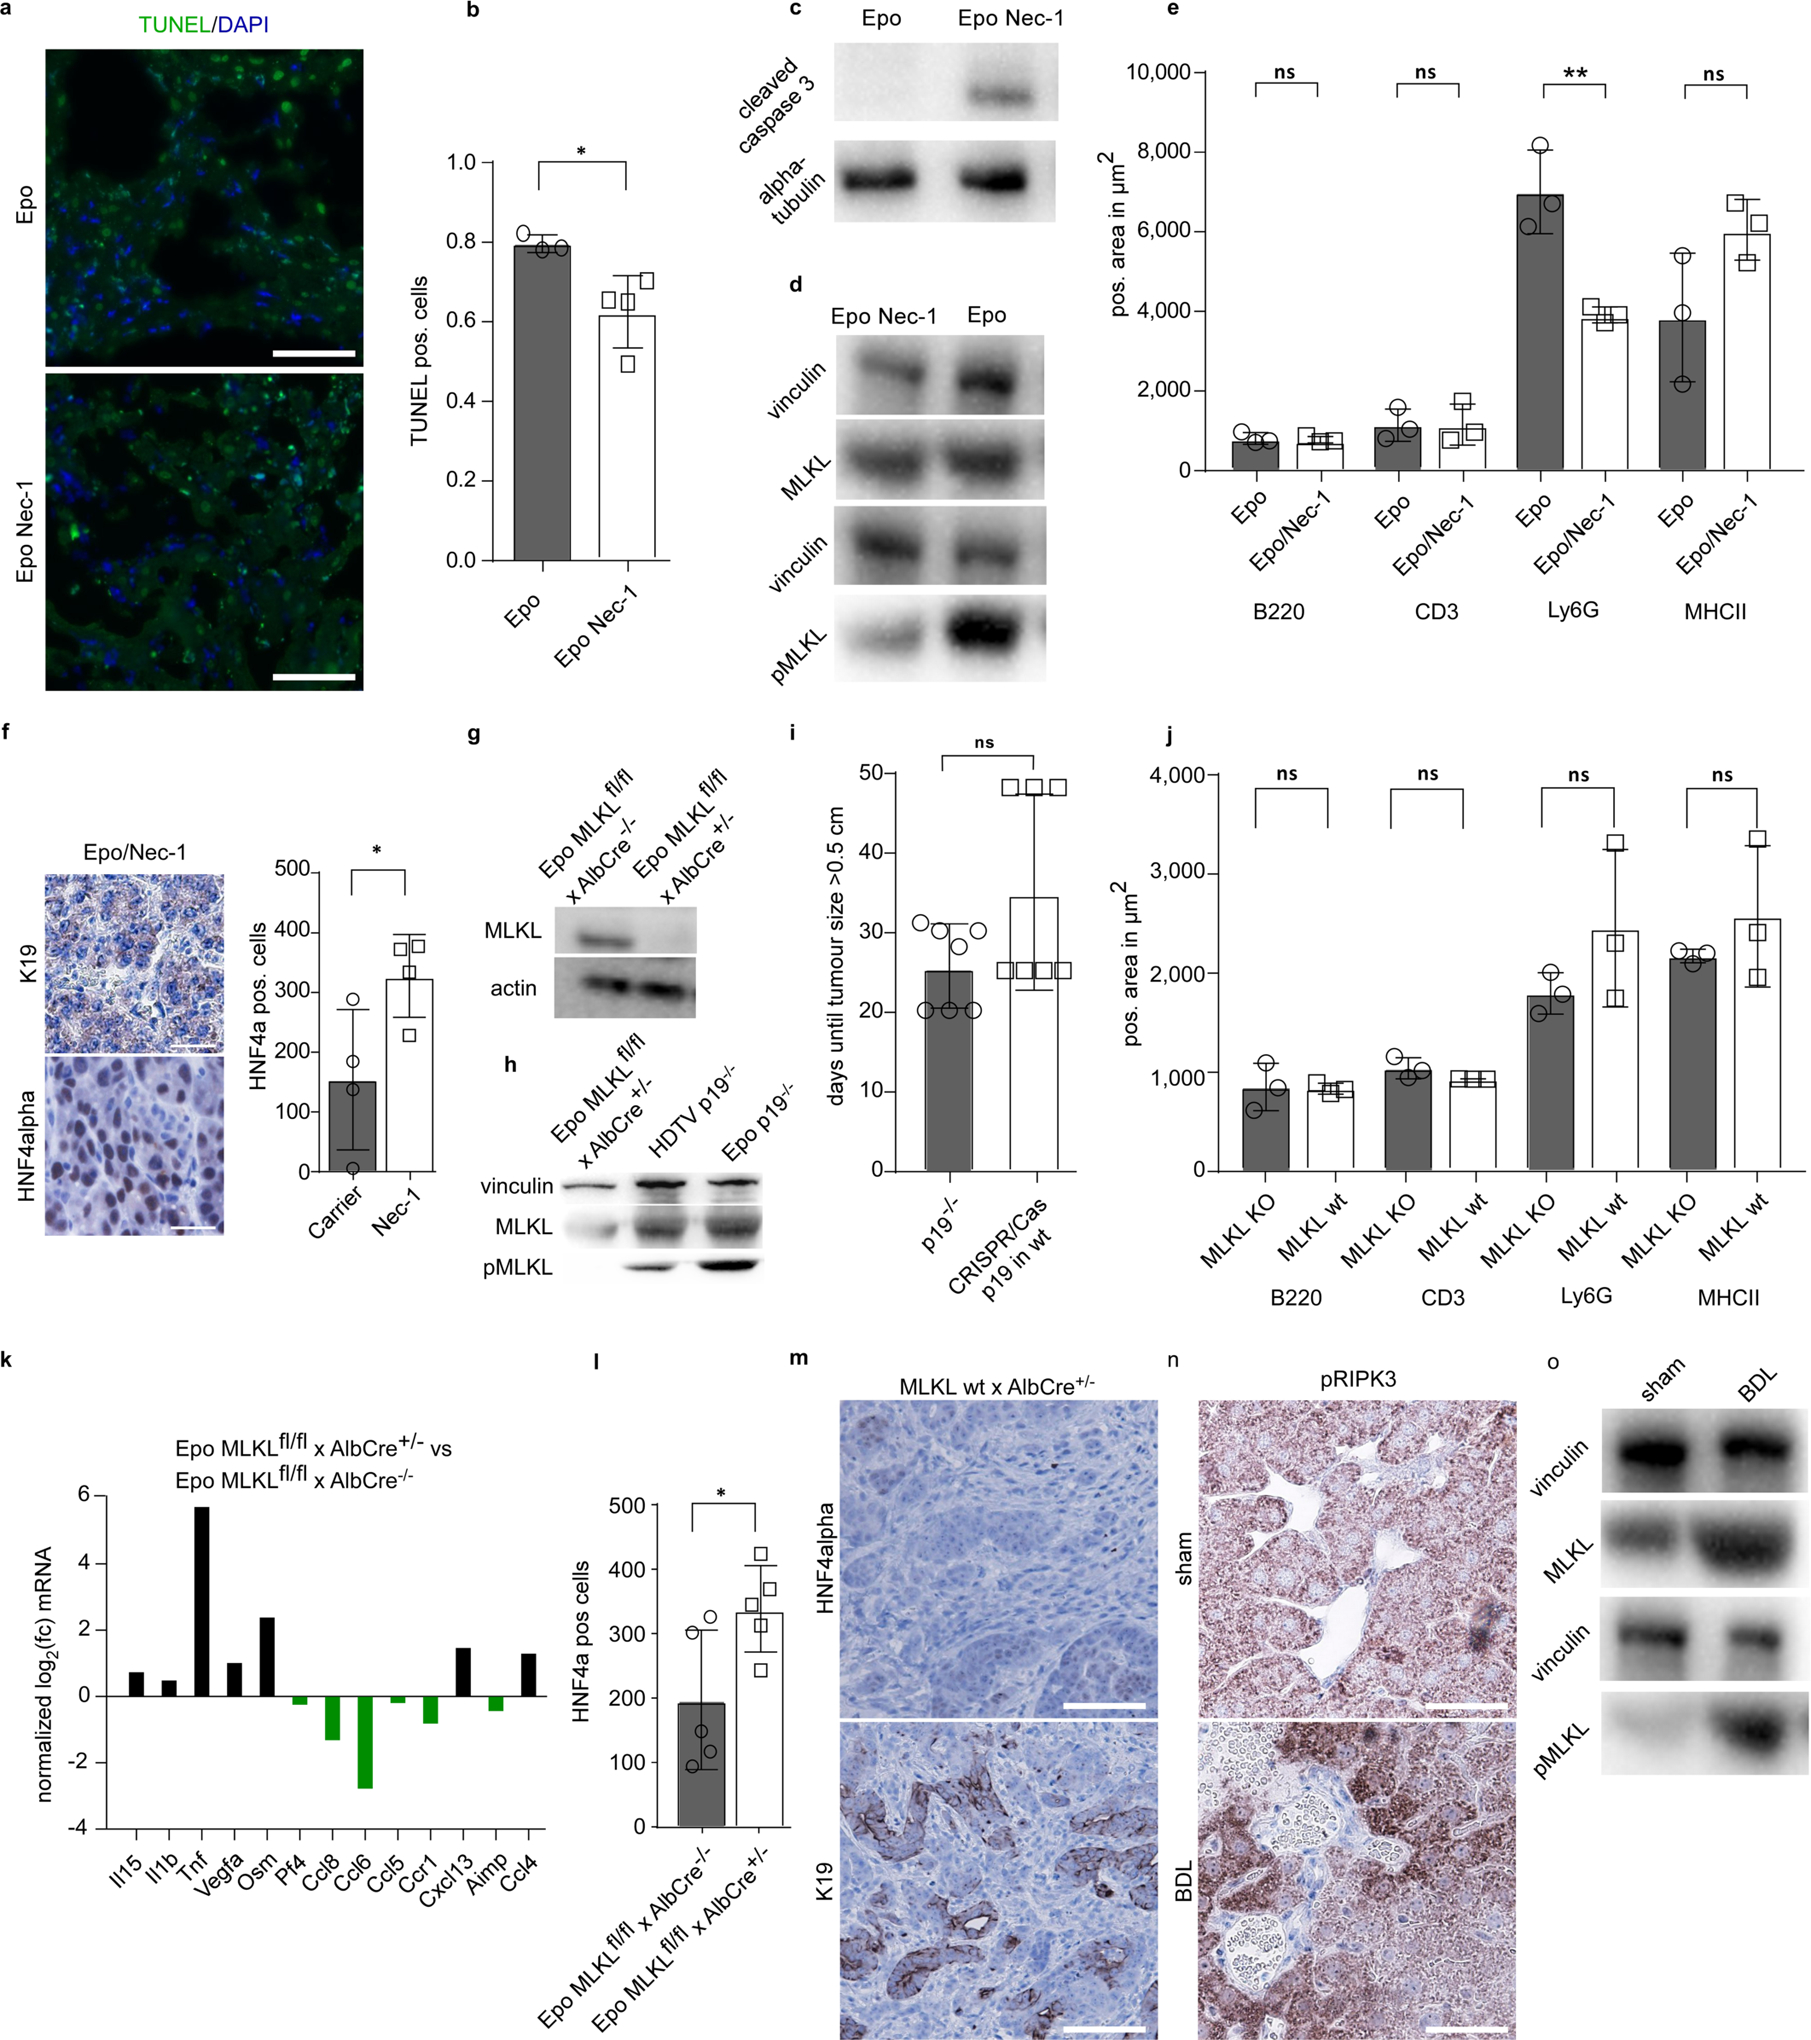
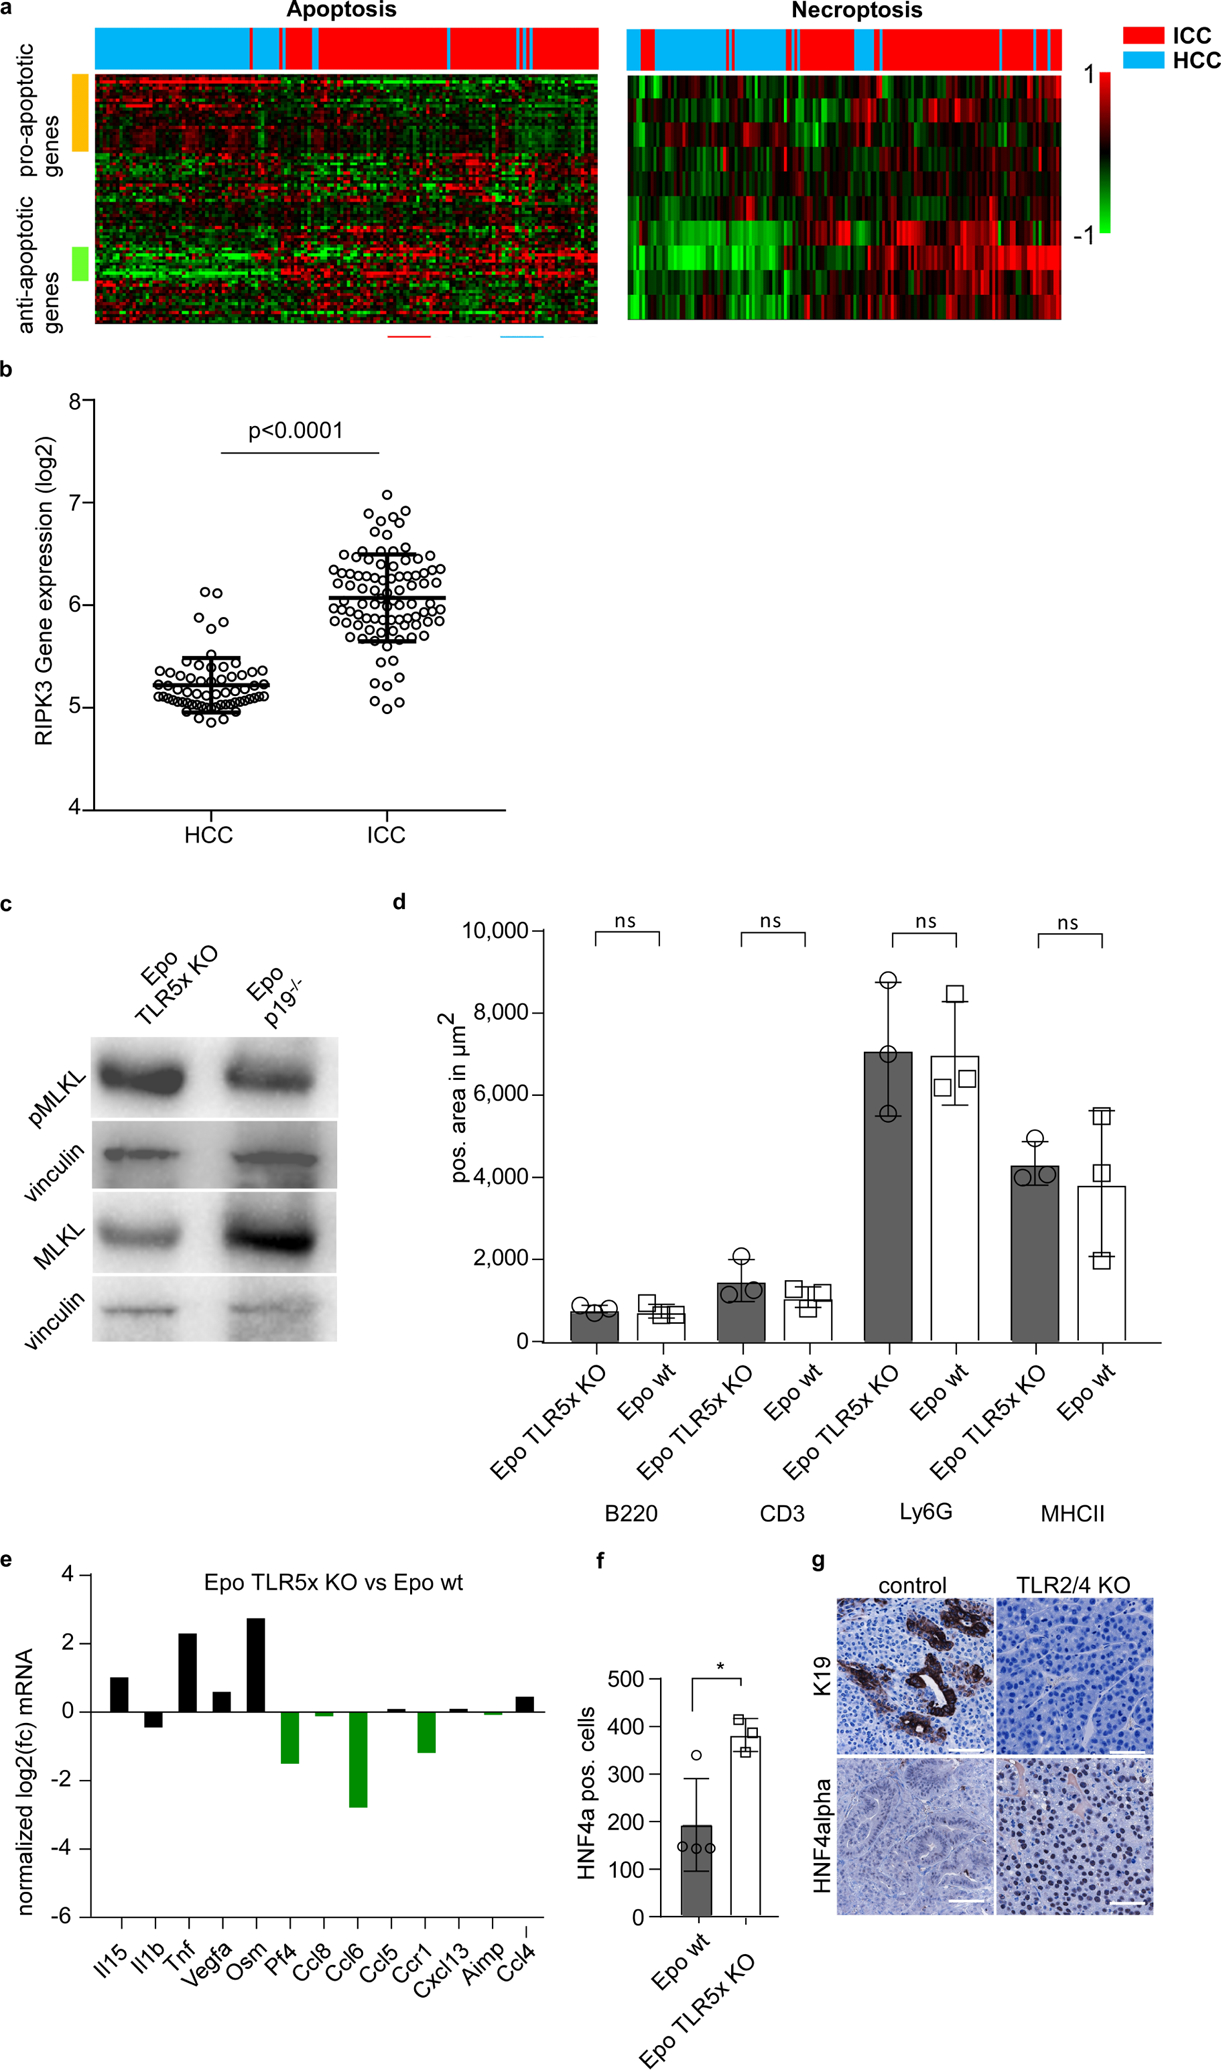
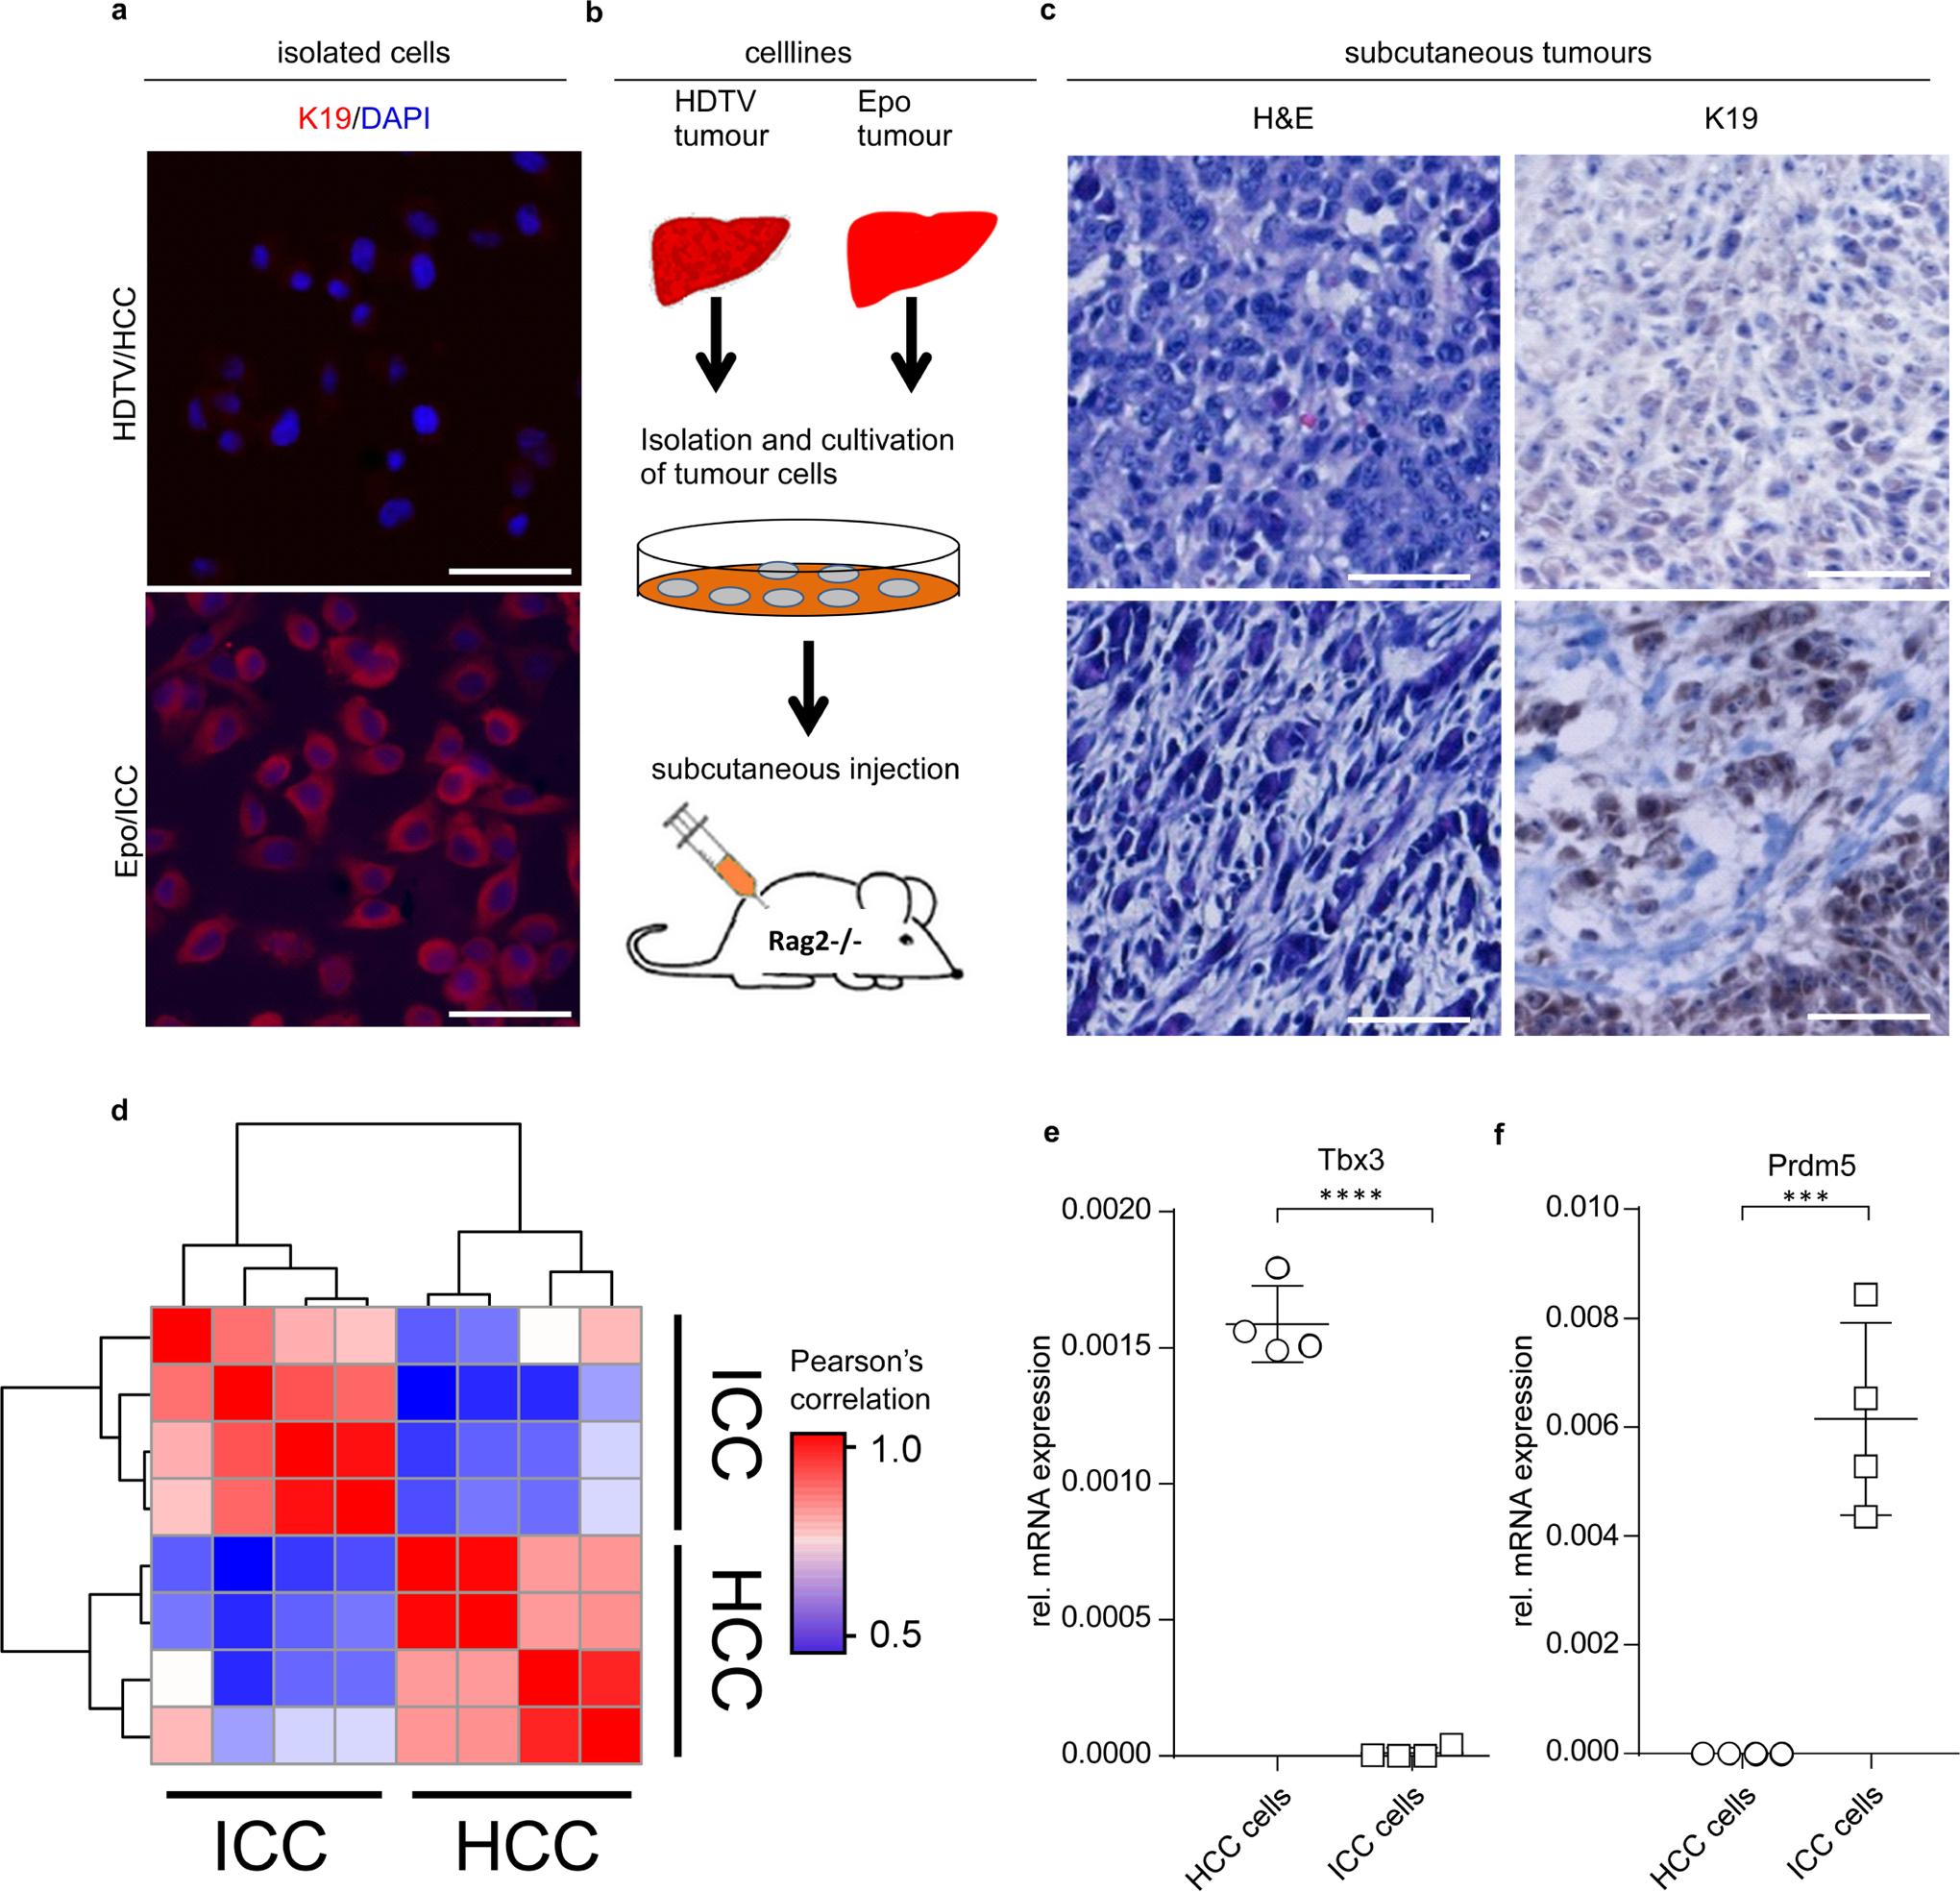
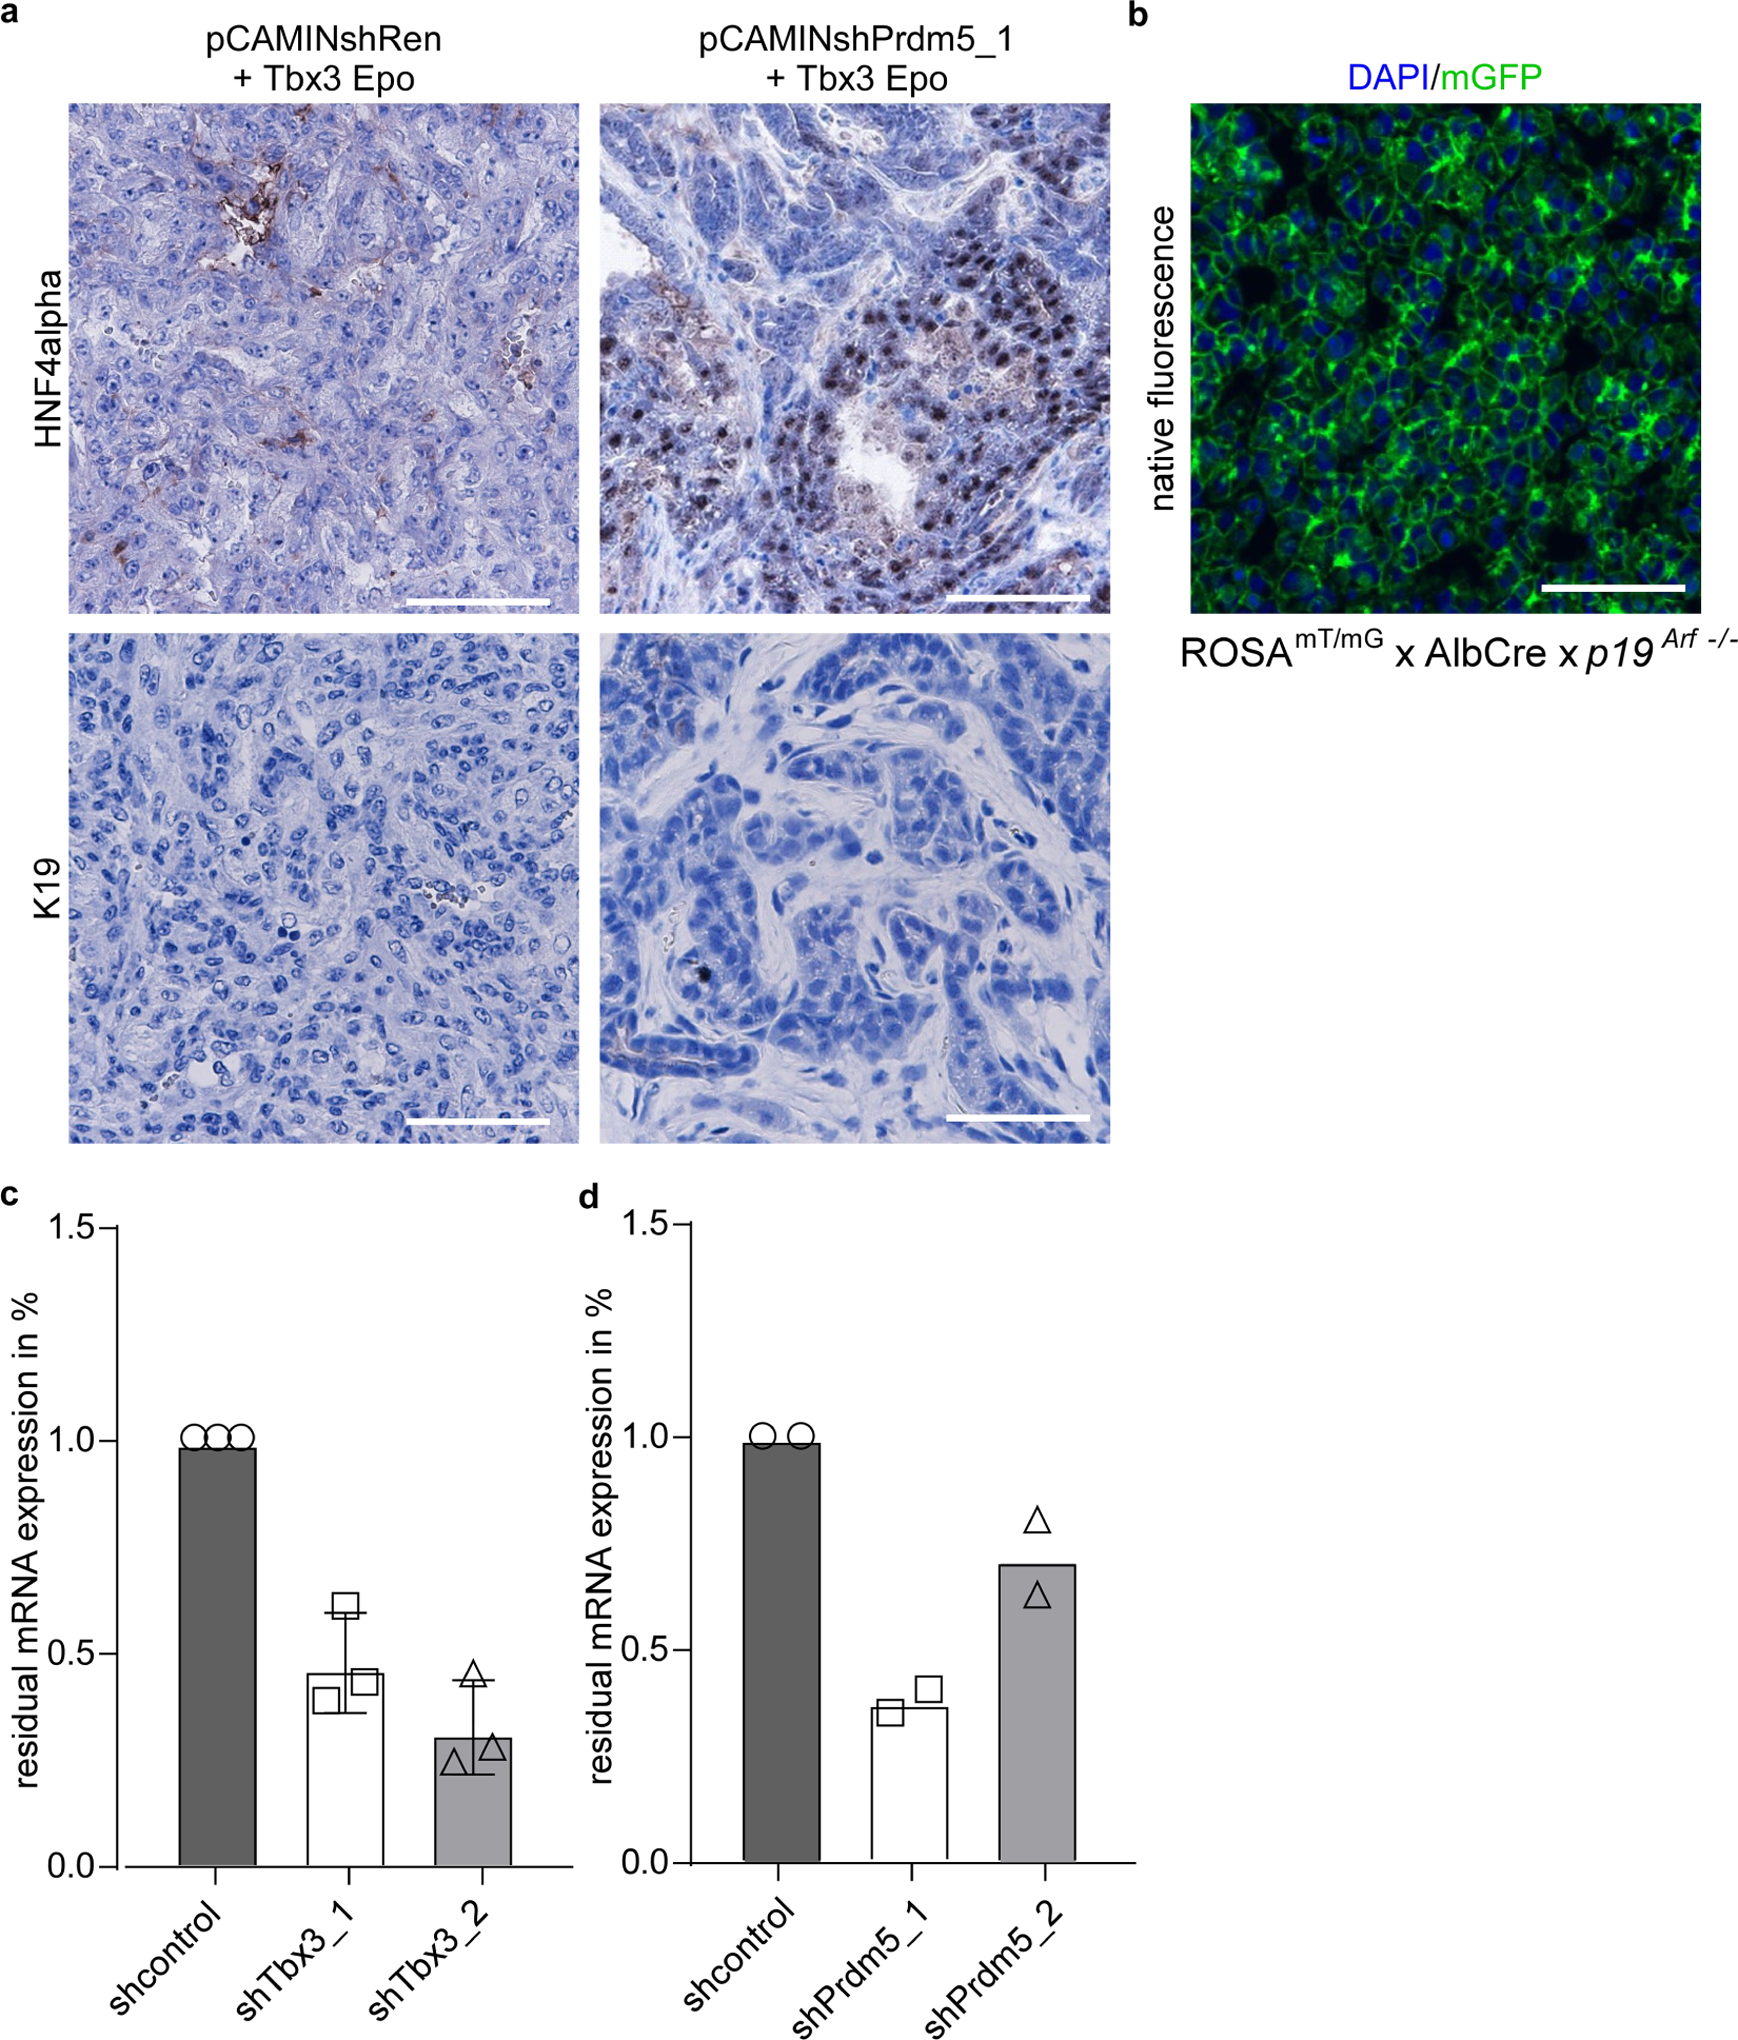
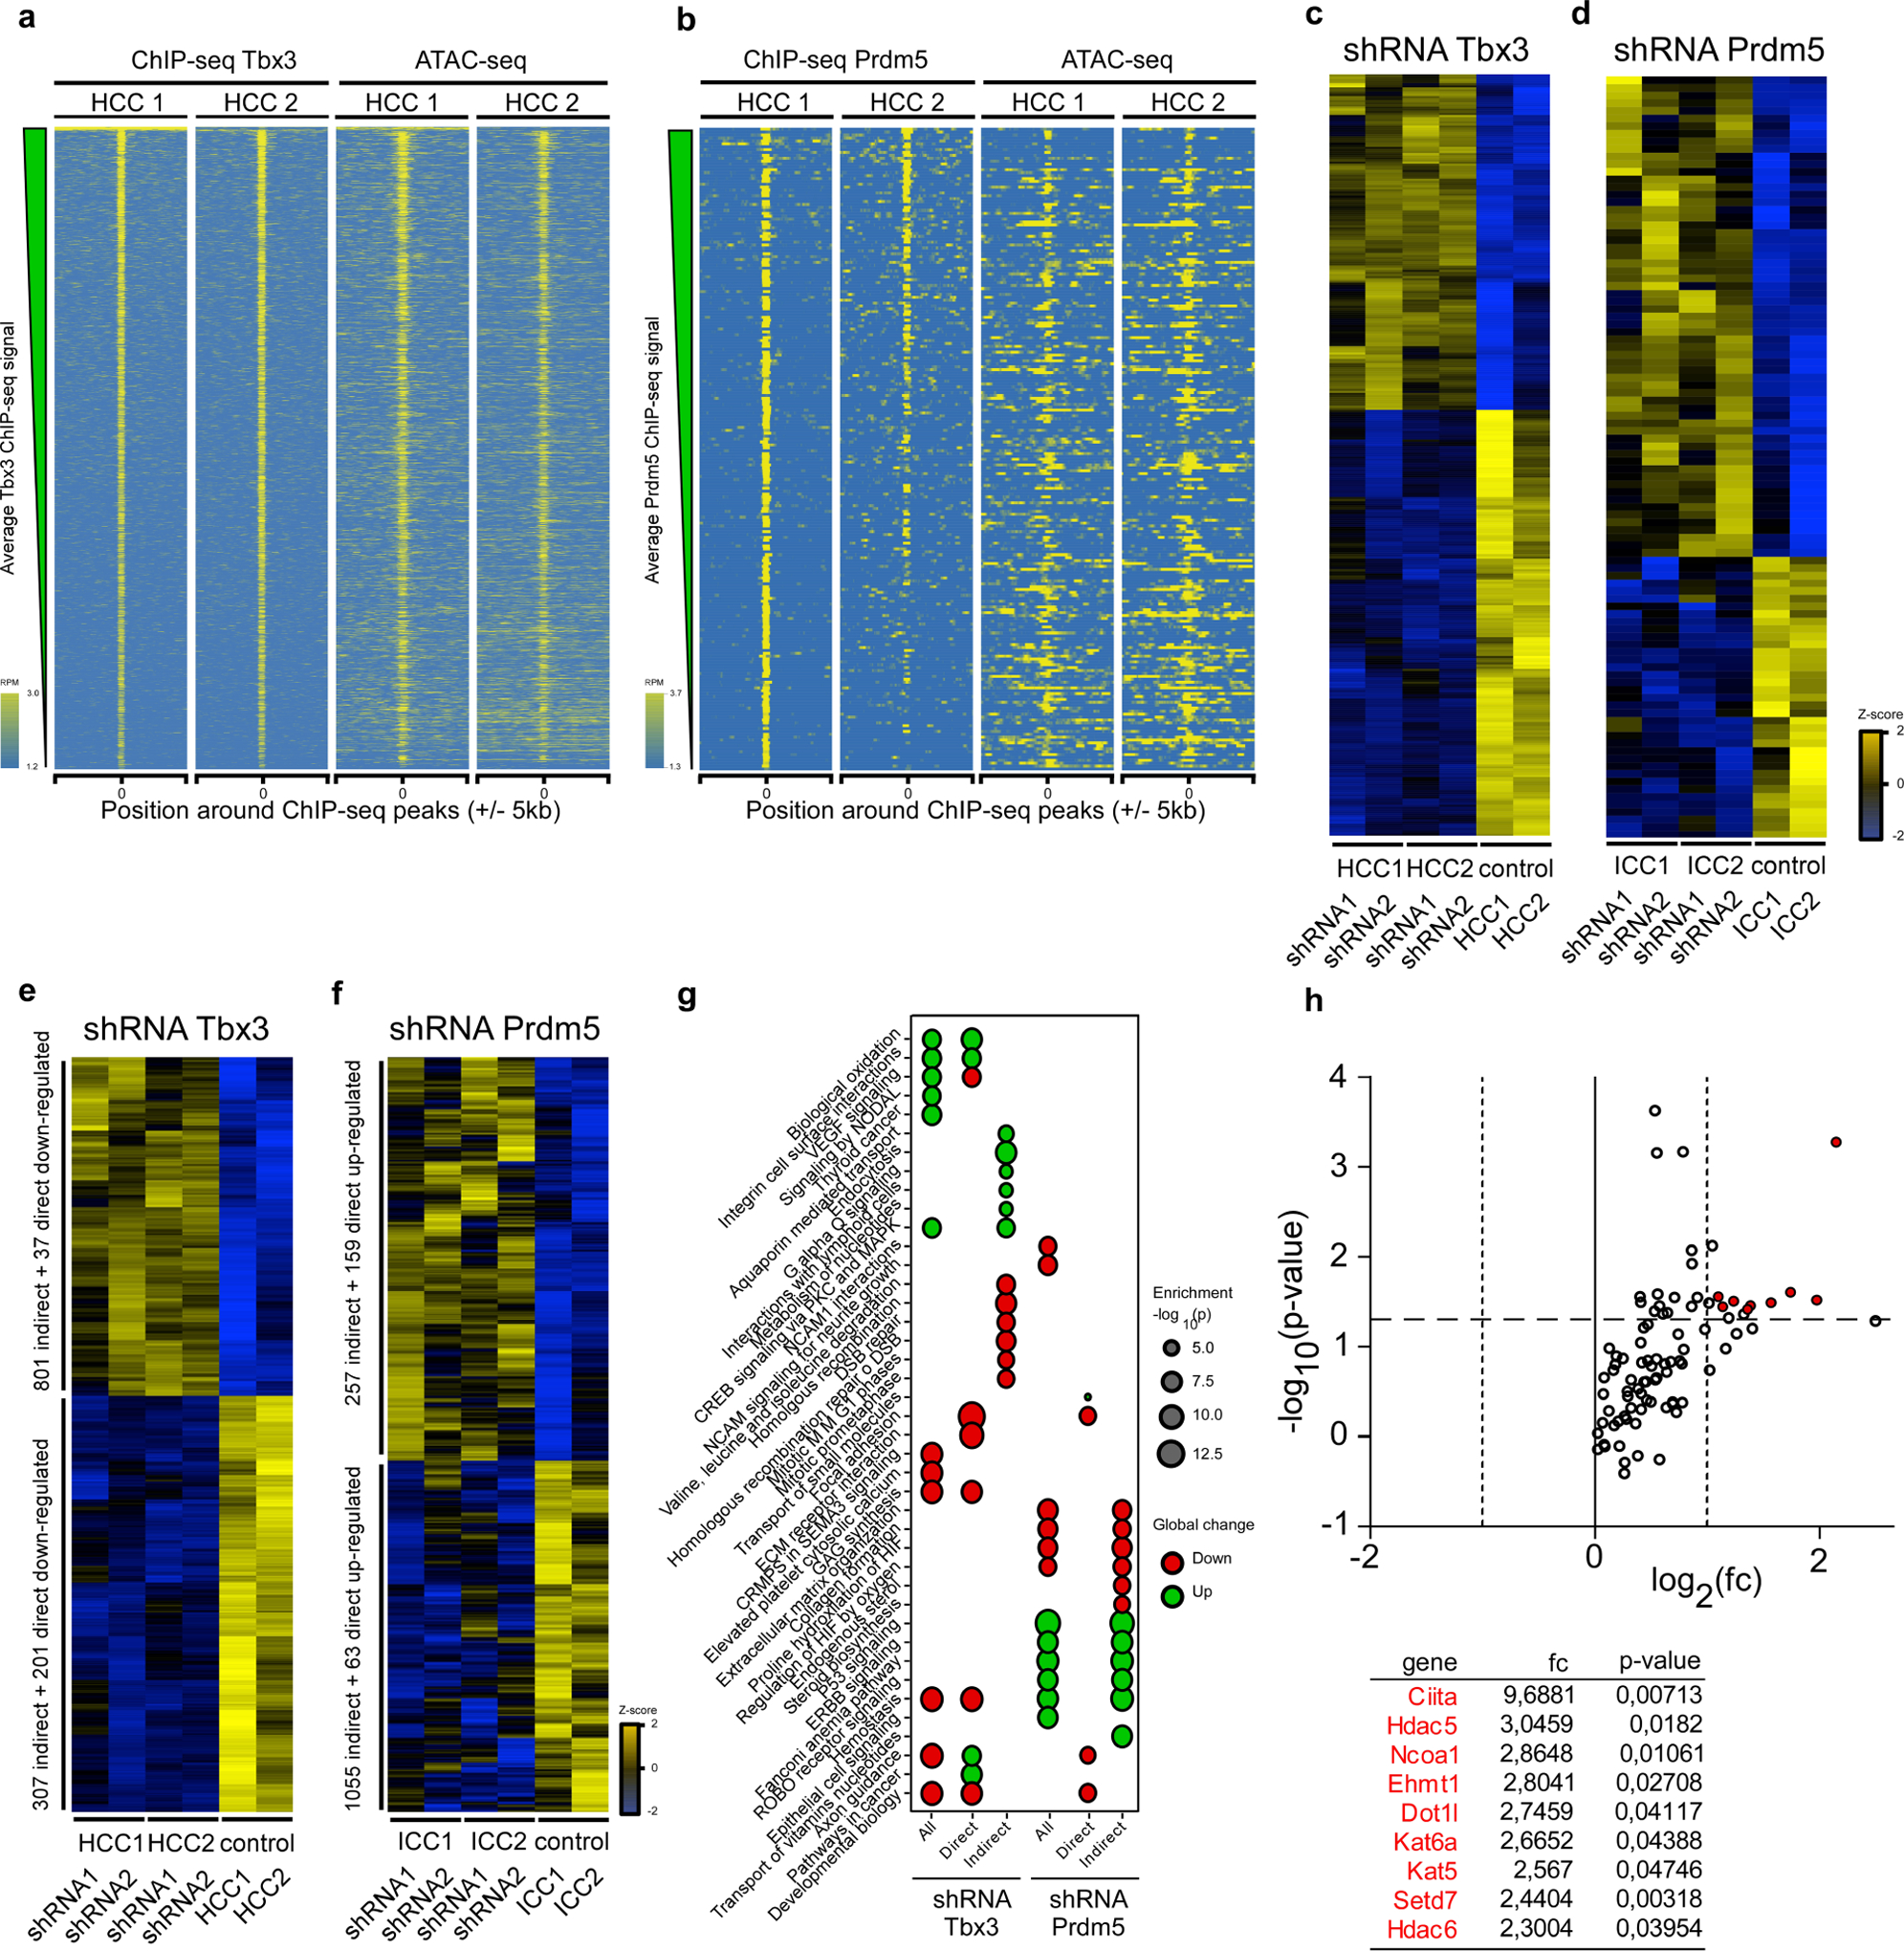
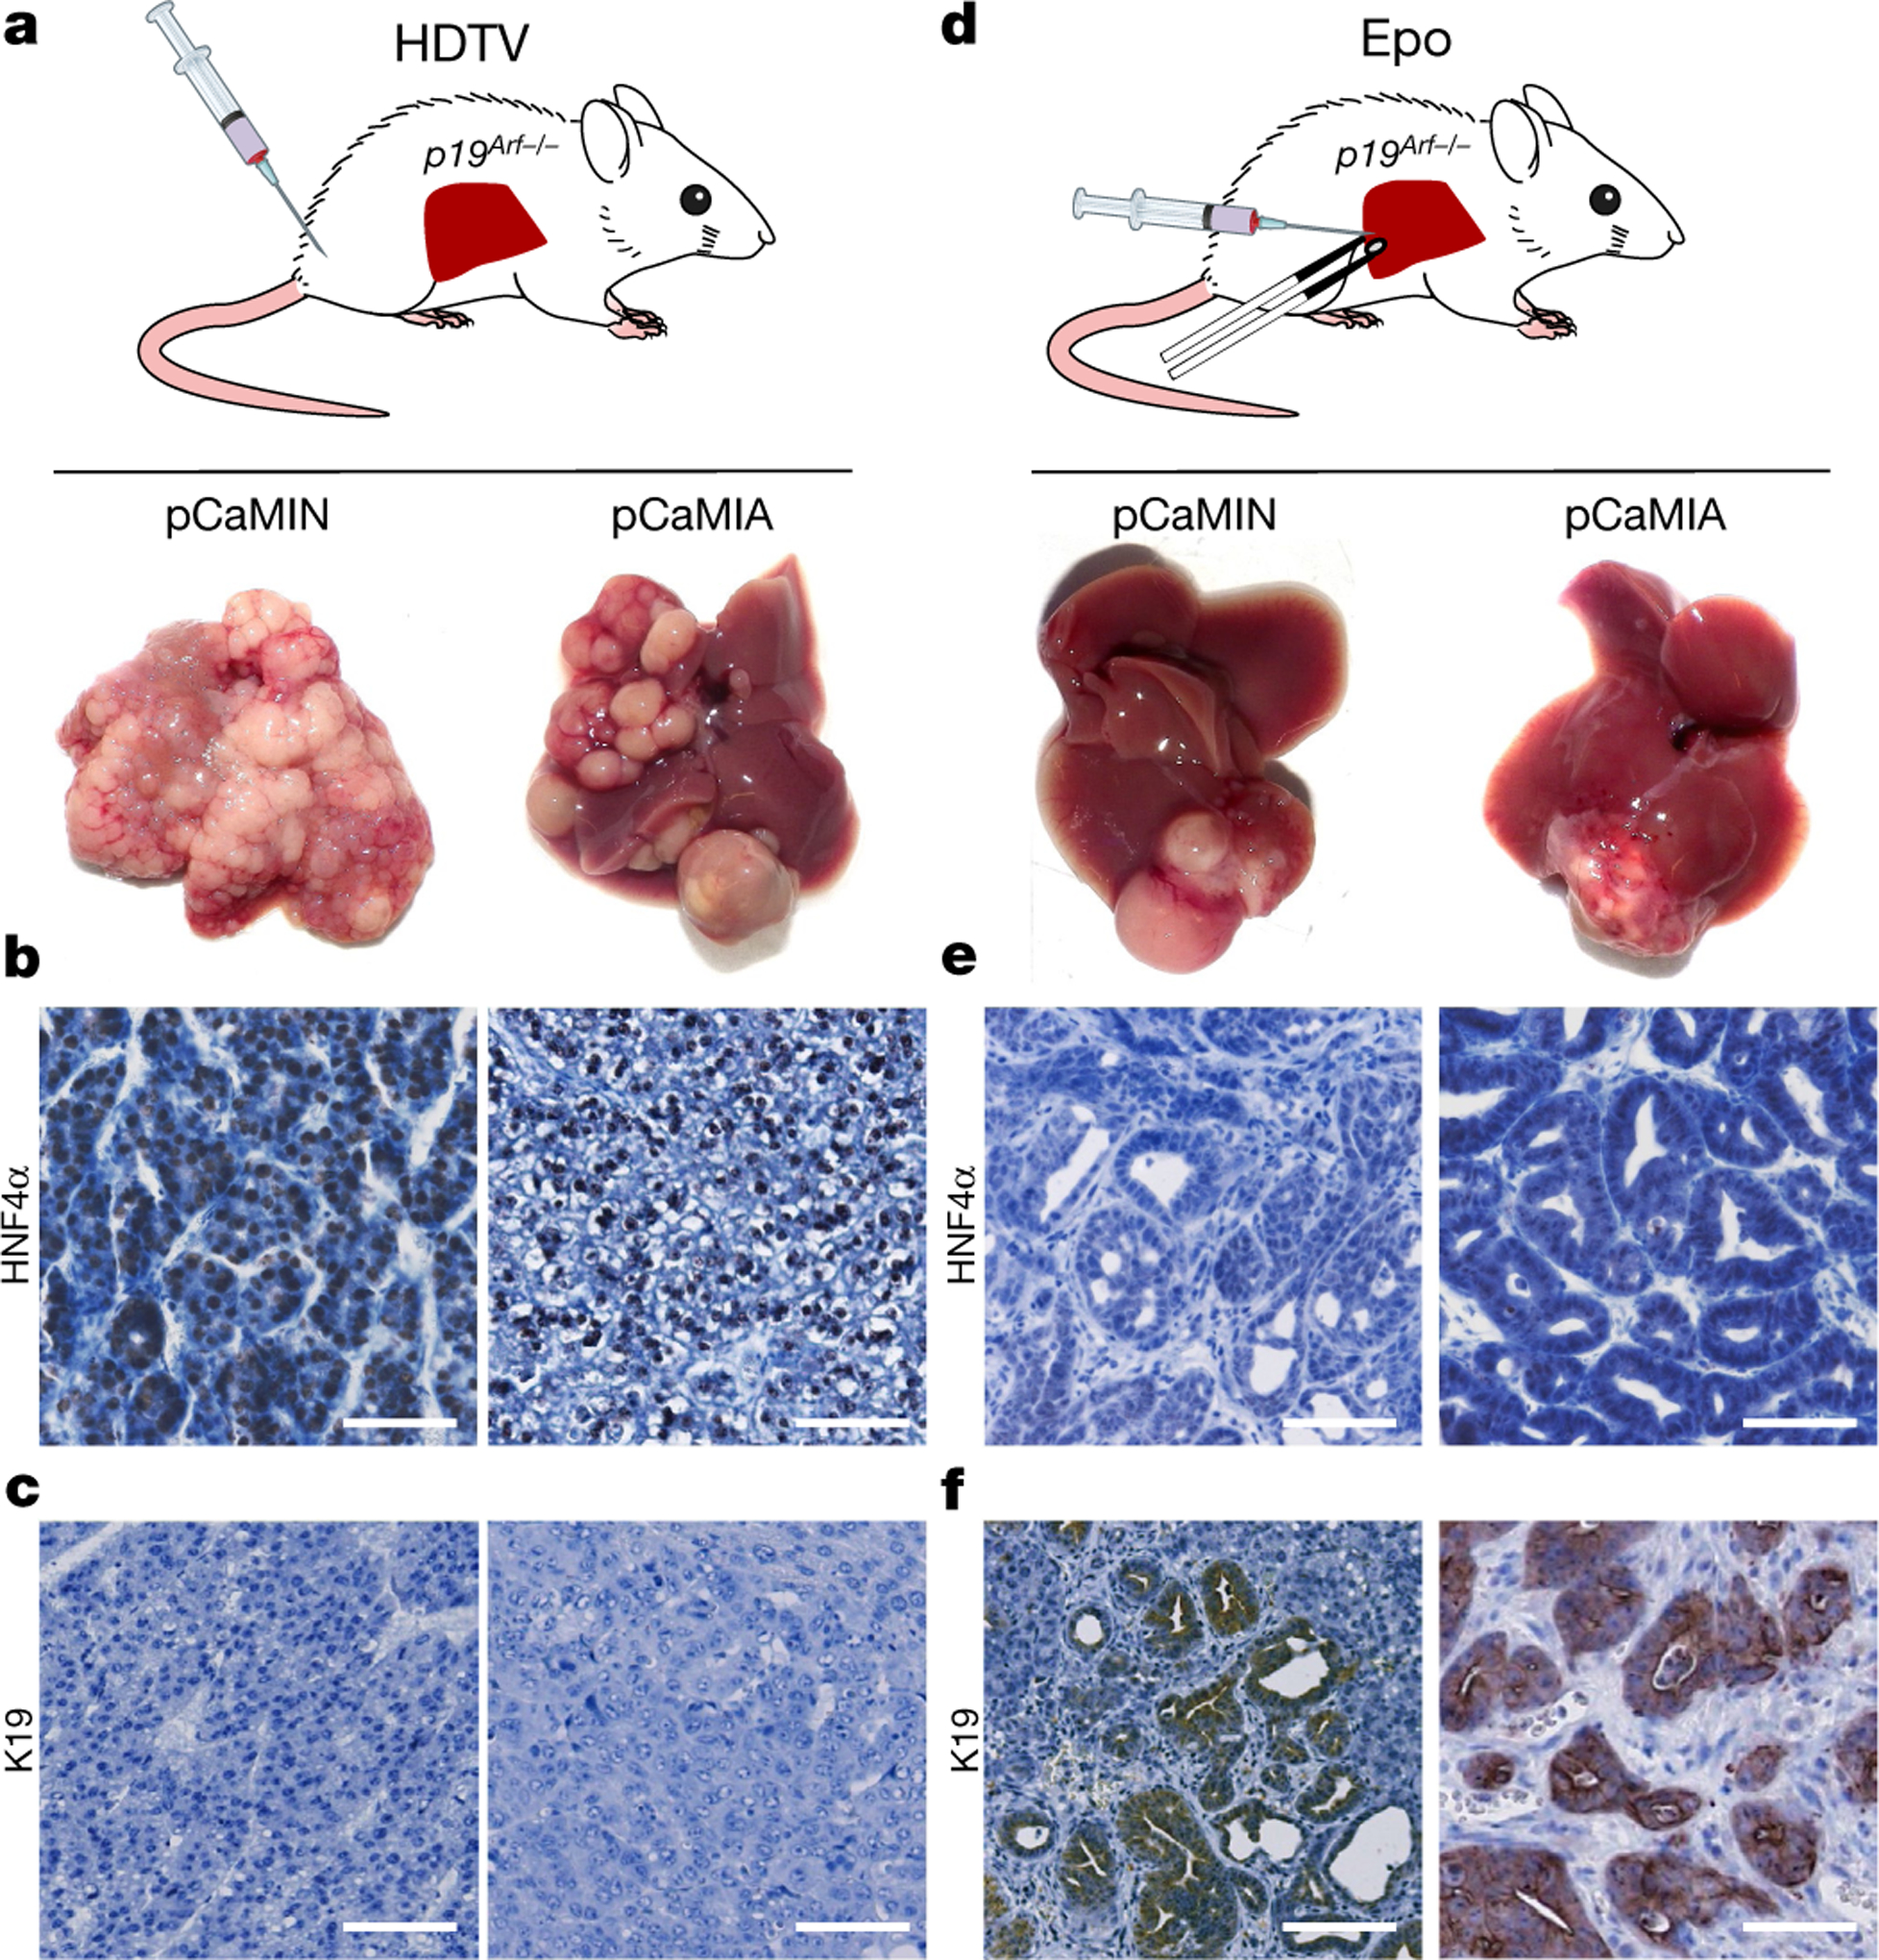
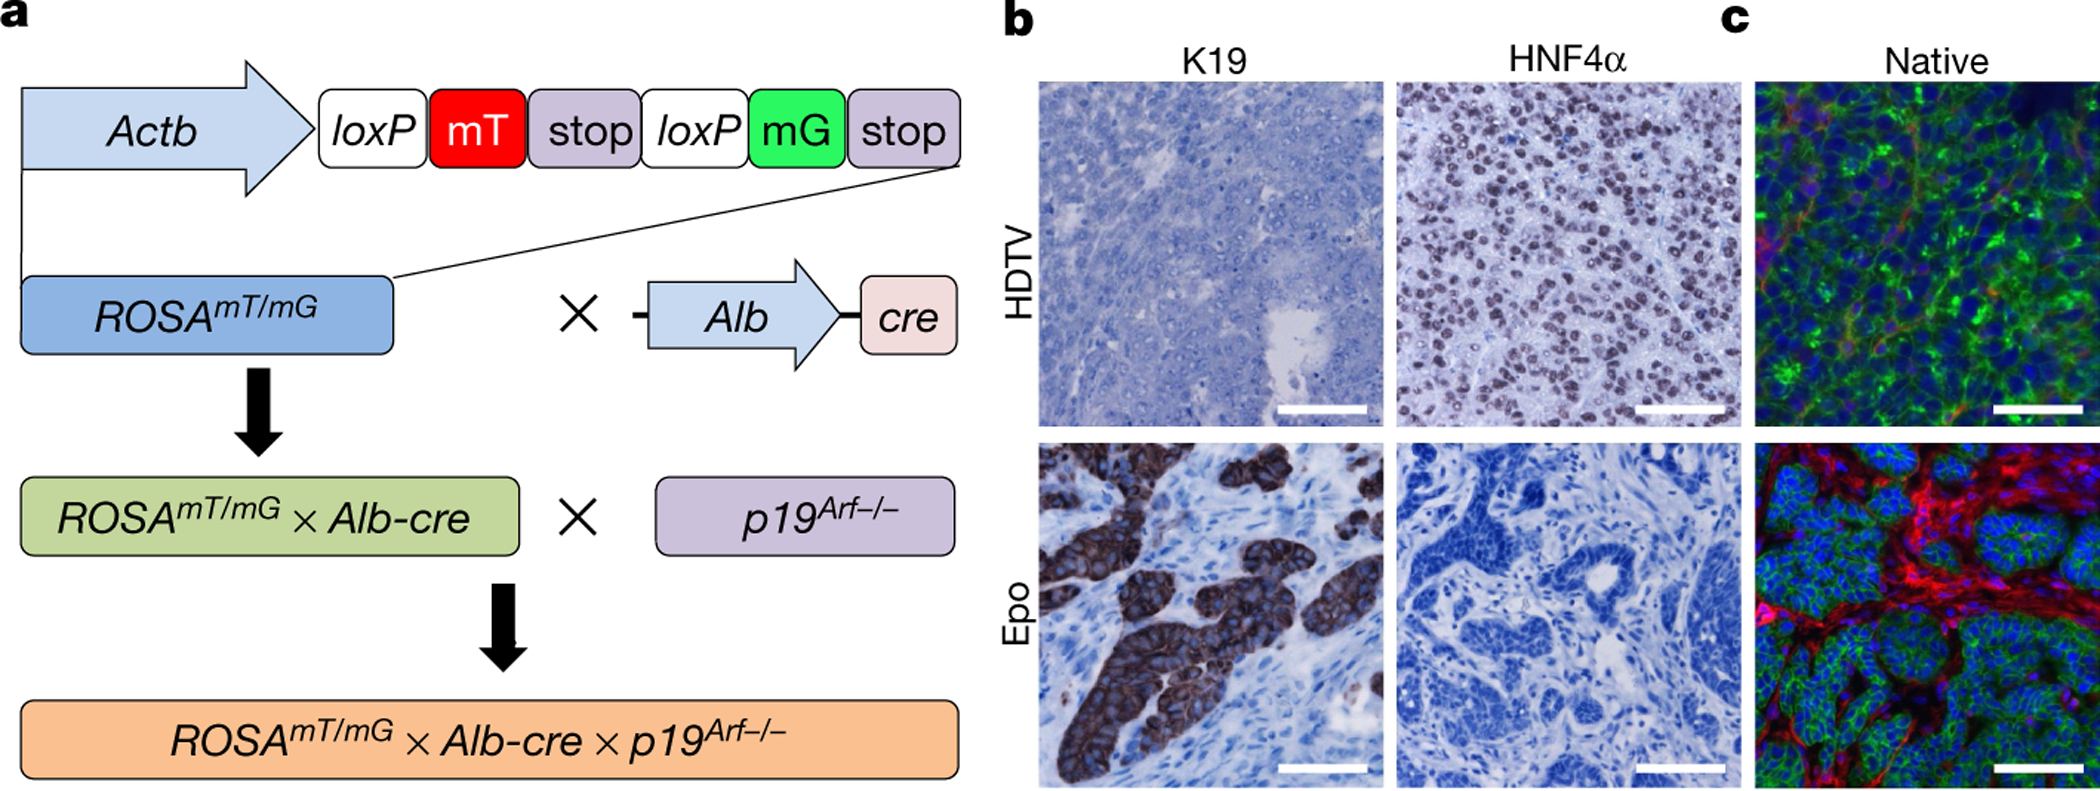
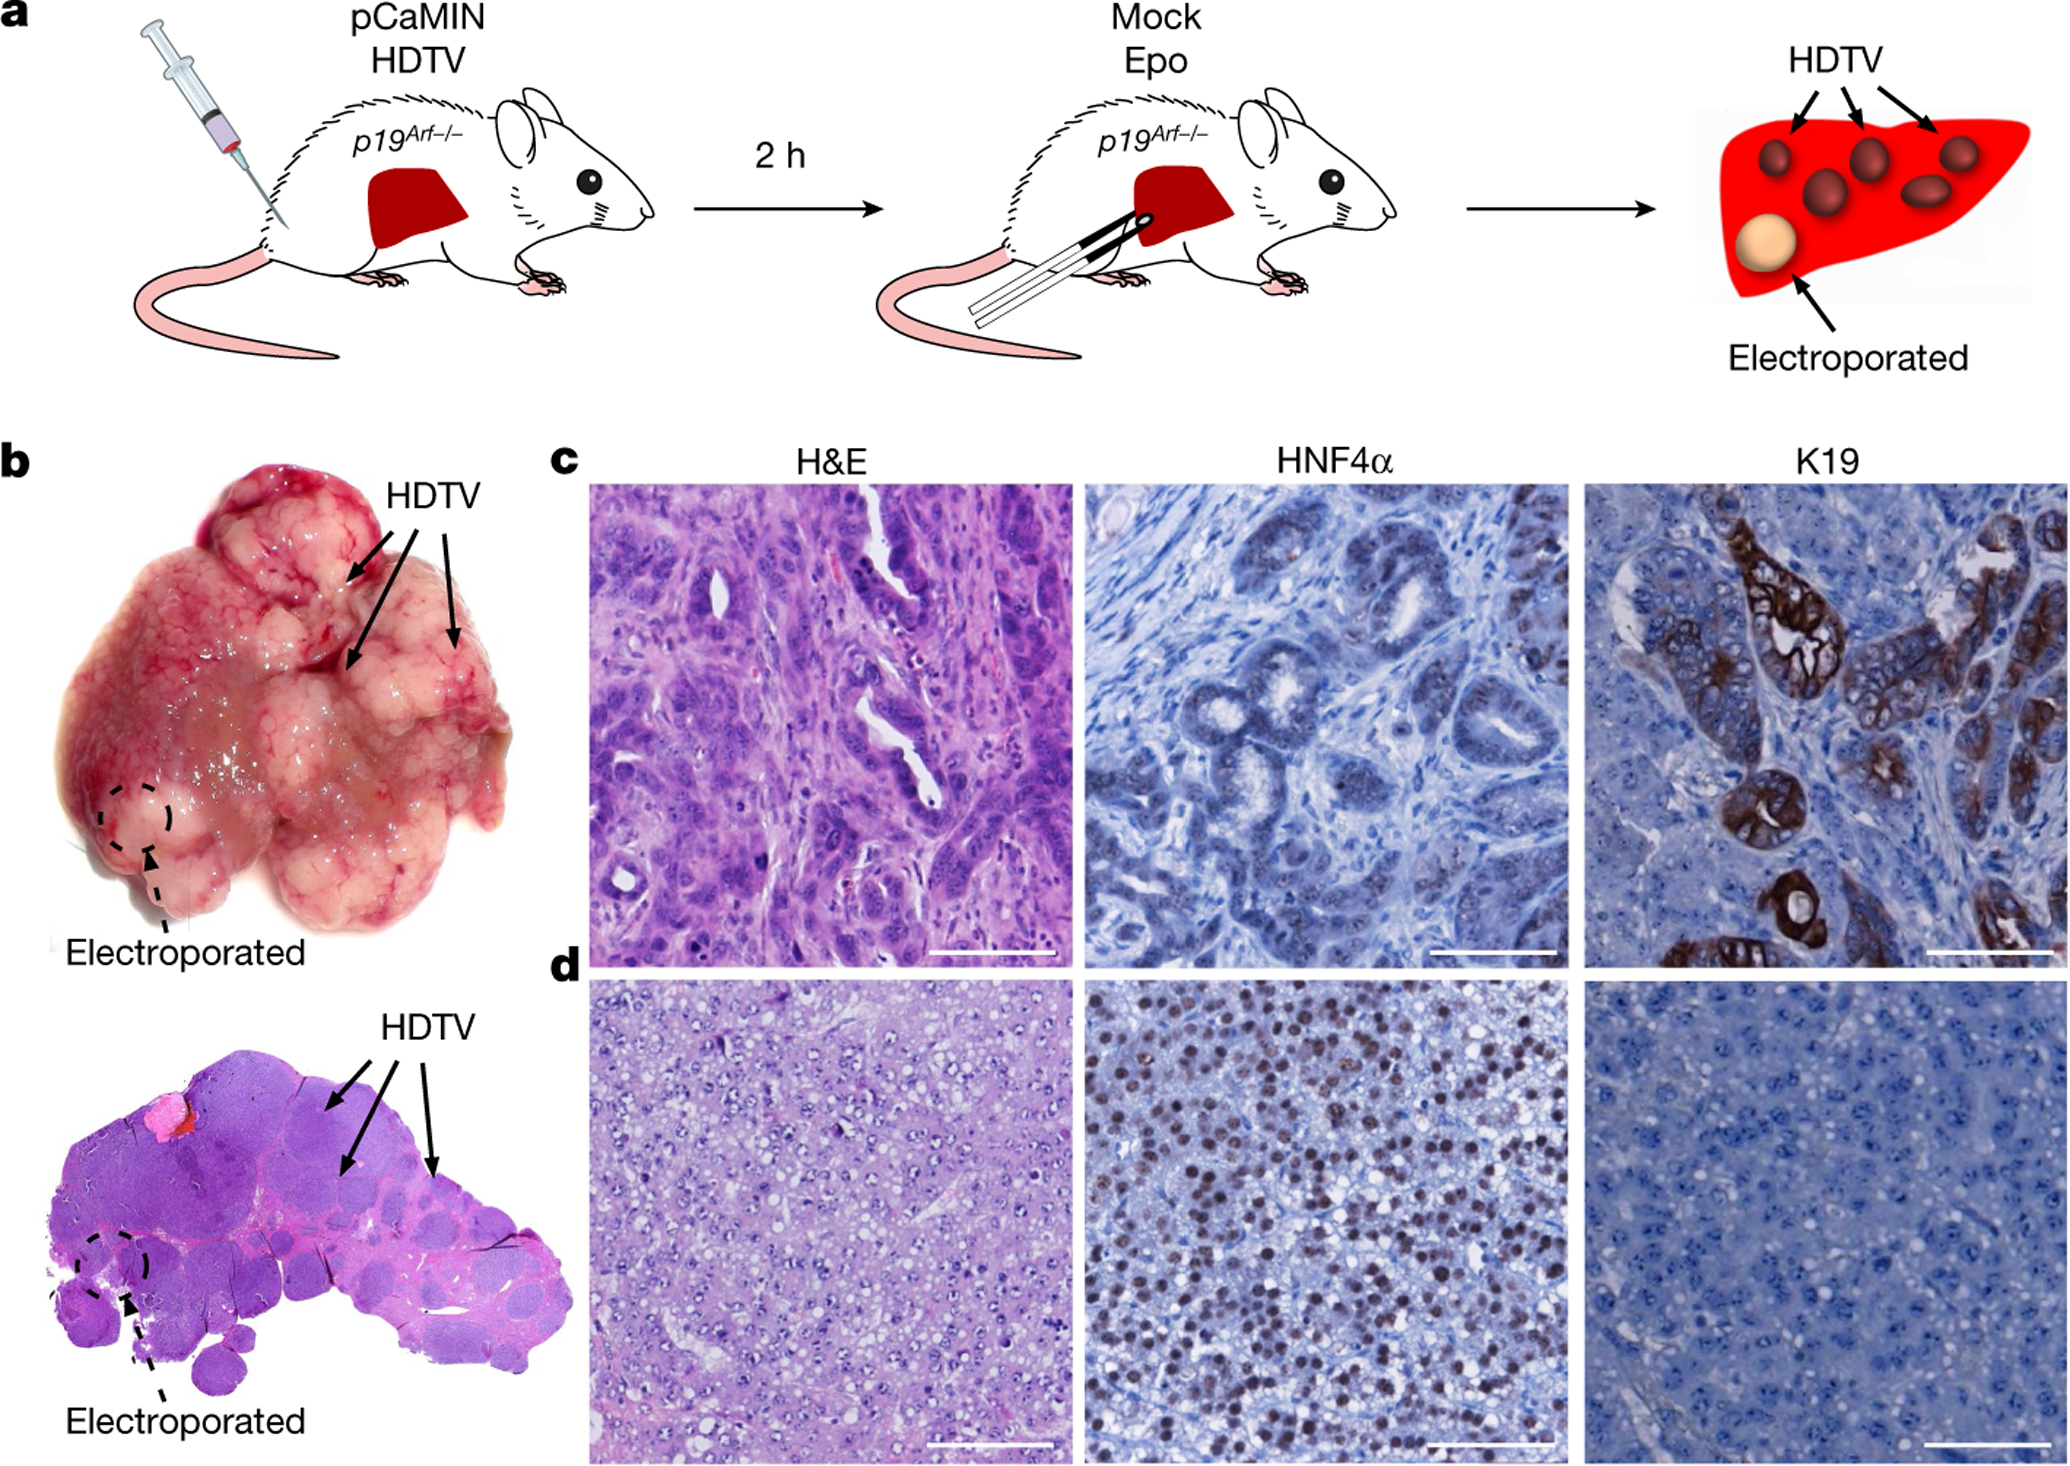
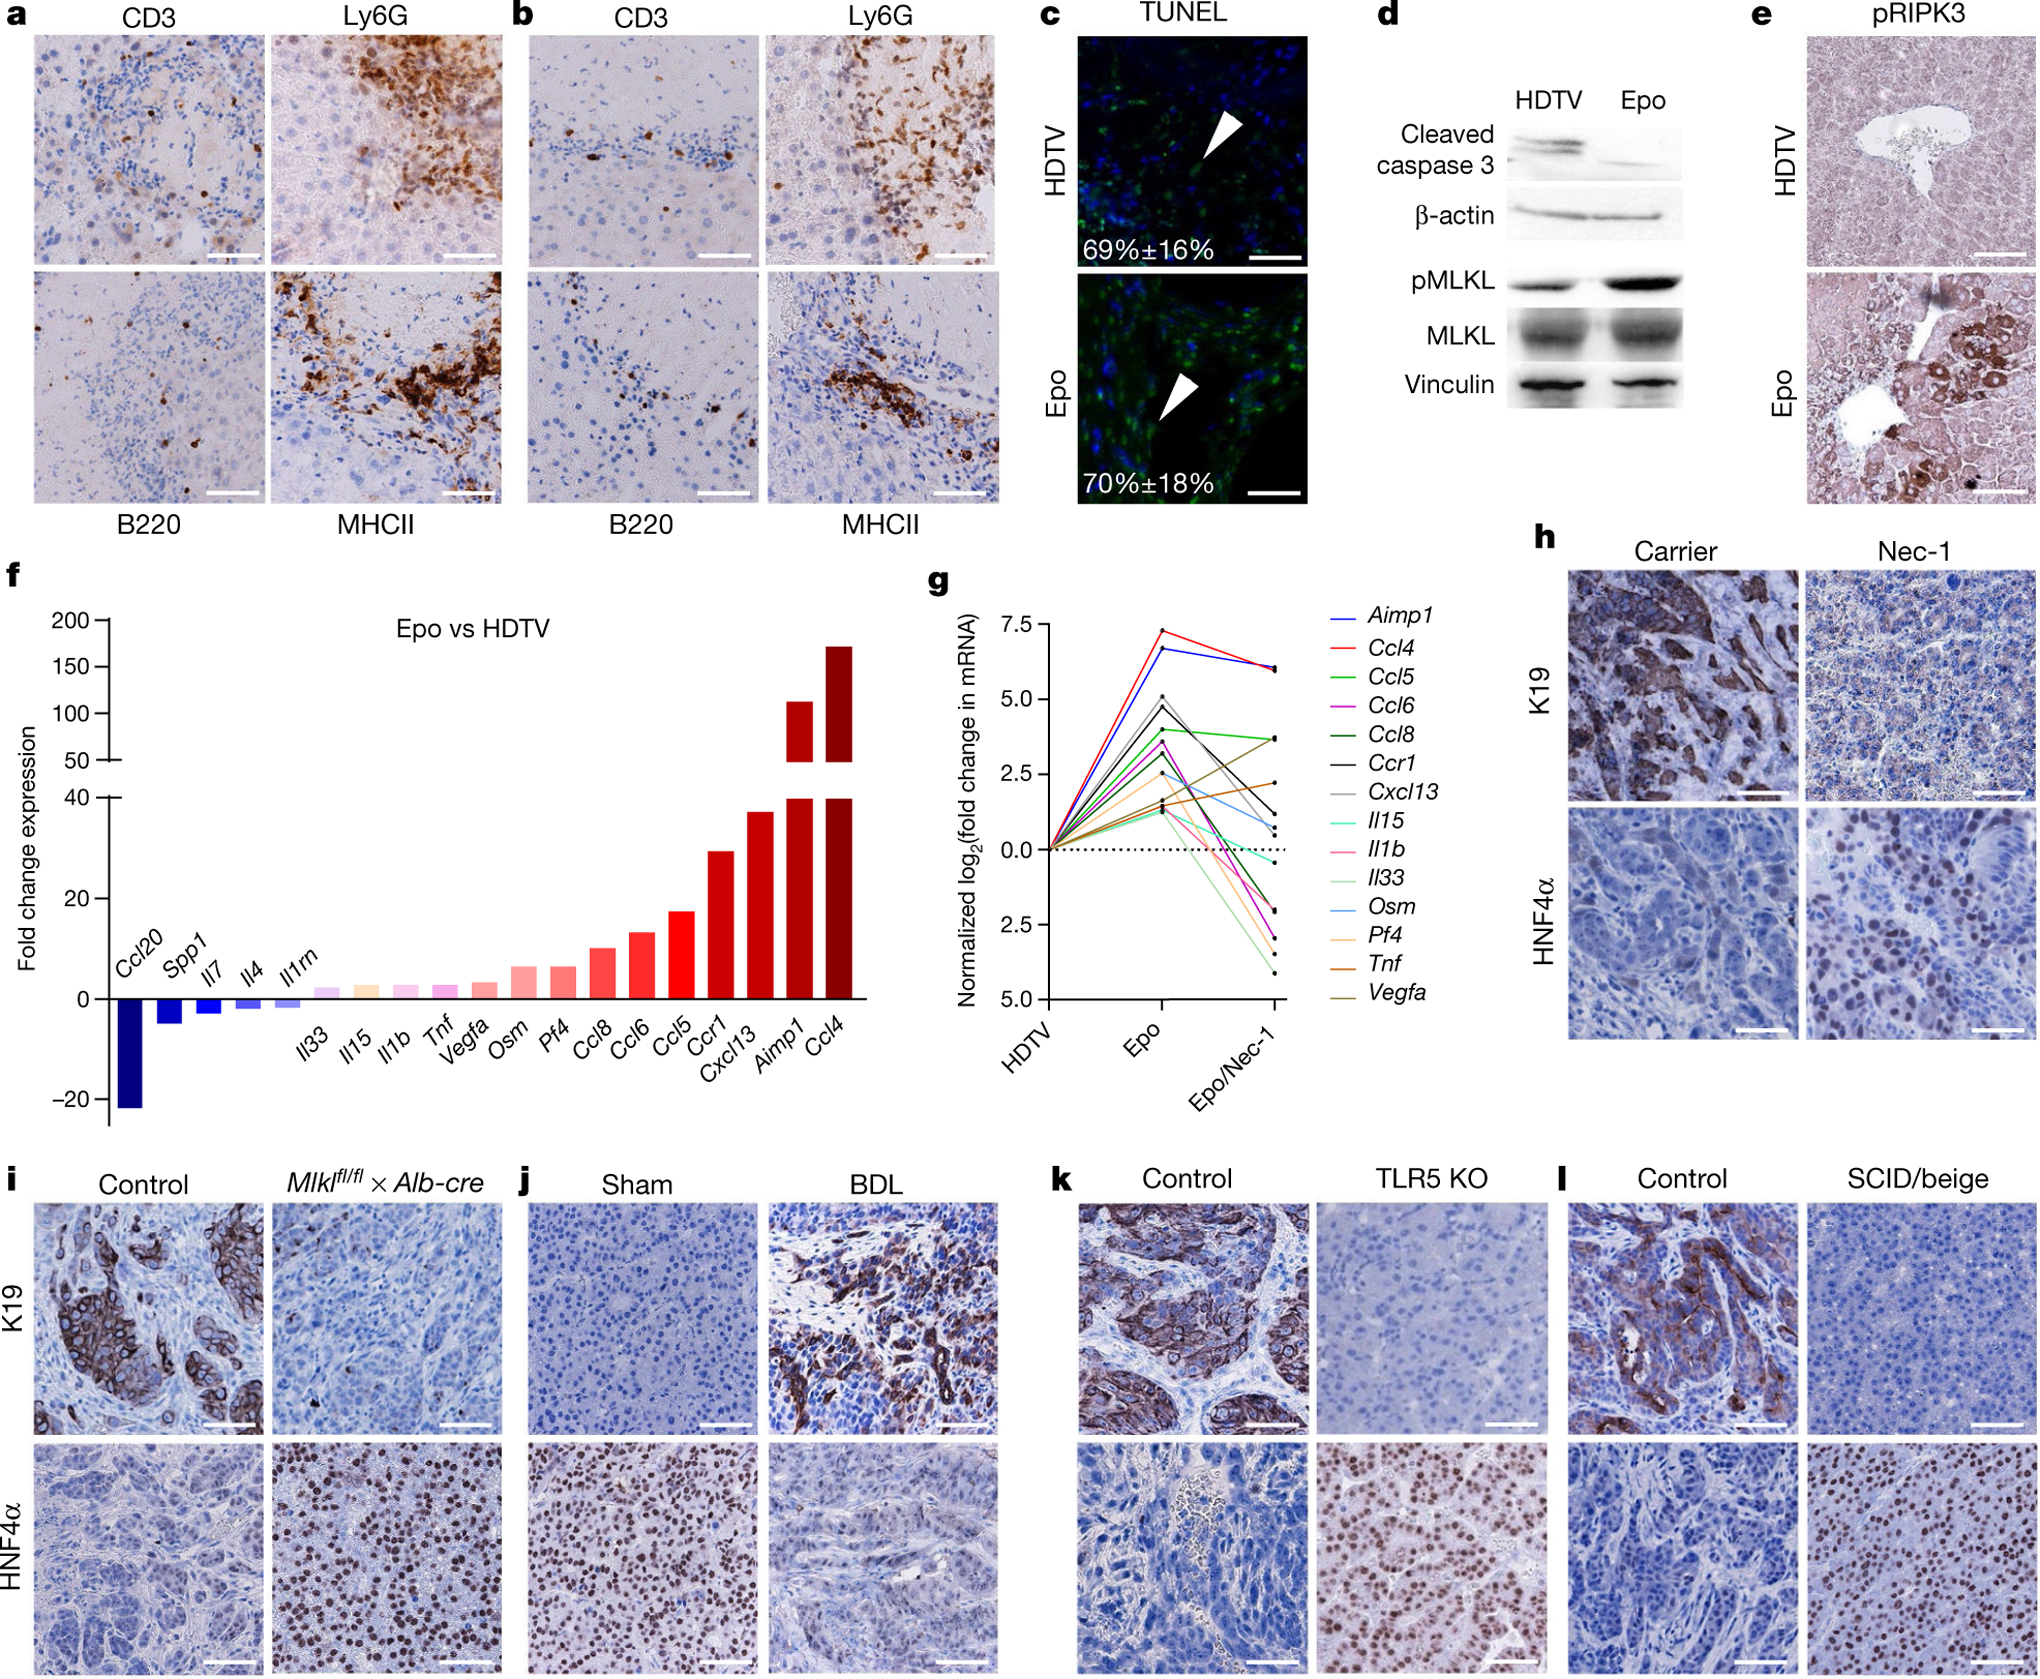
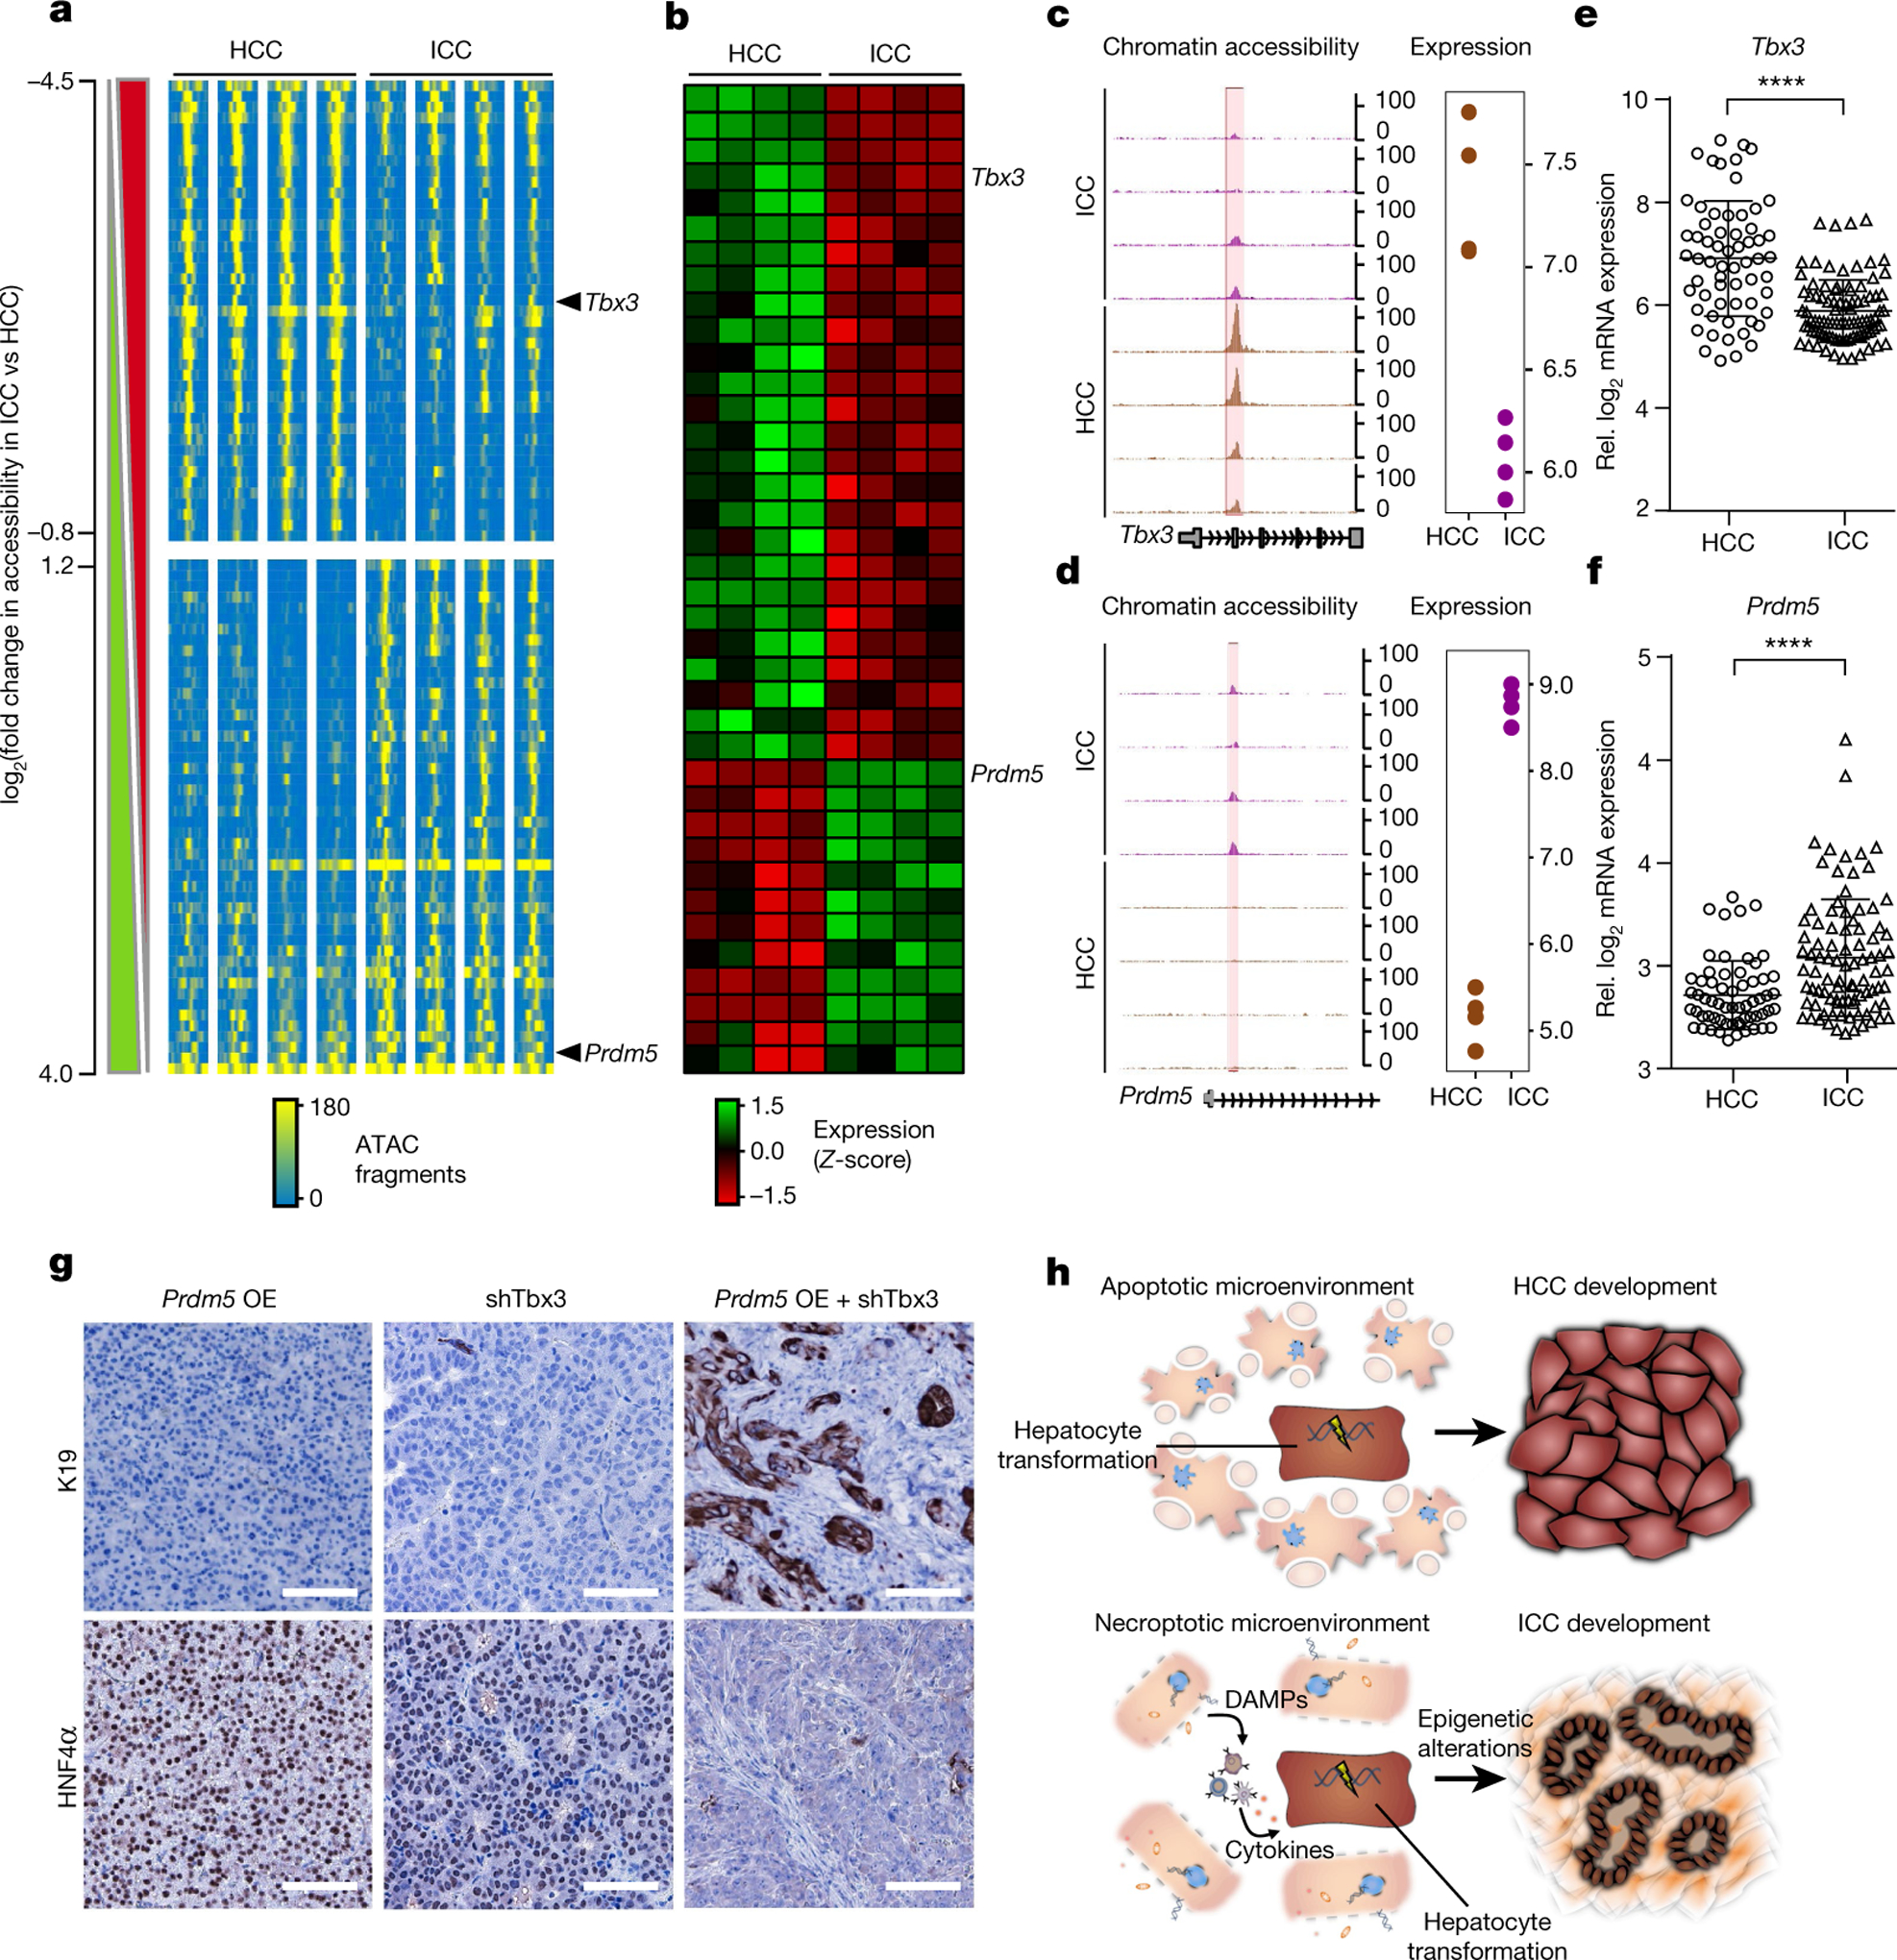
Primary liver cancer represents a major health problem. It comprises hepatocellular carcinoma (HCC) and intrahepatic cholangiocarcinoma (ICC), which differ markedly with regards to their morphology, metastatic potential and responses to therapy. However, the regulatory molecules and tissue context that commit transformed hepatic cells towards HCC or ICC are largely unknown. Here we show that the hepatic microenvironment epigenetically shapes lineage commitment in mosaic mouse models of liver tumorigenesis. Whereas a necroptosis-associated hepatic cytokine microenvironment determines ICC outgrowth from oncogenically transformed hepatocytes, hepatocytes containing identical oncogenic drivers give rise to HCC if they are surrounded by apoptotic hepatocytes. Epigenome and transcriptome profiling of mouse HCC and ICC singled out Tbx3 and Prdm5 as major microenvironment-dependent and epigenetically regulated lineage-commitment factors, a function that is conserved in humans. Together, our results provide insight into lineage commitment in liver tumorigenesis, and explain molecularly why common liver-damaging risk factors can lead to either HCC or ICC.


Conflict of interest statement

Competing interests The authors declare no competing interests.

Figures

Extended Data Fig. 1 |
Extended Data Fig. 1 |. Tumour phenotype depends on the delivery method of oncogene encoding transposons.
a, Schematic representation of transposon vectors encoding Myc and NrasG12V (pCaMIN) or Myc and AKT1 (pCaMIA) and a plasmid encoding the SB13 transposase. b, c, Representative micrographs of H&E staining of HDTV- or Epo-derived tumours. Scale bars, 100 μm. d, Histopathological scoring and quantification of tumours developed after hydrodynamic delivery of oncogene encoding transposons. e, Histopathological scoring and quantification of tumours developed after transposon delivery via in vivo electroporation. f, Representative image of native fluorescence microscopy of liver cryosections from ROSAmT/mG × Alb-cre × p19Arf−/− mice. In such mice, activation of the albumin promoter induces excision of a red fluorescence marker gene (mTomato) together with a stop codon flanked by loxP sites, thus resulting in a colour switch from red to green fluorescence (membrane-bound GFP). In this model, only fully differentiated hepatocytes (with high albumin promoter activity and therefore high levels of Cre expression) were able to induce the switch from red to green fluorescence, whereas liver cells with low albumin promoter activity such as embryonic hepatocytes or oval cells or liver progenitor cells were unable to accomplish such a colour change. Shown is mGFP expression in hepatocytes (green) and mTomato expression in bile duct cells or endothelial cells (red) (n = 3). Scale bar, 100 μm. g, h, Representative H&E staining images of tumours 4 weeks after HDTV (g) or Epo (h) transfection of the pCaMIN vector in ROSAmT/mG × Alb-cre × p19Arf−/− mice (n = 4). Scale bars, 100 μm. i, Representative images of DAPI-positive (blue), K19-positive (red) and native GFP-positive (green) hepatocytes in ICC derived from pCaMIN electroporated ROSAmT/mG × Alb-cre × p19Arf−/− mice (n = 6, left). Scale bars, 100 μm (left) and 20 μm (right). Data are from one experiment. j, qPCR analysis with transposon-specific primers on DNA isolated from HDTV- or Epo-induced tumours using (SB13) showed an approximately 1.5-fold increased transposon integration compared to tumours triggered by hydrodynamic delivery (HDTV). Epo-induced tumours using the SB10 transposase show equal transposon integration levels compared to HDTV-derived tumours with SB13 (n = 3). NS, not significant (P = 0.074); *P = 0.0011, Student’s two-sided t-test. Data are mean ± s.d. k, Representative images of H&E, K19 or HNF4α staining of Epo-induced tumours transfected using pCaMIN and SB10 (n = 3). Scale bars, 100 μm.
Extended Data Fig. 2 |
Extended Data Fig. 2 |. Exome sequencing reveals recurrent mutations in HCC and ICC.
a, Purification of epithelial components from HCC or ICC derived from pCaMIN electroporated p19Arf−/− mice and normal liver tissue as a control using laser capture microdissection (LCM) (n = 3 per group). Scale bars, 100 μm. b, Exome sequencing revealed recurrent mutations (in red), in which 12 mutations were found in at least 2 samples in 3 analysed HCC (left) and 3 ICC (right) tissues. c, Schematic outline of transposon vectors expressing Myc and NrasG12V (pCaMIN) and mutated (259G>T) Fam72a cDNA (bottom), which were co-delivered into p19Arf−/− mice. d, Immunohistochemical analysis of tumour tissue for K19 expression (n = 3 per group). Scale bar, 100 μm.
Extended Data Fig. 3 |
Extended Data Fig. 3 |. Characterization of early and pre-tumorigenic phase after Epo- or HDTV-mediated oncogene delivery.
a, Immunohistochemical analysis of p19Arf−/− deficient liver sections 5 days after Epo- or HDTV-mediated transposon delivery, showing microtumours in H&E (top) and Epo-derived K19-positive, HNF4α-negative ICCs (middle and bottom left panel) as well as HDTV-derived HNF4α-positive, K19-negative HCCs (middle and bottom right panel, indicated by white arrowheads) (n = 3). Scale bars, 100 μm. b, Schematic outline of the experimental approach (left) and representative macroscopic liver photographs 3 days after hydrodynamic (HDTV) or Epo delivery of the pCaMIN and SB13 vectors into p19Arf−/− mouse livers. Macroscopically visible liver damage (left) as well as eosinonophilic areas indicating microscopic liver damage (right) are shown on H&E-stained liver sections (n = 4). Original magnification, ×200.
Extended Data Fig. 4 |
Extended Data Fig. 4 |. Immune composition does not contribute to lineage commitment in liver cancer.
a, Representative micrographs of αSMA immunohistochemistry (top) and quantification (bottom) 3 days after Epo and HDTV treatment in p19Arf−/− livers and quantification (n = 2). Scale bars, 100 μm. Data are mean ± s.d. b, Representative micrographs of F4/80 immunofluorescence (top) and quantification (bottom) 3 days after Epo and HDTV treatment in p19Arf−/− livers (n = 3). Scale bar, 100 μm. NS, P = 0.500, Student’s two-sided t-test. Data are mean ± s.d. c, Flow cytometry analysis showing the efficiency of clodronate in depleting Kupffer cells (CD45+F4/80+) after lipopolysaccharide (LPS) treatment (n = 3). Bottom, representative micrographs of HNF4α and K19 immunostaining analysis of Epo-induced tumours with and without Kupffer cell depletion (n = 3). Scale bar, 100 μm. d, Quantifications of liver-infiltrating immune cells from Fig. 4a, b. B220 P = 0.6255, CD3 P = 0.7649, Ly6G P = 0.3966, MHCII P = 0.9889, Student’s two-sided t-test. Data are mean ± s.d. e, Quantification of T cells (CD45+CD3+, P = 0.2622), T-helper cells (CD45+CD3+CD8CD4+, P = 0.960) and killer T cells (CD45+CD3+CD8+CD4, P = 0.0914) (n = 6). P values determined by Student’s two-sided t-test. Data are mean ± s.d. f, Quantification of monocytic immature myeloid cells (moIMC; CD11b+Gr1−lowLy6c+F4/80, P = 0.0750), neutrophilic immature myeloid cells (NeuIMC; CD11b+Gr1+Ly6cF480, P = 0.2483) and macrophages (CD11b+Gr1Ly6cF4/80+, P = 0.1744) (n = 3). P values determined by Student’s two-sided t-test. Data are mean ± s.d.
Extended Data Fig. 5 |
Extended Data Fig. 5 |. Induction of hepatocyte cell death after HDTV or Epo.
a, Representative micrographs of TUNEL (red) and DAPI (blue) staining in livers of ROSAmT/mG × Alb-cre × p19Arf−/− mice with native membrane GFP (green) in hepatocytes 3 days after Epo or HDTV transfection (n = 3). Scale bars, 100 μm. b, Ripk3 mRNA expression in p19Arf−/− livers 3 days after HDTV delivery of pCaMIN compared to Epo delivery of pCaMIN, determined by qRT–PCR (n = 4). *P = 0.0485, Student’s two-sided t-test. Data are mean ± s.d. c, Representative immunhistochemistry of RIPK3 in livers 3 days after Epo or HDTV treatment (n = 3). Scale bars, 100 μm.
Extended Data Fig. 6 |
Extended Data Fig. 6 |. Necroptotic cell death affects the hepatic microenvironment and tumorigenesis.
a, Representative TUNEL (green) and DAPI (blue) staining in liver sections from mice with (n = 4) or without (n = 3) Nec-1 pre-treatment 3 days after Epo transfection. Scale bar, 100 μm. b, Quantification of TUNEL-positive cells from mice with (n = 4) or without (n = 3) Nec-1 pre-treatment 3 days after Epo transfection. *P = 0.0264, Student’s two-sided t-test. Data are mean ± s.d. c, Western blot analysis for the apoptosis marker cleaved caspase 3 in liver lysates from livers with (n = 4) or without (n = 3) Nec-1 pre-treatment 3 days after Epo transfection. d, Western blot analysis for MLKL and pMLKL in liver lysates from livers with (n = 4) or without (n = 3) Nec-1 pre-treatment 3 days after Epo transfection. e, Immunohistochemistry quantification of B220 (P = 0.7745), CD3 (P = 0.9809), Ly6G (P = 0.0075) or MHCII (P = 0.0994) in livers with or without Nec-1 pre-treatment 3 days after Epo transfection (n = 3). P values determined by Student’s two-sided t-test. Data are mean ± s.d. f, Magnification of photographs depicted in Fig. 4k, right. Quantification of HNF4α-positive cells in Epo-induced tumours with or without Nec-1 pre-treatment (n = 4). *P = 0.0407, Student’s two-sided t-test. Data are mean ± s.d. g, Western blot analysis of MLKL on lysates from hepatocytes isolated via perfusion from Mlklfl/fl × Alb-cre−/− or Mlklfl/fl × Alb-cre+/− mice. The experiment was done once with two independent Mlklfl/fl × Alb-cre+/− mice and one Mlklfl/fl × Alb-cre−/− mouse). h, Western blot analyses for MLKL, pMLKL and vinculin on lysates from Mlklfl/fl × Alb-cre+/− mice 3 days after Epo treatment. Depicted blot is as shown in Fig. 4d (bottom), with an additional lane showing the pMLKL signal obtained in Mlklfl/fl × Alb-cre−/− mice 3 days after Epo treatment. The experiment was performed twice with similar results. i, Quantification of the duration until tumour size exceeds 0.5 cm after Epo delivery of pCaMIN in p19Arf−/− mice or pCaMIN plus Cas9n and sgRNA against p19Arf in wild-type mice (n = 7). NS, P = 0.0913, Student’s two-sided t-test. Data are mean ± s.d. j, Immunohistochemistry quantification of B220 (P = 0.9220), CD3 (P = 0.1577), Ly6G (P = 0.2375) or MHCII (P = 0.3870) in liver sections from Mlklfl/fl × Alb-cre−/− or Mlklfl/fl × Alb-cre+/− mice 3 days after Epo treatment (n = 3). P values determined by Student’s two-sided t-test. Data are mean ± s.d. k, qPCR-based necroptosis-associated cytokine profile measured on mRNA isolated from livers of Mlklfl/fl × Alb-cre−/− or Mlklfl/fl × Alb-cre+/− mice 3 days after Epo treatment. Overlapping downregulated cytokines with Nec-1-treated mice are indicated in green (compare to Fig. 4g). From the 11 cytokines that were found to be suppressible by Nec-1 treatment (Fig. 4g), the expression of 6 was found to be attenuated in Epo-treated MLKL-deficient livers as compared to wild-type livers. This difference might be explained by Nec-1-mediated inhibition of RIPK1-dependent signalling in cells other than hepatocytes. This could also explain why Nec-1 treatment reduced the Ly6G-positive cells in Epo livers (compare to Extended Data Fig. 6e), whereas MLKL deficiency had no effect on the numbers of Ly6G-positive cells after Epo treatment (compare to Extended Data Fig. 6j) (n = 2). Data are fold change of the mean from each group. l, Quantification of HNF4α-positive cells in liver sections of Epo-induced tumours in Mlklfl/fl × Alb-cre−/− or Mlklfl/fl × Alb-cre+/− mice (n = 5). *P = 0.0381, Student’s two-sided t-test. Data are mean ± s.d. m, Representative photograph of HNF4α and K19 staining of pCaMIN Epo-derived tumours in Mlkl wild-type × Alb-cre+/− mice (n = 2). n, Representative micrographs of pRIPK3 immunohistochemistry in tissue sections from sham-operated or bile duct ligated livers of Arfp19−/− mice (n = 3 each). Scale bars, 100 μm. o, Western blot analyses for MLKL and pMLKL on liver lysates from sham-operated or bile duct ligated Arfp19−/−mice (n = 3 each).
Extended Data Fig. 7 |
Extended Data Fig. 7 |. Necroptosis signatures are found in primary human liver carcinomas.
a, Transcriptomic patterns of apoptosis- (n = 84) or necroptosis- (n = 10) related genes in patients with HCC and ICC (n = 199) analysed via hierarchal clustering analysis. b, Gene expression of RIPK3 in ICC and HCC patient samples from the TIGER-LC cohort(n = 199). P < 0.0001, Student’s two-sided t-test. Data are mean ± s.d. c, Western blot analysis for MLKL and pMLKL in lysates from TLR-knockout and p19Arf−/− mouse livers 3 days after Epo treatment. The experiment was performed once (n = 4 mice each). d, Immunohistochemistry quantification of B220 (P = 0.6698), CD3 (P = 0.2846), Ly6G (P = 0.9362) or MHCII (P = 0.6734) in livers from TLR5-knockout or syngeneic wild-type mice 3 days after Epo treatment (n = 3). P values determined by Student’s two-sided t-test. Data are mean ± s.d. e, qPCR-based cytokine profile of necroptosis-associated pattern in TLR5-knockout or syngeneic wild-type mice 3 days after Epo treatment (n = 2). Data are fold change of the mean from each group. f, Quantification of HNF4α-positive cells in Epo-induced tumours in TLR KO (TLR2, 3, 4, 7 and 9-knockout) (n = 3) or syngeneic wild-type (n = 4) mice. *P = 0.0255, Student’s two-sided t-test. Data are mean ± s.d. g, Representative micrographs of HNF4α and K19 staining on sections from tumours triggered by pCaMIN Epo delivery in TLR2 and TLR4 knockout or syngeneic wild-type mice (n = 5). Scale bar, 100 μm.
Extended Data Fig. 8 |
Extended Data Fig. 8 |. Generation and analysis of clonally derived cell lines from HDTV or Epo tumours.
a, Immunocytochemistry of isolated single cell lines of HDTV-derived HCC and Epo-derived ICC tumours. Depicted are representative co-staining images of K19 (red) and DAPI (blue). Scale bars, 100 μm. Experiment was performed twice with similar results. b, Schematic outline of the generation of clonal cell lines of Epo and HDTV tumours for subcutaneous injection into immunodeficient Rag2−/− mice. c, Representative micrographs of sections from subcutaneously grown HCC (see b; top) and ICC (bottom) with H&E (left) and K19 (right) staining. These data show that both HCC and ICC phenotypes are stably maintained even after in vitro passaging and in vivo retransplantation procedures in mice (n = 3). Scale bars, 100 μm. d, Bi-clustering of pairwise Pearson’s correlations based on normalized ATAC-seq fragment pseudo-counts for differentially accessible areas in ICC (n = 4 single cell clones) and HCC (n = 4 single cell clones). e, f, qRT–PCR analysis for Tbx3 (e) or Prdm5 (f) in mouse HCC or ICC cells (n = 4 single cell clones each). ***P = 0.0004, ****P < 0.0001, Student’s two-sided t-test. Data are mean ± s.d.
Extended Data Fig. 9 |
Extended Data Fig. 9 |. Influence of PRDM5 and TBX3 on tumour phenotype.
a, Representative micrographs of immunostaining for HNF4α or K19 on tumour sections after Epo delivery of pCaMIN transposon vector co-expressing control shRNA (shRen) and full-length Tbx3 (pCAMINshRen + Tbx3 Epo) or pCaMIN vector co-expressing Prdm5 shRNA and full-length Tbx3 (pCAMINPrdm5_1 + Tbx3 Epo) (n = 3). Scale bars, 100 μm. b, Representative micrograph of tumours induced by Epo delivery of pCaMIN and Tbx3 overexpression in ROSAmT/mG × Alb-cre × p19Arf−/− mice showing DAPI (blue) and mGFP (green) positivity (n = 6). Scale bar, 100 μm. c, qRT–PCR analysis for Tbx3 in mouse HCC cells stably expressing shRNAs targeting Tbx3 (shTbx3_1 and shTbx_2; n = 3). Data are mean ± s.d. d, qRT–PCR analysis for Prdm5 in mouse ICC cells stably expressing shRNAs targeting Prdm5 (shPrdm5_1 and shPrdm5_2; n = 2). Data are mean ± s.d.
Extended Data Fig. 10 |
Extended Data Fig. 10 |. Direct and indirect changes of Tbx3 and Prdm5 targets and pathways.
a, b, ChIP–seq density heat map for two biological replicates in the global set of reproducible peaks detected for Tbx3 (a) and Prdm5 (a) following the irreproducible discovery rate workflow (a and b, left) and corresponding ATAC-seq signal (a and b, right). Peaks are ranked according to the average ChIP–seq signal across replicates. The data are expressed as normalized reads per million mapped reads (RPM). The signal is shown 5 kb upstream and downstream of the centre of the ChIP–seq peaks. c, d, Heat maps depicting gene expression changes after Tbx3 shRNA-mediated (c) and Prdm5 shRNA-mediated (d) suppression. Only direct Tbx3 and Prdm5 targets are shown. Data are expressed as z-score. For each transcription factor (TBX3 or PRDM5), n = 4 cases (2 shRNAs per target, biological duplicates for each) and n = 2 controls (1 control shRNA in duplicate), two-sided moderated t-statistics. e, f, Heat maps depicting gene expression changes after Tbx3 (e) and Prdm5 (f) shRNA-mediated stable knockdown. Each knockdown experiment was performed in established cell lines from two different clones using two different shRNAs. In these heat maps, both direct and indirect Tbx3 and Prdm5 ChIP–seq-derived gene targets are shown. Differentially regulated genes were separated into direct or indirect Tbx3 or Prdm5 targets based on the presence or absence of proximal ChIP–seq peaks (<100 kb from the TSS or inside the gene body of deregulated genes). Data are expressed as row Z-score. For each transcription factor (TBX3 or PRDM5), n = 4 cases (2 shRNAs per target, biological duplicates for each) and n = 2 controls (1 control shRNA in duplicate), two-sided moderated t-statistics. g, Functional over-representation map depicting MSigDB canonical pathways associated to all/direct target/indirect target genes perturbed after Tbx3 and Prdm5 knockdown. The size of dots is proportional to the P value based on the hypergeometric distribution obtained when testing for over-representation, and their colour denotes whether the term is enriched for up or downregulated gene list. These data show regulation of distinct downstream pathways between Tbx3 (for example, biological oxidation, developmental biology) and Prdm5 (for example, extracellular matrix organization, collagen formation or Erbb signalling) (n = 4 cases; 2 shRNAs per target, biological duplicates for each, and n = 2 controls; 1 control shRNA in duplicate). h, qRT–PCR analysis of epigenetic modifiers from livers 3 days after Epo or HDTV treatment. All significantly regulated genes are shown (n = 3). P values determined by Student’s two-sided t-test. Data are fold changes of the mean.
Fig. 1 |
Fig. 1 |. Intrahepatic delivery of transposable elements encoding Myc and NrasG12V or Myc and AKT1 into p19Arf−/− mice results in multifocal HCC or unilocular ICC.
a, Intrahepatic delivery of the transposable vectors pCaMIN (encoding Myc and NrasG12V; compare Extended Data Fig. 1a) (n = 11) or pCaMIA (encoding Myc and AKT1; compare Extended Data Fig. 1b) (n = 14) via HDTV results in multifocal tumour development after 4 weeks. b, c, Representative micrographs of immunohistochemistry staining against K19 (b) and HNF4α (c). Scale bar, 100 μm. d, Epo treatment of pCaMIN (compare Extended Data Fig. 1a) (n = 19) or pCaMIA (compare Extended Data Fig. 1b) (n = 8) results in the development of unilocular liver carcinomas 4 weeks after electroporation. e, f, Representative immunohistochemistry images of K19 (e) and HNF4α (f). Scale bars, 100 μm. Experiments were conducted in three independent cohorts.
Fig. 2 |
Fig. 2 |. In vivo lineage tracing identifies hepatocytes as cells of origin for ICC development.
a, ROSAmT/mG mice were crossed to Alb-cre mice. The resulting mice were intercrossed with p19Arf−/− mice to generate ROSAmT/mG × Alb-cre × p19Arf−/− mice. b, c, Representative images of tumours 4 weeks after HDTV (top) or Epo (bottom) treatment of the pCaMIN vector in ROSAmT/mG × Alb-cre × p19Arf−/−. Shown are immunohistochemistry staining results using antibodies against K19 and HNF4α (b) as well as native fluorescence (c) (n = 4). Scale bars, 100 μm.
Fig. 3 |
Fig. 3 |. Electroporation associated microenvironment determines outgrowth of ICC from hepatocytes.
a, Schematic experimental outline. Livers of p19Arf−/− mice were first hydrodynamically injected with pCaMIN and SB13 vectors and subsequently mock electroporated at a defined liver region. b, Macroscopic photograph of mouse liver (top) and corresponding representative haematoxylin and eosin (H&E) staining (bottom) 3 weeks after HDTV and subsequent mock Epo treatment (n = 3). Scale bars, 500 μm. (c, d) Representative photographs of H&E-(left panel), HNF4α- (middle panel) and K19 stained (right panel) tumours in the mock electroporated area (scale bar, 100 μm) or (d) outside (n = 3) (scale bar, 100 μm).
Fig. 4 |
Fig. 4 |. Necroptosis-dependent cytokine microenvironment determines cholangiocarcinoma development.
a, b, Immunohistochemistry for CD3, Ly6G, B220 and MHCII 3 days after HDTV (a) or Epo (b) transfection of pCaMIN and SB13 into p19Arf−/− mice (n = 4). Scale bars, 100 μm. c, TUNEL staining (green fluorescence, white arrowheads) and quantification on liver sections 3 days after pCaMIN transfection via HDTV (top) or Epo (bottom) (n = 3). Nuclei were counterstained blue with DAPI. Scale bars, 100 μm. d, Western blot for apoptosis marker cleaved caspase 3 (top) and total or phosphorylated MLKL (pMLKL) (bottom) in liver lysates after transfection via HDTV or Epo (n = 3). e, Immunohistochemistry for pRIPK3 3 days after transfection via Epo or HDTV (n = 3 each). Scale bars, 100 μm. f, Cytokine mRNA expression (fold change) in Epo- versus HDTV-treated liver after 3 days (n = 2). Data represent fold change of the mean from each group. g, Cytokine mRNA expression (fold induction) in Epo-treated versus HDTV-treated or Epo- and Nec-1-treated versus Epo-treated livers (n = 2). Data are log2 fold change of the mean from each group. h, Immunohistochemistry for K19 and HNF4α of mice pre-treated with carrier (left) or Nec-1 (right) before pCaMIN Epo transfection (n = 4). Scale bars, 100 μm. i, Immunohistochemistry for K19 and HNF4α on liver tumour sections of Mlklfl/fl × Alb-cre−/− (left) or Mlklfl/fl × Alb-cre+/− (right) mice after pCaMIN Epo transfection (n = 5). Scale bars, 100 μm. Compare to Extended data Fig. 6m. j, Immunohistochemistry for K19 and HNF4α. p19Arf−/− mice were subjected to HDTV and sham operation (control, left, n = 3), or bile duct ligation (BDL) and HDTV of pCaMIN (right, n = 5). Scale bars, 100 μm. k, Immunohistochemistry for K19 and HNF4α on liver sections from wild-type (n = 4) (left) or TLR knockout (KO; lacking TLR2, TLR3, TLR4, TLR7 and TLR9) (n = 3) mice (right) after pCaMIN Epo transfection. Scale bars, 100 μm. l, Immunohistochemistry for K19 and HNF4α on wild-type (n = 4) (left) or SCID/beige (n = 8) mice (right) after pCaMIN Epo transfection. Scale bars, 100 μm.
Fig. 5 |
Fig. 5 |. HCC and ICC derived from oncogenically transformed hepatocytes are defined by unique epigenetic signatures.
a, ATAC-seq density heat map of chromatin regions that are differentially accessible between HCC and ICC. Peaks are ranked according to the fold-change in signal in normalized ATAC fragment counts in ICC versus HCC. The data are expressed as smoothed normalized fragment pseudocounts in 25-base-pair (bp) windows ± 1 kb around the centre of peaks. The lateral bars on the left depict whether the ATAC signal is significantly increased (green) or decreased (red) in ICC compared to HCC as assessed with EdgeR. Tbx3- and Prdm5-associated regulatory elements are indicated. For each transcription factor (TBX3 or PRDM5), n = 4 cases, two-sided moderated t-statistics. b, Heat map of transcriptome data comparing HCC and ICC showing differentially expressed probes. Probes matching Tbx3 and Prdm5 are indicated by arrows. For each transcription factor (TBX3 or PRDM5), n = 4 cases, two-sided moderated t-statistics. c, d, Integrative analysis of chromatin accessibility (left) and transcriptome data (right) around Tbx3 (c) and Prdm5 (d) genes comparing HCC and ICC. Chromatin accessibility is expressed as smoothed, normalized fragment pseudo-counts in 100-bp windows. Absolute gene expression is represented in log scale. e, f, Gene expression in 199 human HCC and ICC of TBX3 (e) and PRDM5 (f). ****P < 0.0001, Student’s two-sided t-test. Data are mean ± s.d. g, Immunohistochemistry staining for K19 and HNF4α of HDTV-derived tumours after co- delivery of pCaMIN and a Prdm5-overexpression transposon (Prdm5 OE) (n = 4), pCaMIN plus Tbx3 shRNA (shTbx3) (n = 5), or pCaMIN plus shTbx3 and Prdm5 OE (n = 3) in p19Arf−/− mice. Scale bars, 100 μm. h, Schematic representation of the proposed model. DAMPs, damage-associated molecular patterns.

Comment in

References

    1. Farazi PA & DePinho RA Hepatocellular carcinoma pathogenesis: from genes to environment. Nat. Rev. Cancer 6, 674–687 (2006). - PubMed
    1. Rizvi S & Gores GJ Pathogenesis, diagnosis, and management of cholangiocarcinoma. Gastroenterology 145, 1215–1229 (2013). - PMC - PubMed
    1. Sirica AE & Gores GJ Desmoplastic stroma and cholangiocarcinoma: clinical implications and therapeutic targeting. Hepatology 59, 2397–2402 (2014). - PMC - PubMed
    1. Wu W et al. Pattern of distant extrahepatic metastases in primary liver cancer: a SEER based study. J. Cancer 8, 2312–2318 (2017). - PMC - PubMed
    1. Fan B et al. Cholangiocarcinomas can originate from hepatocytes in mice. J. Clin. Invest 122, 2911–2915 (2012). - PMC - PubMed

Publication types

MeSH terms