. 2018 Oct;562(7726):217-222.
doi: 10.1038/s41586-018-0461-z. Epub 2018 Sep 12.

Accurate classification of BRCA1 variants with saturation genome editing

Affiliations

Accurate classification of BRCA1 variants with saturation genome editing

Gregory M Findlay et al. Nature. 2018 Oct.

Abstract

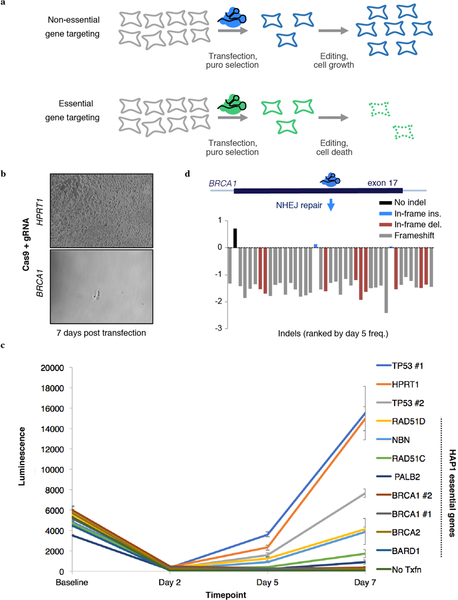
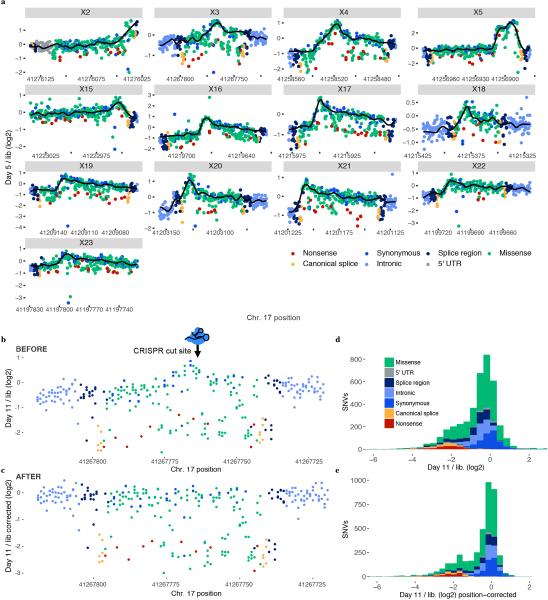
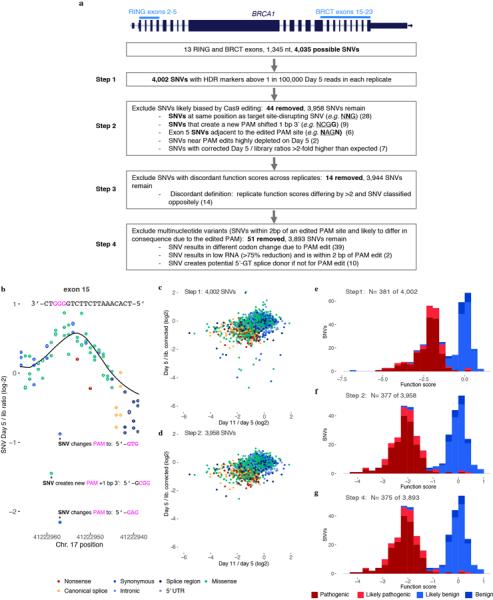
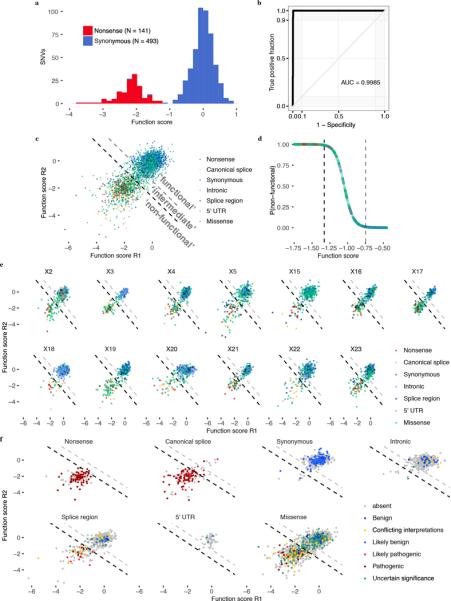
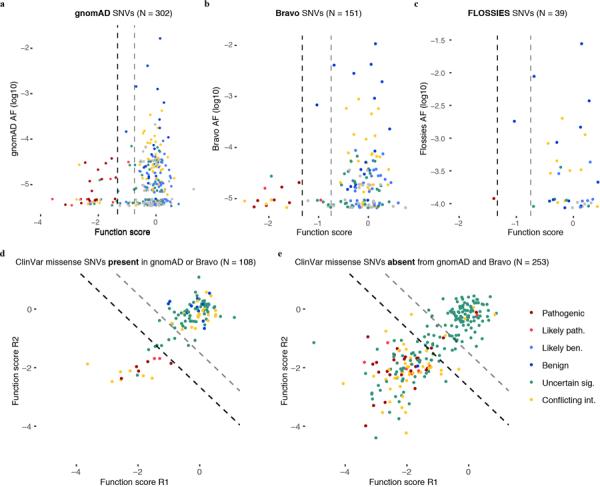
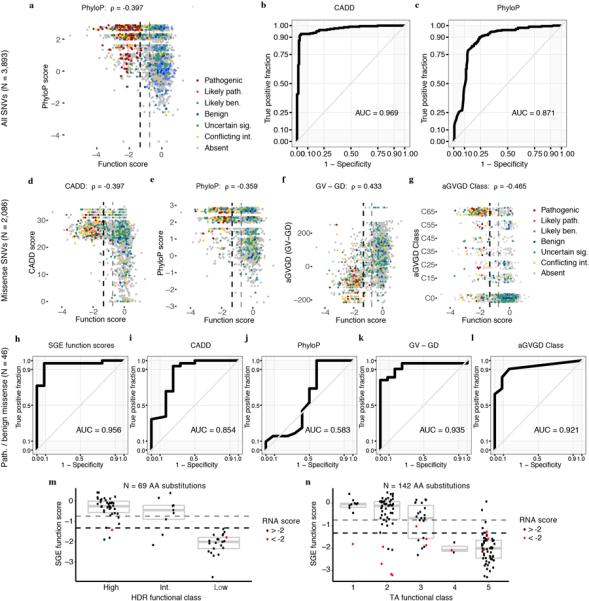
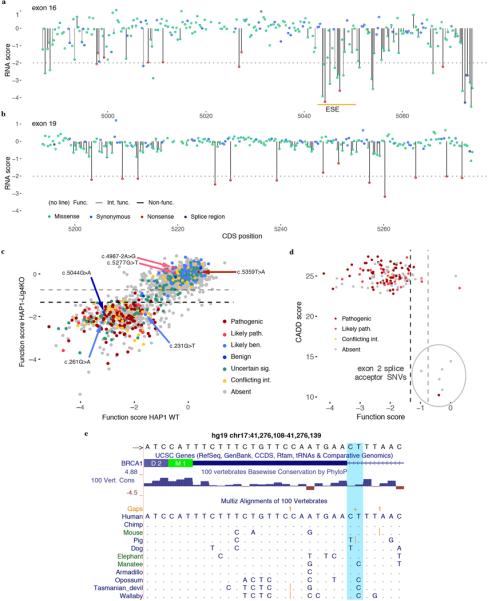
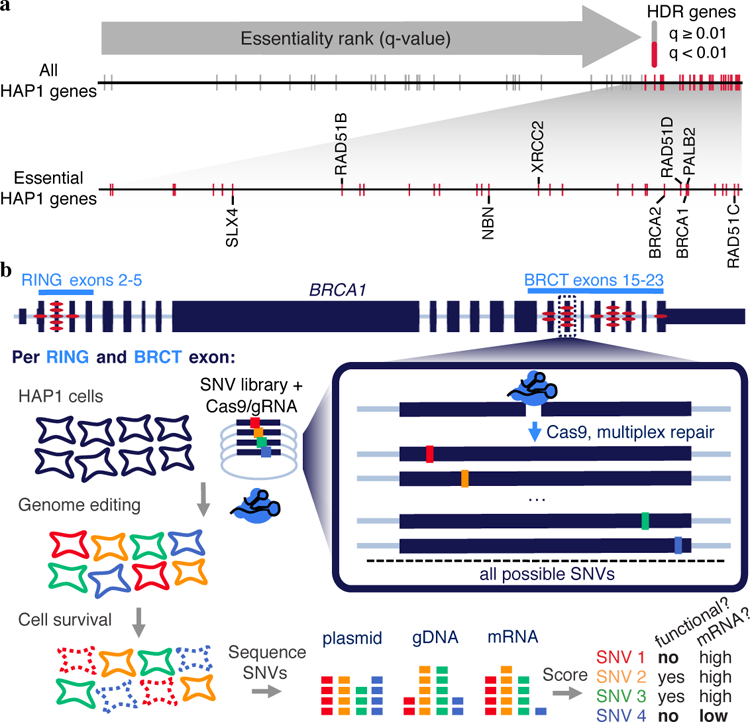
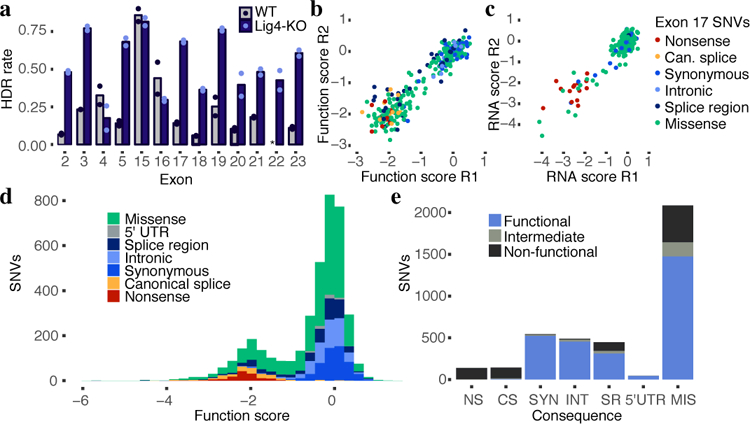
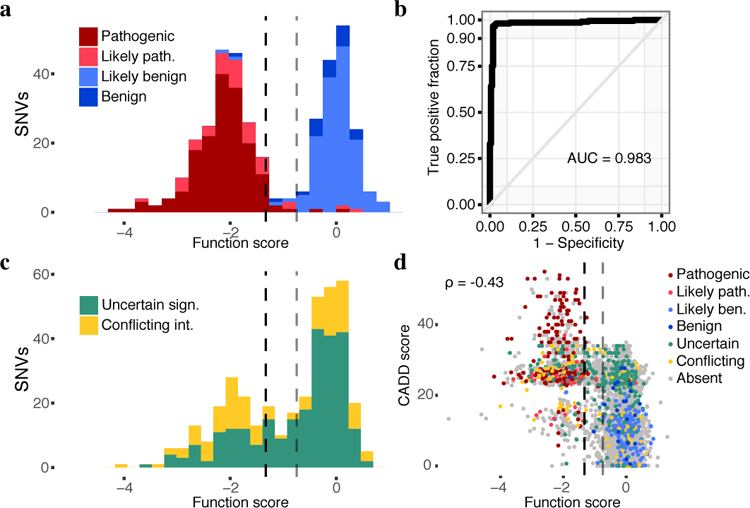
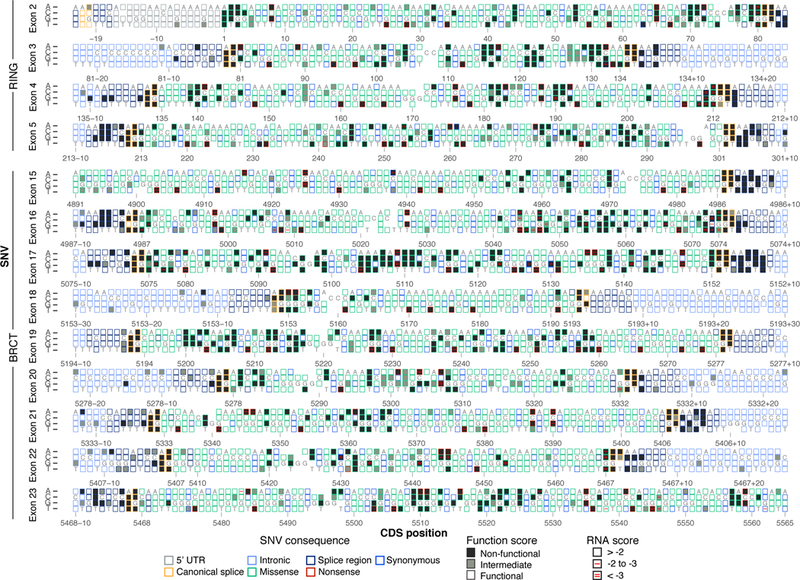
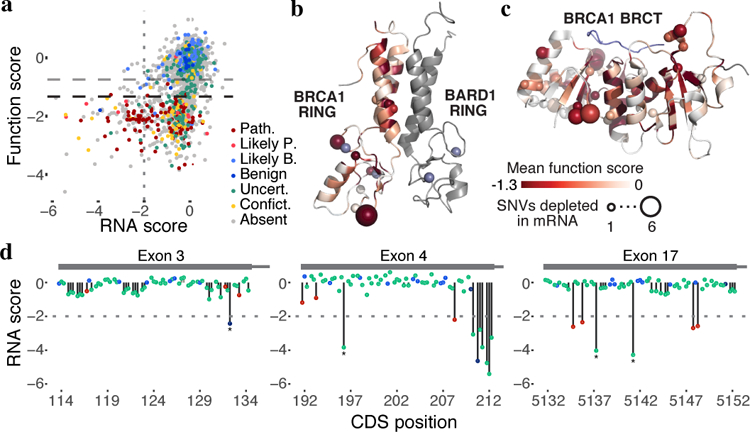
Variants of uncertain significance fundamentally limit the clinical utility of genetic information. The challenge they pose is epitomized by BRCA1, a tumour suppressor gene in which germline loss-of-function variants predispose women to breast and ovarian cancer. Although BRCA1 has been sequenced in millions of women, the risk associated with most newly observed variants cannot be definitively assigned. Here we use saturation genome editing to assay 96.5% of all possible single-nucleotide variants (SNVs) in 13 exons that encode functionally critical domains of BRCA1. Functional effects for nearly 4,000 SNVs are bimodally distributed and almost perfectly concordant with established assessments of pathogenicity. Over 400 non-functional missense SNVs are identified, as well as around 300 SNVs that disrupt expression. We predict that these results will be immediately useful for the clinical interpretation of BRCA1 variants, and that this approach can be extended to overcome the challenge of variants of uncertain significance in additional clinically actionable genes.


Figures

Extended Data Figure 1 |
Extended Data Figure 1 |. CRISPR targeting of HDR pathway genes to confirm essentiality in HAP1 cells.
a, Schematic; HAP1 cells are transfected with a plasmid expressing a gRNA and a Cas9–2A-puromycin cassette. Due to low transfection rates for HAP1 cells, puromycin selection reduces viable cells in all transfections. Over time, however, CRISPR targeting of non-essential genes leads to increased cell growth compared to CRISPR targeting of essential genes. b, HAP1 cell populations were transfected with a Cas9/gRNA plasmid either targeting the non-essential gene HPRT1 (control) or exon 17 of BRCA1 on day 0. Successfully transfected cells were selected with puromycin (days 1–4) and cultured until imaging on day 7, at which point cells were imaged. Images are representative of two transfection replicates. c, Cell viability of HAP1 cells transfected with Cas9/gRNA constructs targeting different HDR genes and controls (HPRT1, TP53) was measured using the CellTiterGlow assay. Luminescence is proportional to the number of living cells in each well when the assay is performed. Triplicate wells for each gRNA at each time point were processed, quantified on a plate reader and averaged. Error bars show the standard error of the mean. gRNA sequences are included in Supplementary Table 3. d, The targeted BRCA1 exon 17 locus was deeply sequenced from a population of transfected cells sampled on day 5 and day 11. The fold-change from day 5 to day 11 for each editing outcome observed at a frequency over 0.001 in day 5 sequencing reads is plotted.
Extended Data Figure 2 |
Extended Data Figure 2 |. Analysis of Cas9-induced indels observed in BRCA1 SGE experiments.
Variants observed in gDNA sequencing were included in this analysis if i) they aligned to the reference with either a single insertion or deletion within 15 bp of the predicted Cas9 cleavage site and ii) were observed at a frequency greater than 1 in 10,000 reads in both replicates. a, Histograms show the number of unique indels observed of each size, with negative sizes corresponding to deletions. More unique indels were observed in WT HAP1 cells compared to HAP1-Lig4KO cells for exons compared (WT data for exon 22 was excluded). b, Day 11 over day 5 indel frequencies were normalized to the median synonymous SNV in each replicate and then averaged across replicates to measure selection on each indel. The distribution of selective effects is shown for each experiment as a histogram, in which indels are colored by whether their size was divisible by 3 (i.e. ‘in-frame’ vs. ‘frameshifting’). Whereas frameshifting variants were consistently depleted, some exons were tolerant to in-frame indels.
Extended Data Figure 3 |
Extended Data Figure 3 |. HAP1 cell line optimizations for saturation genome editing to assay essential genes.
a, A gRNA targeting Cas9 to the coding sequence of LIG4, a gene integral to the non-homologous end-joining pathway, was cloned into a vector co-expressing Cas9–2A-GFP. WT HAP1 cells were transfected, and single GFP-expressing cells were sorted into wells of a 96-well plate. Eight monoclonal lines were grown out over a period of three weeks and screened using Sanger sequencing for frameshifting indels in LIG4. The Sanger trace shows the frameshifting deletion present in the clonal line chosen for subsequent experiments, referred to as ‘HAP1-Lig4KO’. b, To purify HAP1 cells for haploid cells, live cells were stained for DNA content with Hoechst 34580 and sorted using a gate to select cells with the lowest DNA content, corresponding to 1N cells in G1. c, The fraction of all possible SNVs scored is shown for each exon. SNVs were excluded mainly due to proximity to the HDR marker and/or poor sampling (Methods). d,e, Measurements across replicates are plotted for exon 17 SNVs assayed in HAP1-Lig4KO cells to show correlations of day 5 frequencies (d) and day 11 over library ratios (e). f–h, Plots comparing SNV function scores across replicate experiments for exon 17 saturation genome editing experiments performed in unsorted WT HAP1 cells (f), HAP1-Lig4KO cells (g), and WT HAP1 cells sorted on 1N ploidy (h). i, Function scores (averaged across replicates) are plotted to compare results for exon 17 experiments performed in WT 1N-sorted HAP1 cells and HAP1-Lig4KO cells. The number of SNVs plotted and the Spearman correlation is displayed for each plot (d-i).
Extended Data Figure 4 |
Extended Data Figure 4 |. Correlations for SNV measurements within single experiments, across transfection replicates, and to CADD scores for all SGE experiments.
Heatmaps indicate Spearman correlation coefficients for SNV measurements from experiments in WT HAP1 cells (a) and in HAP1-Lig4KO cells (b). Gray boxes indicate absent RNA data from WT HAP1 cells. The four leftmost columns show how SNV frequencies correlate between samples from within a single replicate experiment. The unusually high correlations between exon 22 SNV frequencies in the plasmid library and in day 5 gDNA samples from WT HAP1 cells suggests plasmid contamination in gDNA. Indeed, primer homology to a repetitive element in the exon 22 library was identified. Consequently, the WT HAP1 exon 22 data was removed from analysis and a different primer specific to gDNA was used to prepare exon 22 sequencing amplicons from HAP1-Lig4KO cells. The low HAP1-Lig4KO correlations between exon 18 SNV frequencies in day 5 gDNA and RNA and between RNA replicates suggests RNA sample bottlenecking consequential to low RNA yields. Therefore, exon 18 RNA was also excluded from analysis. Consistent with the higher rates of HDR-mediated genome editing (Fig. 2a), replicate correlations (middle columns) were generally higher in HAP1-Lig4KO cells than WT HAP1 cells. CADD scores predict the deleteriousness of each SNV, and are therefore negatively correlated with function scores (rightmost columns).
Extended Data Figure 5 |
Extended Data Figure 5 |. Models of SNV editing rates across BRCA1 exons to account for positional biases.
Gene conversion tracts arising during HDR in human cells are short such that library SNVs are introduced to the genome more frequently near the CRISPR target site. We modelled this positional effect in our data for N = 4,002 SNVs (pre-filtering) using a LOESS regression fit on day 5 over library SNV ratios. a, Plots shown here are of the average of n=2 replicates per exon, with the black line indicating the LOESS regression. By day 5, selective effects on gene function are evidenced by nonsense SNVs (red) appearing at lower frequencies compared to neighbouring SNVs. Therefore, to best approximate the SNV editing rate as a function of position alone (i.e. the ‘baseline’), the regression excluded SNVs that were selected against between day 11 and day 5 (see Methods). b,c, Day 11 over library SNV ratios were adjusted by the positional fit for each experiment in calculating function scores. This adjustment is illustrated here for an exon 3 replicate by plotting the day 11 over library ratio as a function of position before (b) and after (c) adjustment for (N = 298 SNVs). The elevated day 11 over library ratios for SNVs near the CRISPR cleavage site (indicated with an arrow) are corrected to achieve a more uniform baseline across the mutagenized region. d,e, The distributions of SNV day 11 over library ratios before and after accounting for positional effects are shown, colored by mutational consequence (N = 4,002 SNVs, averaged across n=2 replicates).
Extended Data Figure 6 |
Extended Data Figure 6 |. SNV filtering to prevent erroneous functional classification.
a, The flow chart describes filters used to produce the final SNV data set and shows how many SNVs were removed at each step. b, Raw day 5 over library SNV ratios are shown for a portion of exon 15 to illustrate how re-editing biases necessitate filtering. The three depleted SNVs marked with asterisks create alternative PAM sequences that likely allow the Cas9:gRNA complex to re-cut the locus and cause their removal. For other SNVs, the fixed PAM edit (a GGG to GCG synonymous change) minimalizes re-editing. The location of the target PAM is underlined and each indicated SNV is bolded in the annotations. The LOESS regression curve in shown in black. c,d, Plots show the relationship between day 5 over library and day 11 over day 5 ratios before (c) and after (d) filtering steps 1 and 2. Filtering removes outliers because editing biases primarily affect the day 5 over library ratio. e–g, Histograms show the distributions of function scores for SNVs deemed ‘pathogenic’ or ‘benign’ in ClinVar at different stages of filtering. Scores in e are derived prior to normalization across exons.
Extended Data Figure 7 |
Extended Data Figure 7 |. Mixture modeling of scores to classify SNVs by functional effect.
a, Distributions of ‘non-functional’ and ‘functional’ SNVs plotted here were defined respectively as all nonsense SNVs and all synonymous SNVs with RNA scores within 1 SD of the median synonymous SNV. b, An ROC curve was generated using SGE function scores to distinguish the 634 ‘functional’ and ‘non-functional’ SNVs defined in a. c, A two-component Gaussian mixture model was used to produce point estimates of the probability that each SNV was ‘non-functional’, P(nf), given its average function score across replicates. These P-values are plotted in d against function scores for a subset of the data. Thresholds were set such that P(nf) < 0.01 corresponds to ‘functional’, and P(nf) > 0.99 corresponds to ‘non-functional’, and 0.01 < P(nf) < 0.99 corresponds ‘intermediate’ classification. Functional classification thresholds are drawn as dashed lines; black denotes the non-functional threshold and gray the intermediate threshold. e,f, SNV function scores across replicates are plotted for each exon with SNVs colored by mutational consequence (e), and for each type of mutational consequence with SNVs colored by ClinVar status (f). Using the optimal function score cutoff for all SNVs tested (Fig. 3b), sensitivities and specificities for distinguishing ‘Pathogenic’/’Likely pathogenic’ from ‘Benign’/’Likely benign’ ClinVar annotations for each type of mutation are as follows: 92.7% and 92.9% for missense SNVs (N = 55), 100% and 100% for splice region SNVs (N = 23), and 95.2% sensitivity for canonical splice site SNVs (N = 83; specificity not calculable).
Extended Data Figure 8 |
Extended Data Figure 8 |. BRCA1 SNVs observed more frequently in large-scale population sequencing are more likely to score as functional.
a–c, SNV function scores are plotted against gnomAD (a), Bravo (b), and FLOSSIES (c) allele frequencies. a, Among the 302 SNVs assayed also present in gnomAD, higher allele frequencies associate with higher function scores (Wilcoxon Signed Rank Test, P = 3.7 × 10⁻¹²). . b, Bravo is a collection of whole genome sequences ascertained from 62,784 individuals through the NHLBI TOPMed program. Similarly to SNVs present in gnomAD, higher allele frequencies in Bravo correlate with higher function scores. c, FLOSSIES is a database of variants seen in targeted sequencing of breast cancer genes sampled from approximately 10,000 cancer-free women at least 70 years old. Only 1 of 39 assayed SNVs present in FLOSSIES scored as non-functional. c,d, Missense SNVs in ClinVar are separated by whether they have (c) or have not (d) been seen in either gnomAD or Bravo and function scores across replicates are plotted, with dashed lines demarcating functional classes. A higher proportion of ClinVar missense SNVs absent from gnomAD and Bravo score as non-functional (50.6% vs. 15.7%, Fisher’s exact P = 1.80 × 10⁻¹⁷).
Extended Data Figure 9 |
Extended Data Figure 9 |. SGE function scores correlate with computational metrics and perform favorably at predicting ClinVar annotations.
a, SNV function scores are plotted against mammalian phyloP scores, with colors indicative of ClinVar status (Spearman’s correlation shown). b,c, ROC curves show the performance of CADD scores and phyloP scores for discriminating ClinVar ‘pathogenic’ and ‘benign’ SNVs (including ‘likely’), as described in Fig. 3b for SGE data. d-g Plots as in a, but for missense SNVs only, showing correlations between SGE function scores and CADD scores, phyloP scores, Grantham differences (Grantham amino acid variation minus Grantham amino acid deviation; GV - GD), and align-GVGD classifications. Missense SNV function scores also correlate with SIFT scores (⍴ = 0.363) and PolyPhen-2 scores (⍴ = −0.277). (P < 1 × 10−37 for all correlations.) h–l, ROC curves assess the performance of SGE function scores and each indicated metric at distinguishing firmly ‘pathogenic’ and ‘benign’ missense SNVs. (i.e. not including ‘likely’). m,n, SGE scores for missense variants are plotted against results from homology-directed repair assays, (m) and results from transcriptional activation assays (n). In cases where multiple SNVs assayed lead to same amino acid substitution, function scores were averaged and colored red if either SNV had an RNA score less than −2. Box plots depict the sample median (line) and the interquartile range (box).
Extended Data Figure 10 |
Extended Data Figure 10 |. Evidence supporting SNV scores in discordance with ClinVar classifications.
a,b, Complete maps of RNA scores for exons 16 (a) and exon 19 (b) reveal highly variable sensitivity to RNA depletion. The location of the strongest predicted exonic splice enhancer in exon 16 is indicated by the orange line. c, Function scores (means from two replicates) are plotted to compare results from preliminary experiments in WT HAP1 to those in HAP1-Lig4KO. Data is shown only for experiments with Spearman’s correlations between replicates greater than 0.50 in WT HAP1 cells (2,096 SNV; exons 3, 4, 5, 16, 17, 19, 21). Discordantly classified SNVs are indicated with arrows. c.−19–2A>G was the only firmly discordant SNV whose function score could not be corroborated in WT HAP1, consequent to low reproducibility of exon 2 WT function scores. Indeed, c.−19–2A>G scored highly variably between WT replicates. d, The sequence-function map of exon 21 is shown with the function scores for the two ‘pathogenic’ SNVs observed in linkage indicated. Dashed lines demarcate functional classifications. c, Function scores are plotted against CADD scores for all canonical splice SNVs assayed, colored by ClinVar status. The six possible exon 2 splice acceptor SNVs (circled) have the lowest CADD scores among all canonical splice SNVs assayed, and none score as ‘non-functional’. e, A USCS Genome Browser shot shows the PhyloP conservation track and selected mammalian sequence alignments for the exon 2 acceptor region, with the canonical acceptor site nucleotides highlighted in light blue. (hg19 chr17:41,276,108–41,276,139). Multiple mammalian species are identified that have a G at position c.−19–2 of the human transcript (corresponding to a C in the plus-strand orientation shown).
Figure 1 |
Figure 1 |. BRCA1 and other HDR pathway genes are essential in HAP1 cells.
a, The q-value rankings of HDR pathway genes (n = 66) among 14,306 genes scored in a HAP1 gene trap screen for essentiality are indicated with tick marks. Essential HDR genes are colored red and those implicated in cancer predisposition are labelled in the enlargement below. Of the 66 HDR pathway genes scored, 34 including BRCA1 were ‘essential’, a 3.4-fold enrichment compared to non-HDR genes (Fisher’s exact P = 6.1 × 10⁻¹²). b, Saturation genome editing experiments were designed to introduce all possible SNVs across thirteen BRCA1 exons encoding the protein’s RING (exons 2–5, NCBI transcript ID NM_007294.3) and BRCT domains (exons 15–23). For each exon, a Cas9/gRNA construct was transfected with a library of plasmids containing all SNVs across ~100 bp of genomic sequence (the ‘SNV library’). SNV library plasmids contain homology arms, as well as fixed synonymous variants within the CRISPR target site to prevent re-cutting. Upon transfection, successfully edited cells harbor a single BRCA1 SNV from the library. Cells are sampled 5 and 11 days after transfection and targeted gDNA and RNA sequencing is performed to quantify SNV abundances. SNVs compromising BRCA1 function are selected against, manifesting in reduced gDNA representation, and SNVs impacting mRNA production are depleted in RNA samples relative to gDNA. The exonic locations of all 21 BRCA1 missense variants in ClinVar deemed pathogenic by an expert panel are indicated by red ovals.
Figure 2 |
Figure 2 |. Saturation genome editing enables functional classification of 3,893 BRCA1 SNVs.
a, HDR editing rates were calculated for each exon as the fraction of day 5 reads containing the SNV library’s fixed synonymous variant (i.e. an ‘HDR marker’ edit). The average of two WT HAP1 replicates and two HAP1-Lig4KO replicates is plotted, with dots indicating rates for each replicate. (Asterisk denotes missing exon 22 data.) b,c, Measurements for exon 17 SNVs assayed in HAP1-Lig4KO cells are plotted to show correlations of function scores (b, n = 291, Spearman’s ⍴ = 0.88) and RNA expression scores (c, n = 231, Spearman’s ⍴ = 0.61). Reproducibility is detailed further in Extended Data Fig. 4. d, A histogram of 3,893 SNV function scores (averaged from n=2 replicates and normalized across exons) shows how each category of mutation compares to the overall distribution. e, The number of SNVs within each category is plotted and colored by functional classification. (NS = nonsense, CS = canonical splice, SYN = synonymous, INT = intronic, SR = splice region, 5’UTR = 5’ untranslated region, MIS = missense.)
Figure 3 |
Figure 3 |. SGE function scores are highly accurate at predicting clinical interpretations of BRCA1 SNVs.
a, The distribution of SNV function scores colored by ClinVar interpretation. Scores are shown for n = 375 SNVs with at least a ‘1-star’ review status in ClinVar and either a ‘pathogenic’ or ‘benign’ interpretation (including ‘likely’). The dashed lines indicate the functional classification thresholds determined by mixture modeling. Gray divides ‘functional’ and ‘intermediate’ (function score = −0.748), and black divides ‘intermediate’ and ‘non-functional’ (function score = −1.328). b, An ROC curve reveals optimal sensitivity and specificity for classifying the same 375 SNVs in a at SGE function score cutoffs from −1.03 to −1.22. c, The distribution of scores plotted as in a for the 378 SNVs annotated as variants of uncertain significance or with conflicting interpretations. 91.3% of such variants are classified as ‘functional’ or ‘non-functional’ by SGE. . d, CADD scores, which predict deleteriousness, inversely correlate with function scores (Spearman’s, N = 3,893 SNVs). SNVs are colored by ClinVar annotation.
Figure 4 |
Figure 4 |. Sequence-function maps for 13 BRCA1 exons.
The 3,893 SNVs scored with SGE are each represented by a box corresponding to coding sequence position (NM_007294.3) and nucleotide identity. Boxes are filled corresponding to functional class, and outlined corresponding to the SNV’s mutational consequence. Red lines within boxes mark SNVs depleted in RNA; one line indicates an RNA score between −2 and −3 (log2 scale) and two lines indicate a score below −3. RNA measurements were determined only for exonic SNVs, excluding exon 18. Reference nucleotides are indicated; blank boxes indicate missing data.
Figure 5 |
Figure 5 |. Measuring SNV mRNA abundance and function in parallel delineates mechanisms of variant effect.
a, Function scores are plotted against RNA scores for all exonic synonymous and missense SNVs scored (N = 2,646). Horizontal dashed lines indicate functional thresholds, and the vertical dotted line marks an RNA score of −2. b,c, Function scores for all SNVs were mapped onto the structures of the RING (b, pdb 1JM7) and BRCT (c, pdb 1T29) domains in shades of red by averaging missense SNV scores at each amino acid position. The number of SNVs that cause >75% reduction in mRNA levels at each amino acid position is represented by the size of the sphere at the alpha-carbon at each residue. Grey denotes residues not assayed and the BACH1 peptide bound to the BRCT structure is colored blue. d, SNV RNA scores are plotted by transcript position, with lines to the x-axis denoting SNV functional classifications (no line = functional, gray line = intermediate, black line = non-functional). The horizontal dashed line in each plot marks an RNA score of −2, corresponding to 75% reduction in mRNA. Examples of non-functional SNVs with low RNA scores that create new 5’-GU splice donor motifs are indicated with asterisks.

Comment in

References

    1. Rehm HL et al. ClinGen — The Clinical Genome Resource. N. Engl. J. Med 372, 2235–2242 (2015). - PMC - PubMed
    1. Kuchenbaecker KB et al. Risks of Breast, Ovarian, and Contralateral Breast Cancer for BRCA1 and BRCA2 Mutation Carriers. JAMA 317, 2402–2416 (2017). - PubMed
    1. Hall JM et al. Linkage of early-onset familial breast cancer to chromosome 17q21. Science 250, 1684–1689 (1990). - PubMed
    1. Olopade OI & Artioli G Efficacy of risk-reducing salpingo-oophorectomy in women with BRCA-1 and BRCA-2 mutations. Breast J 10 Suppl 1, S5–9 (2004). - PubMed
    1. Rebbeck TR et al. Bilateral prophylactic mastectomy reduces breast cancer risk in BRCA1 and BRCA2 mutation carriers: the PROSE Study Group. J. Clin. Oncol 22, 1055–1062 (2004). - PubMed

Publication types