. 2018 Sep 12;26(1):19-29.
doi: 10.1007/s40199-018-0210-8. Online ahead of print.

Effect of Cinnamic acid and FOLFOX in diminishing side population and downregulating cancer stem cell markers in colon cancer cell line HT-29

Affiliations

Effect of Cinnamic acid and FOLFOX in diminishing side population and downregulating cancer stem cell markers in colon cancer cell line HT-29

Sara Soltanian et al. Daru. .

Abstract

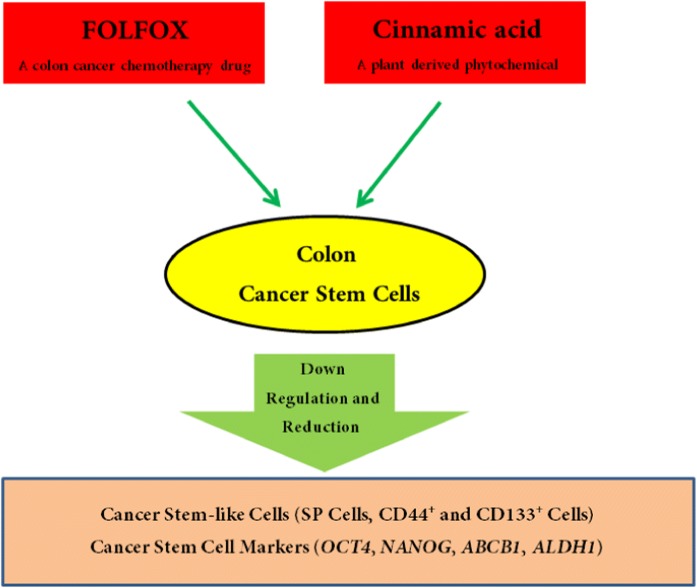
Purpose: There is a lot of evidence suggesting that a small subset of cancer cells resistant to conventional chemotherapy and radiotherapy and known as cancer stem cells (CSCs) is responsible for promoting metastasis and cancer relapse. Therefore, targeting and eliminating the CSCs could lead to higher survival rates and a better quality of life. In comparison with conventional chemical drugs that may not be effective against CSCs, phytochemicals are strong anti-CSCs agents. The current study examines the effect of 5-fluorouracil plus oxaliplatin (FOLFOX) as a common chemotherapy drug on colorectal cancer as well as the influence of Cinnamic acid (CINN) as a plant-derived phytochemical on colon cancer stem-like cells in HT-29 adenocarcinoma cell line.

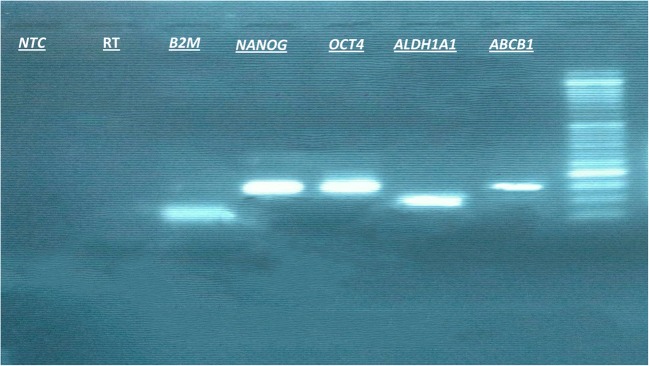
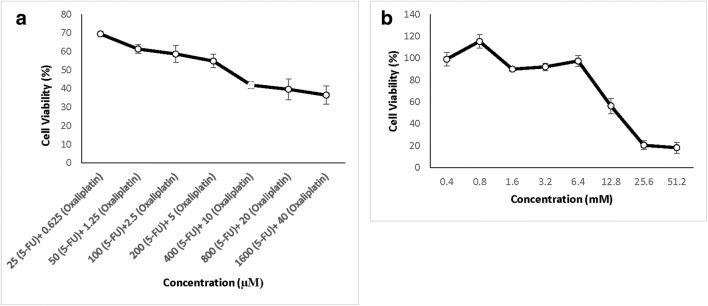
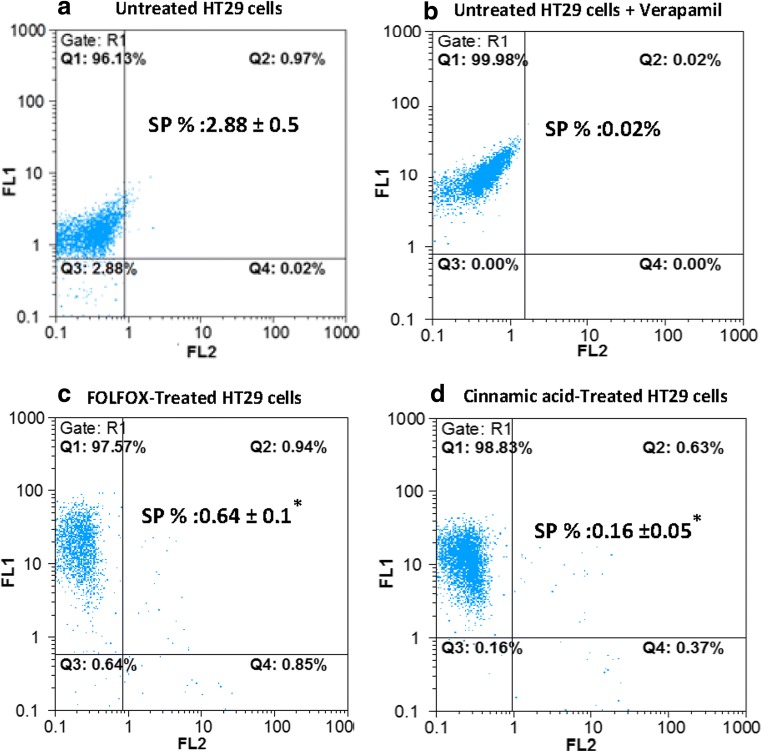
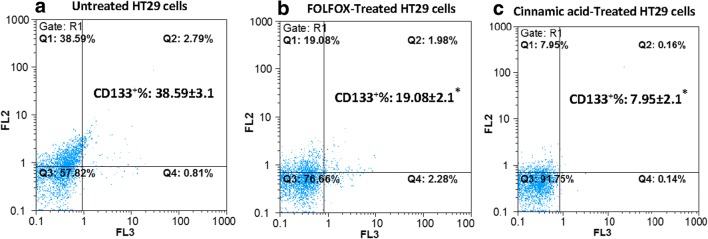
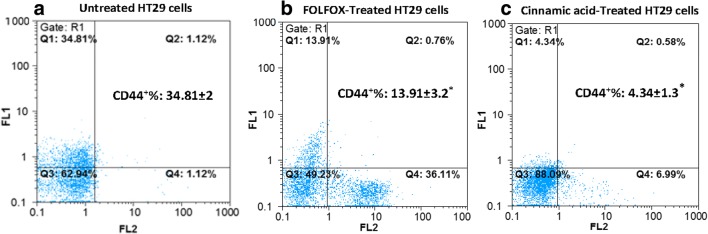
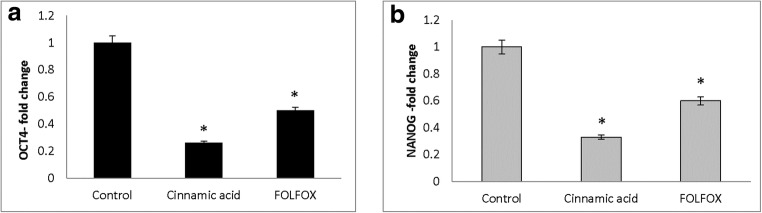
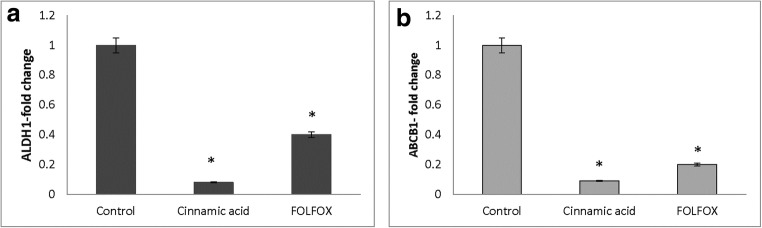
Methods: The anti-proliferative effect of FOLFOX and CINN was determined using MTT [3-(4,5-dimethylthiazol-2-yl)-2,5-diphenyltetrazolium bromide] assay. Flow cytometry analysis was used for the identification of side population (SP), CD44, and CD133 positive cells. The expression of OCT4, NANOG, ABCB1, and ALDH1A was assessed by RT-PCR.

Results: The FOLFOX and CINN decreased cell viability in certain drug concentrations: IC50 = 5,40 μM oxaliplatin +220 μM 5-fluorouracil, and 13,50 mM for CINN. The CSC-associated markers (OCT4, NANOG, ABCB1, and ALDH1A) and the proportion of cancer stem-like cells (SP cells, CD44, and CD133 positive cells) were downregulated following the treatment of HT-29 adenocarcinoma cell line with IC50 concentrations of FOLFOX and CINN.

Conclusion: Our data suggests that CINN, a naturally occurring component, could be more effective than FOLFOX treatment in reducing the cancer stem-like cells and expression of CSC markers from HT-29 colon cancer cells. Graphical abstract ᅟ.

Keywords: Cancer stem cell markers; Cinnamic acid; Colon cancer stem cells; FOLFOX; Side population.


Conflict of interest statement

Conflict of interest

The authors declare that they have no conflict of interest.

Ethical approval

This article does not contain any studies with human participants or animals performed by any of the authors.

Figures

Graphical abstract
Graphical abstract
Fig. 1
Fig. 1
The accuracy of RT- PCR was further validated by gel electrophoresis. RT- PCR products were run in 2% agarose gel and bands were seen at the desired size (ABCB1: 151 bp; ALDH1A1: 98 bp; OCT4: 145 bp; NANOG: 149 bp; and β2M: 69 bp). The negative control lanes are indicated by RT minus (no reverse transcriptase for the reverse transcription reaction) and NTC (no-template control for the PCR reaction). A molecular weight marker (50 bp ladder) is used
Fig. 2
Fig. 2
Anti-proliferative activity of FOLFOX (a) and Cinnamic acid (b) on HT-29 cell line. HT-29 cells were treated with increasing concentrations of FOLFOX and Cinnamic acid for 48 h. All points represent results of cell viability percentage from three independent experiments performed in triplicate. Data is expressed as mean ± SD
Fig. 3
Fig. 3
FOLFOX and Cinnamic acid diminished SP cells in HT-29 cells. Untreated HT-29 cells in absence (a) and presence of verapamil (b), FOLFOX (220 μM 5-FU/ 5.4 μM Oxaliplatin) treated (c) and Cinnamic acid (13.5 Mm) treated HT-29 cells (d) were stained with Rh123 and propidium iodide dyes and analyzed using flow cytometry. The cell population that excludes Pi and Rh123 are representative of SP cells and were counted in the left low quadrants. The data represents the mean (± standard deviation, SD) of three independent experiments and the difference in fraction of SP cells between control and treated cells was significant according to student’s t-test (*P < 0.05)
Fig. 4
Fig. 4
FOLFOX and Cinnamic acid decreased the proportion of CD133+ cells in HT-29 cell line. Untreated HT-29 (a), HT-29 cells which were incubated with FOLFOX (220 μM 5-FU/ 5.4 μM Oxaliplatin) (b), and in medium containing 13.5 Mm Cinnamic acid (c) for 48 h were analyzed after incubation with PE anti-human CD133 Antibody+7-AAD with flow cytometry. The results obtained are from the mean ± SD of three independent experiments. Each CD133/7-AAD dot plot represents one of the three independent experiments. *P < 0.05 compared to the control as tested by the student’s t-test
Fig. 5
Fig. 5
FOLFOX and Cinnamic acid decreased the percentage of CD44+ cells in HT-29 cell line. Untreated HT-29 (a), HT-29 cells which were incubated with FOLFOX (220 μM 5-FU/ 5.4 μM Oxaliplatin) (b), and in medium containing 13.5 Mm Cinnamic acid (c) for 48 h were analyzed after incubation with FITC anti-human CD44 Antibody+ Pi with flow cytometry. The results are obtained from the mean ± SD of three independent experiments. Each CD44/PI dot plot represents one of the three independent experiments. *P < 0.05 compared to the control as tested by the Student’s t-test
Fig. 6
Fig. 6
Downregulation of OCT4 (a) and NANOG (b) in HT-29 by FOLFOX and Cinnamic acid. HT-29 cells were treated with Cinnamic acid (13.5 Mm) and FOLFOX (220 μM 5-FU/ 5.4 μM Oxaliplatin) for 48 h. The Y-axis represents the fold-change in transcript levels compared with untreated HT-29 cells (designated as 1.0). The graph represents the mean data ± SD of at least three independent experiments. Asterisk indicates significant (p < 0.05) difference in mRNA expression in comparison with untreated cells
Fig. 7
Fig. 7
Downregulation of ALDH1A1 (a) and ABCB1 (b) in HT-29 by FOLFOX and Cinnamic acid. HT-29 cells were treated with Cinnamic acid (13.5 Mm) and FOLFOX (220 μM 5-FU/ 5.4 μM Oxaliplatin) for 48 h. Y-axis represents the fold-change in transcript levels compared with untreated HT-29 cells (designated as 1.0). The graph represents the mean data ± SD of at least three independent experiments. Asterisk indicates significant (p < 0.05) difference in mRNA expression in comparison with untreated cells

References

    1. Thomas M, Coyle K, Sultan M, Vaghar-Kashani A, Marcato P. Chemoresistance in cancer stem cells and strategies to overcome resistance. Chemotherapy. 2014;3(125):2.
    1. Blagosklonny MV. Why therapeutic response may not prolong the life of a cancer patient: selection for oncogenic resistance. Cell Cycle. 2005;4(12):1693–1698. - PubMed
    1. Jiang F, Qiu Q, Khanna A, Todd NW, Deepak J, Xing L, et al. Aldehyde dehydrogenase 1 is a tumor stem cell-associated marker in lung cancer. Mol Cancer Res. 2009;7(3):330–338. - PMC - PubMed
    1. Hipkens J, Struck R, Gurtoo H. Role of aldehyde dehydrogenase in the metabolism-dependent biological activity of cyclophosphamide. Cancer Res. 1981;41(9 Part 1):3571–3583. - PubMed
    1. Bao S, Wu Q, McLendon RE, Hao Y, Shi Q, Hjelmeland AB, et al. Glioma stem cells promote radioresistance by preferential activation of the DNA damage response. Nature. 2006;444(7120):756–760. - PubMed

LinkOut - more resources