. 2019 Jan;15(1):131-150.
doi: 10.1080/15548627.2018.1511263. Epub 2018 Sep 13.

Thyroid hormone (T3) stimulates brown adipose tissue activation via mitochondrial biogenesis and MTOR-mediated mitophagy

Affiliations

Thyroid hormone (T3) stimulates brown adipose tissue activation via mitochondrial biogenesis and MTOR-mediated mitophagy

Winifred W Yau et al. Autophagy. 2019 Jan.

Abstract

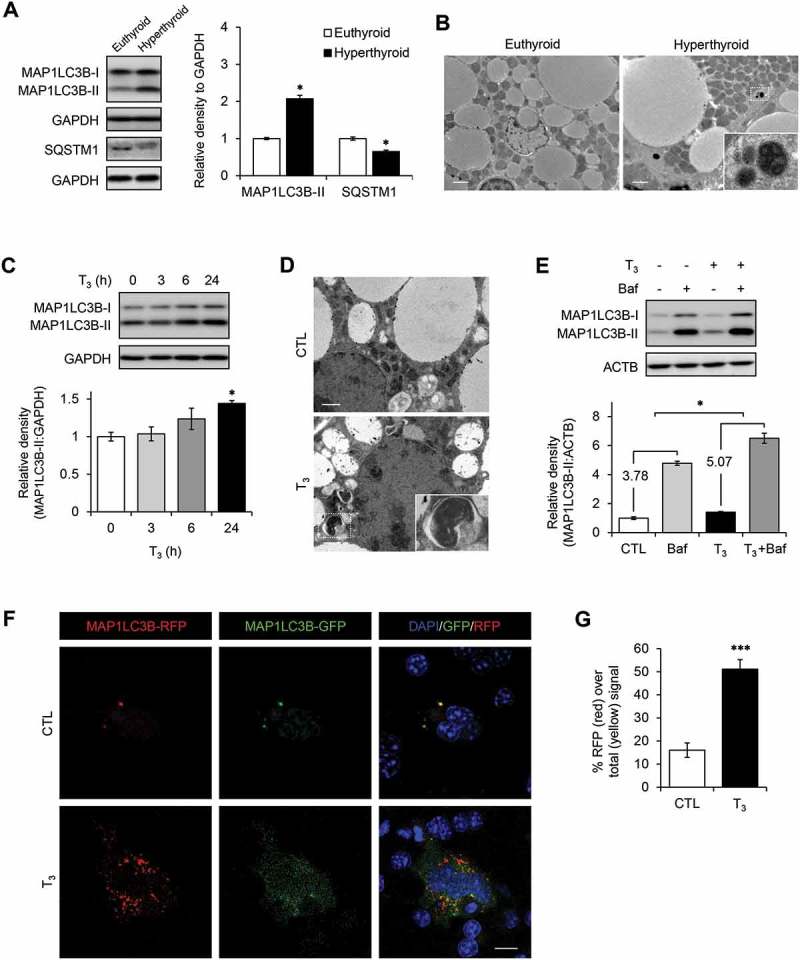
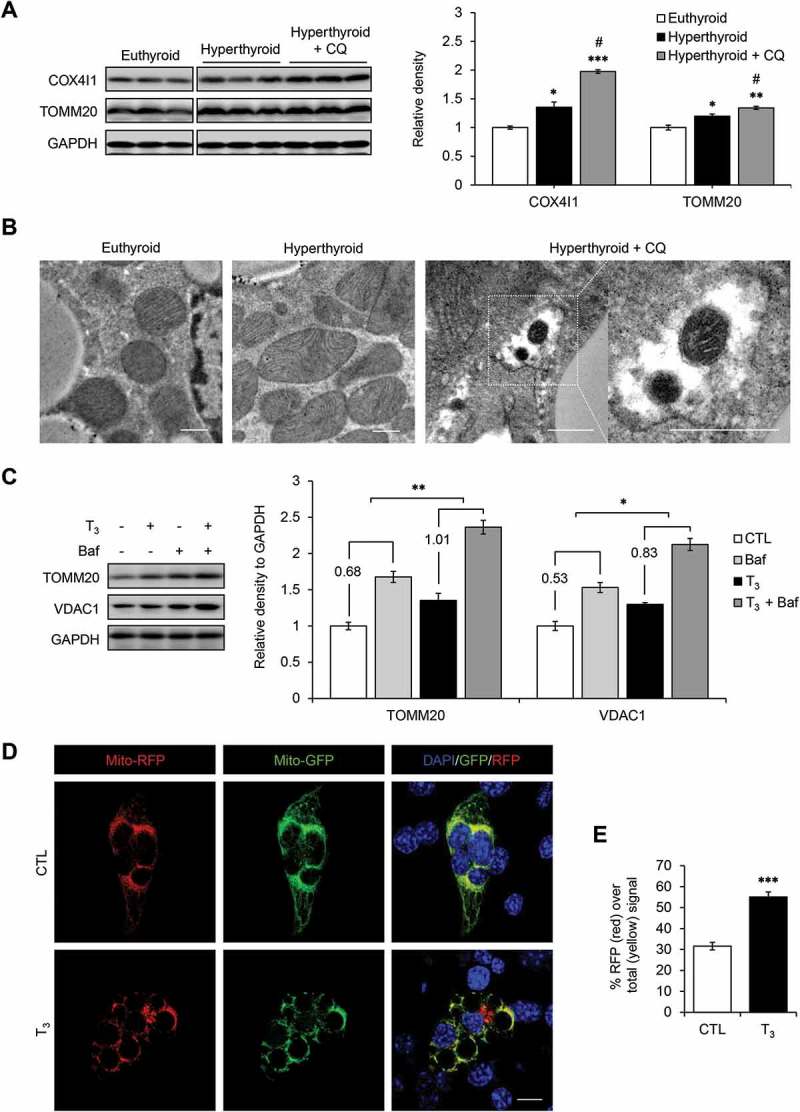
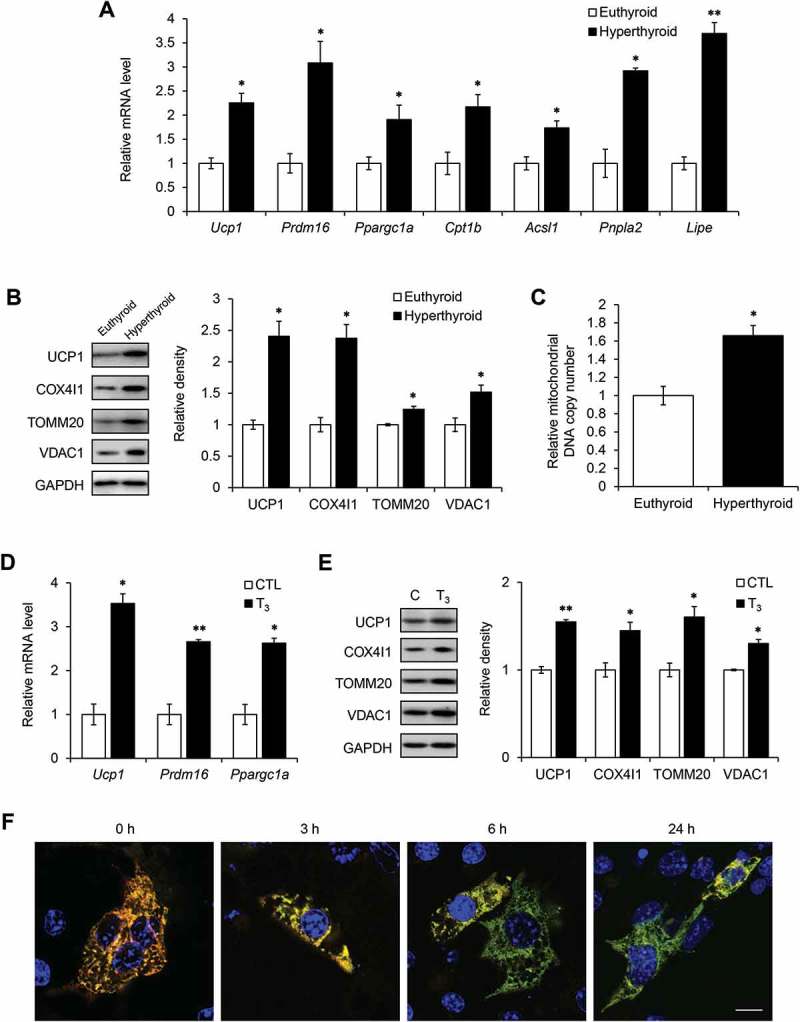
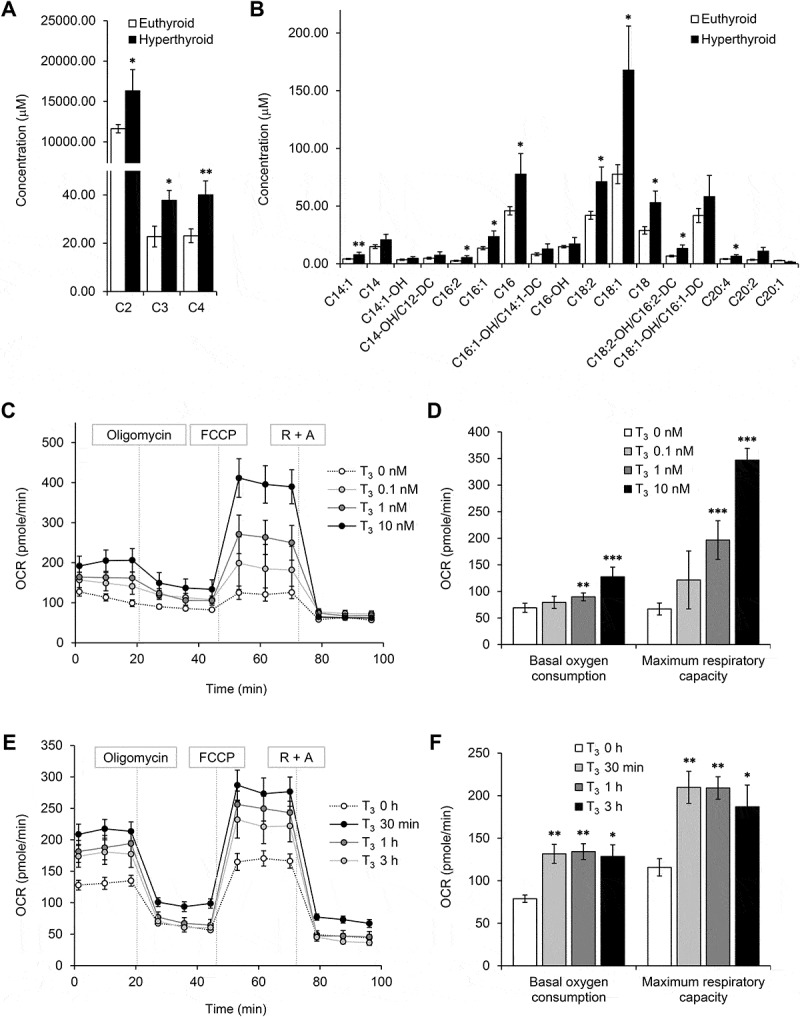
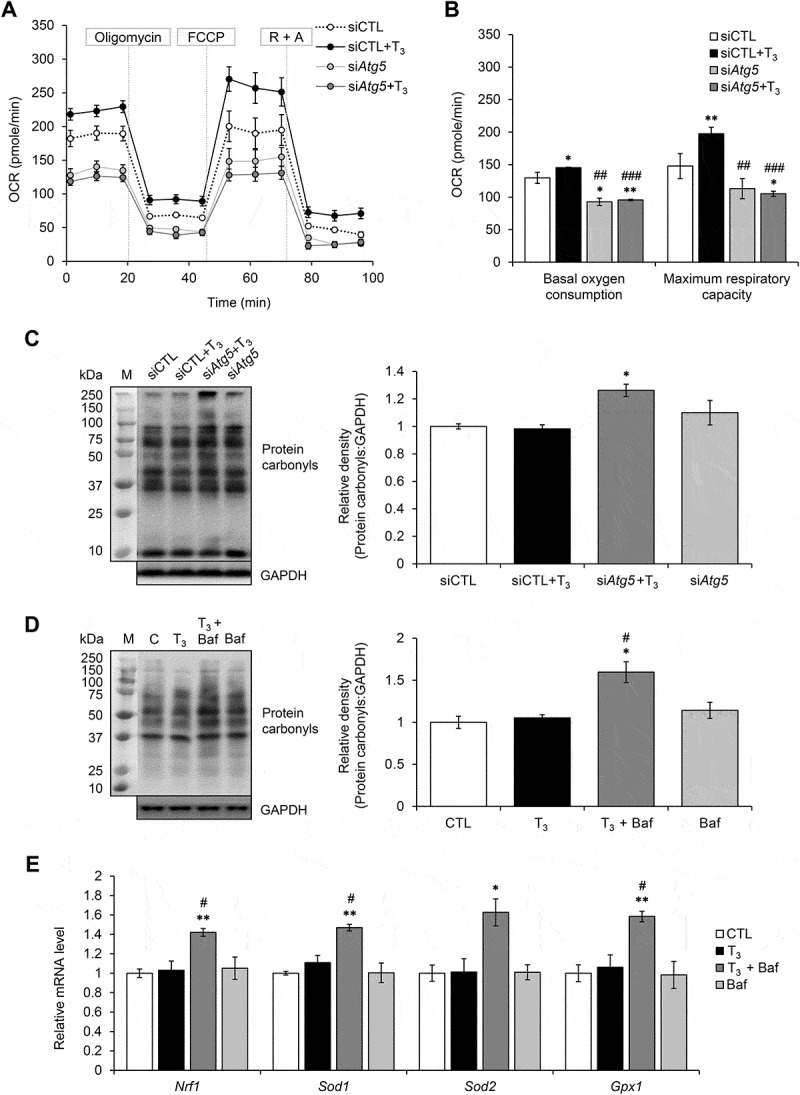
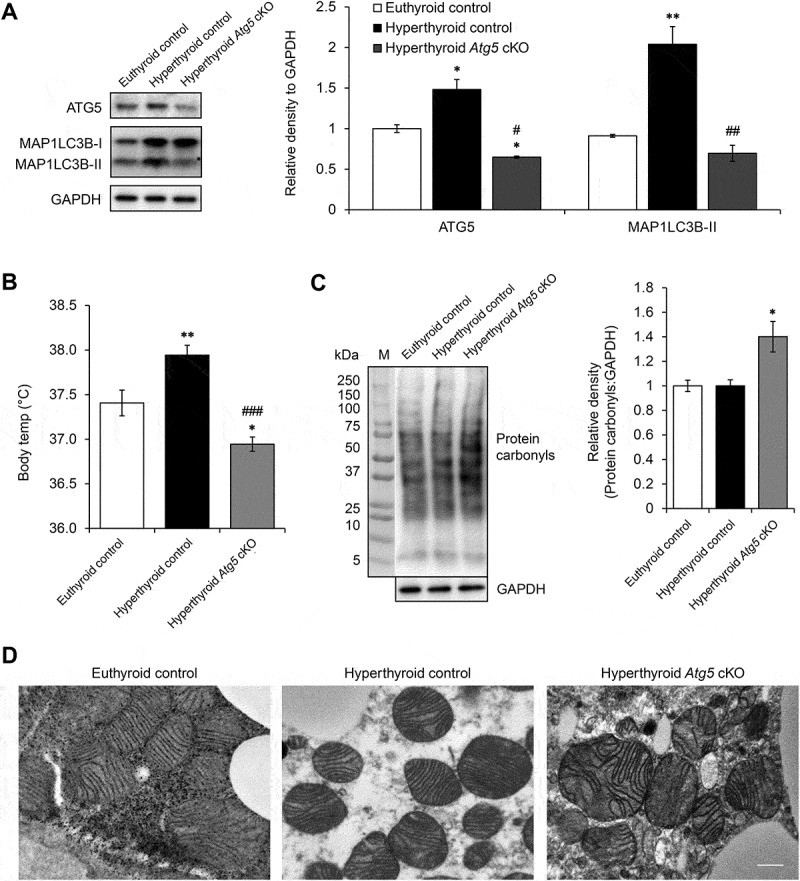
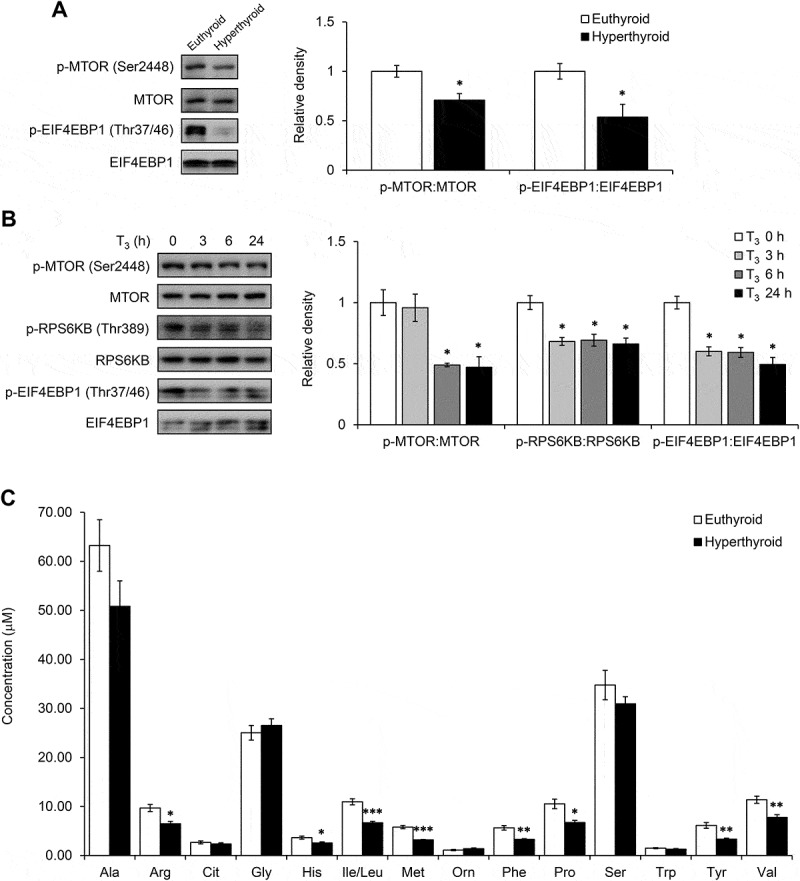
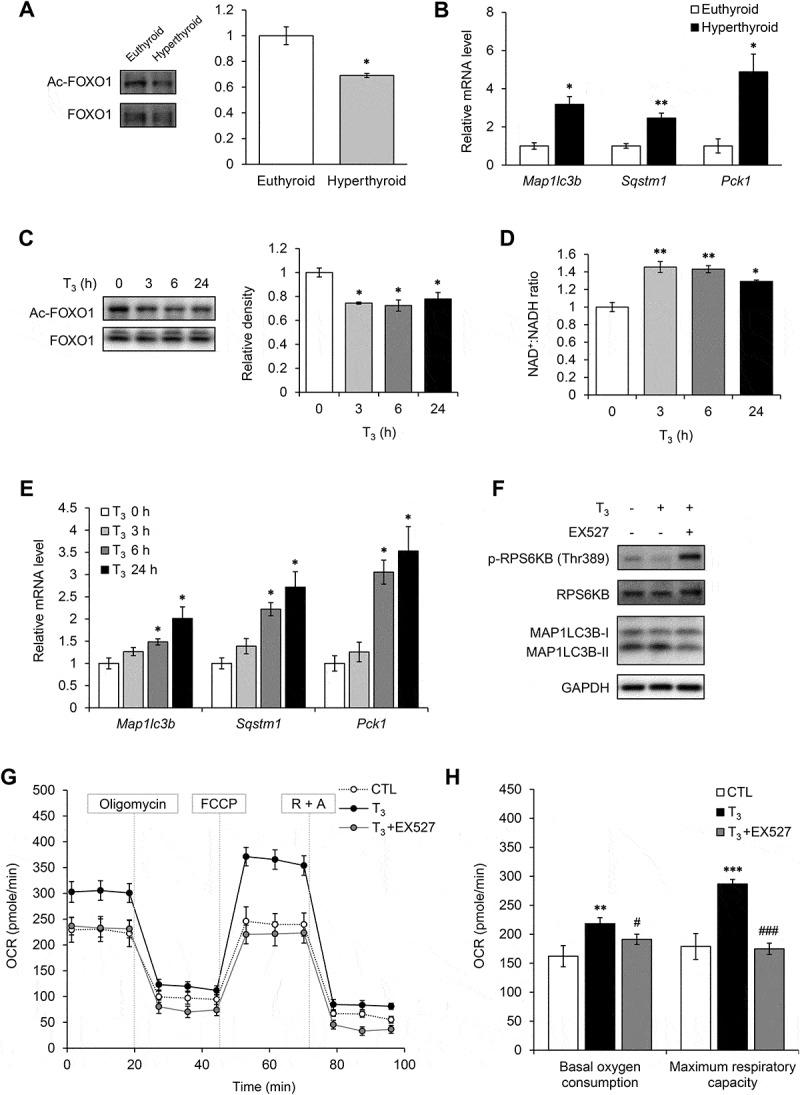
The thyroid hormone triiodothyronine (T3) activates thermogenesis by uncoupling electron transport from ATP synthesis in brown adipose tissue (BAT) mitochondria. Although T3 can induce thermogenesis by sympathetic innervation, little is known about its cell autonomous effects on BAT mitochondria. We thus examined effects of T3 on mitochondrial activity, autophagy, and metabolism in primary brown adipocytes and BAT and found that T3 increased fatty acid oxidation and mitochondrial respiration as well as autophagic flux, mitophagy, and mitochondrial biogenesis. Interestingly, there was no significant induction of intracellular reactive oxygen species (ROS) despite high mitochondrial respiration and UCP1 induction by T3. However, when cells were treated with Atg5 siRNA to block autophagy, induction of mitochondrial respiration by T3 decreased, and was accompanied by ROS accumulation, demonstrating a critical role for autophagic mitochondrial turnover. We next generated an Atg5 conditional knockout mouse model (Atg5 cKO) by injecting Ucp1 promoter-driven Cre-expressing adenovirus into Atg5Flox/Flox mice to examine effects of BAT-specific autophagy on thermogenesis in vivo. Hyperthyroid Atg5 cKO mice exhibited lower body temperature than hyperthyroid or euthyroid control mice. Metabolomic analysis showed that T3 increased short and long chain acylcarnitines in BAT, consistent with increased β-oxidation. T3 also decreased amino acid levels, and in conjunction with SIRT1 activation, decreased MTOR activity to stimulate autophagy. In summary, T3 has direct effects on mitochondrial autophagy, activity, and turnover in BAT that are essential for thermogenesis. Stimulation of BAT activity by thyroid hormone or its analogs may represent a potential therapeutic strategy for obesity and metabolic diseases. Abbreviations: ACACA: acetyl-Coenzyme A carboxylase alpha; AMPK: AMP-activated protein kinase; Acsl1: acyl-CoA synthetase long-chain family member 1; ATG5: autophagy related 5; ATG7: autophagy related 7; ATP: adenosine triphosphate; BAT: brown adipose tissue; cKO: conditional knockout; COX4I1: cytochrome c oxidase subunit 4I1; Cpt1b: carnitine palmitoyltransferase 1b, muscle; CQ: chloroquine; DAPI: 4',6-diamidino-2-phenylindole; DIO2: deiodinase, iodothyronine, type 2; DMEM: Dulbecco's modified Eagle's medium; EIF4EBP1: eukaryotic translation initiation factor 4E binding protein 1; Fabp4: fatty acid binding protein 4, adipocyte; FBS: fetal bovine serum; FCCP: carbonyl cyanide-4-(trifluoromethoxy)phenylhydrazone; FGF: fibroblast growth factor; FOXO1: forkhead box O1; GAPDH: glyceraldehyde-3-phosphate dehydrogenase; GFP: green fluorescent protein; Gpx1: glutathione peroxidase 1; Lipe: lipase, hormone sensitive; MAP1LC3B: microtubule-associated protein 1 light chain 3; mRNA: messenger RNA; MTORC1: mechanistic target of rapamycin kinase complex 1; NAD: nicotinamide adenine dinucleotide; Nrf1: nuclear respiratory factor 1; OCR: oxygen consumption rate; PBS: phosphate-buffered saline; PCR: polymerase chain reaction; PPARGC1A: peroxisome proliferative activated receptor, gamma, coactivator 1 alpha; Pnpla2: patatin-like phospholipase domain containing 2; Prdm16: PR domain containing 16; PRKA: protein kinase, AMP-activated; RPS6KB: ribosomal protein S6 kinase; RFP: red fluorescent protein; ROS: reactive oxygen species; SD: standard deviation; SEM: standard error of the mean; siRNA: small interfering RNA; SIRT1: sirtuin 1; Sod1: superoxide dismutase 1, soluble; Sod2: superoxide dismutase 2, mitochondrial; SQSTM1: sequestosome 1; T3: 3,5,3'-triiodothyronine; TFEB: transcription factor EB; TOMM20: translocase of outer mitochondrial membrane 20; UCP1: uncoupling protein 1 (mitochondrial, proton carrier); ULK1: unc-51 like kinase 1; VDAC1: voltage-dependent anion channel 1; WAT: white adipose tissue.

Keywords: Autophagy; brown adipose tissue; mitochondria; mitophagy; thermogenesis; thyroid hormone.


Figures

Figure 1.
Figure 1.
T3 induces autophagy in BAT and brown adipocytes. (a) Increased autophagic flux in T3-treated BATs. Immunoblots and densitometry showing MAP1LC3B-II and SQSTM1 levels in BATs of hyperthyroid mice. Results represent mean ± SEM (n = 3). (b) Electron microscopy images showing increased number of autophagic vesicles in hyperthyroid BAT. Scale bar: 2 μm. (c) Time course of MAP1LC3B-II induction in primary brown adipocytes treated with 10 nM T3 for 0, 3, 6 and 24 h. (d) Electron microscopy images showing increased number of autophagic vesicles in primary brown adipocytes treated with 10 nM T3 for 24 h. Scale bar: 1 μm. (e) Autophagic flux analysis showing accumulation of MAP1LC3B-II following autophagy inhibition. Primary brown adipocytes were treated with 10 nM T3 for 24 h. Cells were treated with 50 nM Baf to block autophagosome clearance 6 h before harvest. Result shows mean ± SD (n = 3) where n represents number of independent experiments. (f) Confocal images showing brown adipocyte cell line mBAP-9 transfected with eGFP-MAP1LC3B plasmid and treated with 10 nM T3 for 24 h. Yellow color represents MAP1LC3B-II on autophgosomes. Red color represents MAP1LC3B-II on lysosomes. Scale bar: 10 μm. (g) Quantitative analysis of the RFP (red) fluorescence relative to total (yellow) signal. Quantification of images (at least 10 transfected cells per each sample in 3 different fields) was done using ImageJ software. Result shows mean ± SD. *: < 0.05, **: < 0.01, ***: < 0.001.
Figure 2.
Figure 2.
T3 induces mitophagy in BAT and primary adipocytes. (a) Immunoblots and densitometry showing COX4I1 and TOMM20 levels relative to GAPDH in BATs of hyperthyroid mice injected with chloroquine (CQ) to block autophagy. The blots were from the same gel but cropped for better presentation (Figure S1). Result represents mean ± SD (n = 3). (b) Electron microscopy images showing mitochondria inside autophagic vesicles in CQ-treated hyperthyroid BATs. Scale bar: 0.5 μm. (c) Representative blots and quantification showing accumulation of TOMM20 and COX4I1 in T3-treated primary brown adipocytes after autophagy inhibition. Cells were treated 10 nM T3 for 24 h, followed by 50 nM Baf treatment 6 h before harvest. Result shows mean ± SD (n = 3) where n represents number of independent experiments. (d) Confocal images showing mBAP-9 cells transiently transfected with mito-RFP/GFP plasmid and treated with 10 nM T3 for 24 h. Yellow color represents normal cytosolic mitochondria. Red color represents mitochondria inside lysosomes. Scale bar: 10 μm. (e) Quantitative analysis of RFP (red) fluorescence over total (yellow) signal to represent relative mitophagy. ImageJ software was used for quantification (at least 10 transfected cells per each sample in 3 different fields). Result shows mean ± SD. *: < 0.05, **: < 0.01 ***: < 0.001 compared to control. #:< 0.05 compared to T3-treated group.
Figure 3.
Figure 3.
T3 increases mitochondrial biogenesis and turnover in BAT and primary brown adipocytes. (a) Real time PCR analysis of mRNA levels of Ucp1, Prdm16, Ppargc1a, Cpt1b, Acsl1, Pnpla2 and Lipe in BATs from hyperthyroid mice using Polr2a as the internal control. Result represents mean ± SEM (n = 5). (b) Representative blots and densitometry showing expression levels of COX4I1, TOMM20 and VDAC1 relative to GAPDH in hyperthyroid BATs. Bar represents mean ± SD (n = 3). (c) Graph showing increased mitochondrial DNA copy number in hyperthyroid BAT. Bar represents mean ± SEM (n = 5). (d) Real time PCR analysis of transcript levels of Ucp1, Prdm16 and Ppargc1a. Primary brown adipocytes were treated with 10 nM T3 for 24 h. Bar represents mean ± SD (n = 6) where n represents number of independent experiments. (e) Representative immunoblots and quantification showing expression levels of COX4I1, TOMM20 and VDAC1 relative to GAPDH in cells treated with 10 nM T3 for 24 h. Result represents mean ± SD (n = 3) where n represents number of independent experiments. *: < 0.05, **: < 0.01, ***: < 0.001. (f) Confocal images showing brown adipocyte cell line mBAP-9 transfected with pMitoTimer plasmid for 72 h. Green represents newly synthesized mitochondria. Red represents mature mitochondria. At indicated time periods before harvest, cells were treated with 10 nM T3. Scale bar: 10 μm.
Figure 4.
Figure 4.
T3 increases fatty acid oxidation and oxygen consumption in BAT and primary brown adipocytes. Metabolomic profiling of acylcarnitine levels in BATs. Graphs showing concentrations of (a) short chain and (b) long chain acylcarnitines in BATs from hyperthyroid mice. Result represents mean ± SEM (n = 6) (c, d) Seahorse analysis of oxygen consumption rate (OCR) for primary brown adipocytes treated with various doses of T3 for 24 h. OCR was measured continuously throughout the experimental period at baseline and in the presence of the indicated drugs: 1 μM oligomycin, 1 μM FCCP and 1 μM rotenone with 1 μM antimycin A (R + A). (e) Seahorse analysis of OCR for primary brown adipocytes treated with 10 μM of T3 for 30 min, 1 and 3 h (f) Graphs showing basal and maximal OCR at different concentrations of T3. Basal OCR denotes [OCR without inhibitor – OCR with rotenone and antimycin A (R + A) injection]. Maximal OCR or respiratory capacity is calculated by [OCR after FCCP injection – OCR with R + A injection]. Result shows mean ± SD (n = 6) where n represents number of independent experiments. *: < 0.05, **: < 0.01, ***: < 0.001.
Figure 5.
Figure 5.
Autophagy inhibition led to increased oxidative stress and reduces mitochondrial activity in primary brown adipocytes. (a) Seahorse analysis of OCR for primary brown adipocytes transfected with control (siCTL) or Atg5 siRNA (siAtg5) for 48 h and treated with or without 10 nM T3 for 24 h. (b) Graphs showing basal and maximal OCR of Atg5 siRNA transfected primary brown adipocytes treated with or without 10 nM T3. Result shows mean ± SD (n = 6) where n represents number of independent experiments. (c) Representative immunoblots and quantification showing protein carbonylation in primary brown adipocytes. Cell were transfected with Atg5 siRNA for 48 h and treated with or without 10 nM T3 24 h before harvest. Bar represents mean ± SD (n = 3) where n represents number of independent experiments. (d) Representative immunoblots and quantification showing protein carbonylation in primary brown adipocytes treated with 10 nM T3 for 24 h. Baf was added 6 h before harvest (Baf). Bar represents mean ± SD (n = 3) where n represents number of independent experiments. (e) Quantitative PCR result showing mRNA level of antioxidant proteins Nrf1, Sod1, Sod2 and Gpx1 using Polr2a as the internal control. Cell were treated with 10 nM T3 for 24 h with or without Baf. Bar represents mean ± SD (n = 3) where n represents number of independent experiments. *: < 0.05, **: < 0.01, ***: < 0.001 compared to control. #: < 0.05, ##: < 0.01, ###: < 0.001 compared to T3-treated group.
Figure 6.
Figure 6.
BAT-specific autophagy inhibition abolished T3-mediated thermogenesis. (a) Representative immunoblots and quantification showing decrease in ATG5 and MAP1LC3B-II level in BAT of Atg5 cKO mice. Bar represents mean ± SEM (n = 3). (b) Graph shows body temperature of control and Atg5 cKO and made hyperthyroid by daily T3 injection for 10 d. Result shows mean ± SEM (n = 3). (c) Representative immunoblots and quantification showing increased protein carbonyls in BAT of hyperthyroid Atg5 cKO mice. Bar represents mean ± SEM (n = 3). *: < 0.05, **: < 0.01 compared to control. #: < 0.05, ##: < 0.01, ###: < 0.001 compared to T3-treated group. (d) Electron microscopy images showing distorted mitochondria in hyperthyroid Atg5 cKO mice. Scale bar: 0.5 μm.
Figure 7.
Figure 7.
T3 inhibited MTOR in BAT and primary adipocytes. (a) Representative blots and quantification showing levels of phosphorylated MTOR and its downstream target EIF4EBP1 in BATs of hyperthyroid mice. Result represents mean ± SEM (n = 3). (b) Representative blots and densitometry showing levels of phosphorylated MTOR, RPS6KB and EIF4EBP1 in primary brown adipocytes treated with 10 nM T3 for 0, 3, 6 and 24 h. Result represents mean ± SD (n = 3) where n represents number of independent experiments. (c) Graph showing amino acid profile in hyperthyroid BAT. Result represents mean ± SEM (n = 6). *: < 0.05, **: < 0.01, ***: < 0.001 compared to euthyroid BAT.
Figure 8.
Figure 8.
T3 activated SIRT1 in BAT and primary adipocytes. (a) Representative blots and quantification showing levels of acetylated FOXO1 in BAT of hyperthyroid mice. Result represents mean ± SEM (n = 3). (b) Real time PCR analysis of mRNA levels of FOXO1 target genes (Map1lc3b, Sqstm1 and Pck1) in BAT. Result represents mean ± SEM (n = 5). (c) Representative blots and densitometry showing levels of acetylated FOXO1 in primary brown adipocytes treated with 10 nM T3 for 0, 3, 6 and 24 h. Result represents mean ± SD (n = 3) where n represents number of independent experiments. (d) Graph showing NAD+/NADH ratio in primary brown adipocytes treated with 10 nM T3 for 0, 3, 6 and 24 h. Result represents mean ± SD (n = 6) where n represents number of independent experiments. (e) Real time PCR analysis of mRNA levels of FOXO1 target genes (Map1lc3b, Sqstm1 and Pck1) in primary brown adipocytes adipocytes treated with 10 nM T3 for 0, 3, 6 and 24 h. Result represents mean ± SD (n = 6) where n represents number of independent experiments. (f) Effect of SIRT1 inhibitor on T3-induced MTOR inhibition and autophagy. Representative immunoblots showing levels of RPS6KB phosphorylation and MAP1LC3B-II in primary brown adipocytes treated with EX527 and T3 for 6 h. (g) and (h) Seahorse analysis of OCR for primary brown adipocytes transfected with treated with EX527 and T3 for 24 h. Result represents mean ± SEM (n = 5) where n represents number of independent experiments. *: < 0.05, **: < 0.01, ***: < 0.001 compared to euthyroid BAT.

Similar articles

Cited by

References

    1. Bianco AC, Kim BW.. Deiodinases: implications of the local control of thyroid hormone action. J Clin Invest. 2006. October;116(10):2571–2579. PubMed PMID: 17016550; PubMed Central PMCID: PMCPMC1578599. - PMC - PubMed
    1. Silva JE. The thermogenic effect of thyroid hormone and its clinical implications. Ann Intern Med. 2003. August 5;139(3):205–213. PubMed PMID: 12899588. - PubMed
    1. Bianco AC, Maia AL, da Silva WS, et al. Adaptive activation of thyroid hormone and energy expenditure. Biosci Rep. 2005. Jun-Aug;25(3–4):191–208. PubMed PMID: 16283553. - PubMed
    1. Obregon MJ. Adipose tissues and thyroid hormones. Front Physiol. 2014;5:479 PubMed PMID: 25566082; PubMed Central PMCID: PMCPMC4263094. - PMC - PubMed
    1. de Jesus LA, Carvalho SD, Ribeiro MO, et al. The type 2 iodothyronine deiodinase is essential for adaptive thermogenesis in brown adipose tissue. J Clin Invest. 2001. November;108(9):1379–1385. PubMed PMID: 11696583; PubMed Central PMCID: PMCPMC209445. - PMC - PubMed

Publication types

MeSH terms