Radiomics approach for preoperative identification of stages I - II and III - IV of esophageal cancer
- PMID: 30210219
- PMCID: PMC6129566
- DOI: 10.21147/j.issn.1000-9604.2018.04.02
Radiomics approach for preoperative identification of stages I - II and III - IV of esophageal cancer
Abstract
Objective: To predict preoperative staging using a radiomics approach based on computed tomography (CT) images of patients with esophageal squamous cell carcinoma (ESCC).
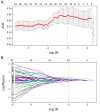
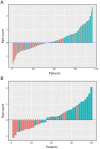
Methods: This retrospective study included 154 patients (primary cohort: n=114; validation cohort: n=40) with pathologically confirmed ESCC. All patients underwent a preoperative CT scan from the neck to abdomen. High throughput and quantitative radiomics features were extracted from the CT images for each patient. A radiomics signature was constructed using the least absolute shrinkage and selection operator (Lasso). Associations between radiomics signature, tumor volume and ESCC staging were explored. Diagnostic performance of radiomics approach and tumor volume for discriminating between stages I-II and III-IV was evaluated and compared using the receiver operating characteristics (ROC) curves and net reclassification improvement (NRI).
Results: A total of 9,790 radiomics features were extracted. Ten features were selected to build a radiomics signature after feature dimension reduction. The radiomics signature was significantly associated with ESCC staging (P<0.001), and yielded a better performance for discrimination of early and advanced stage ESCC compared to tumor volume in both the primary [area under the receiver operating characteristic curve (AUC): 0.795vs. 0.694, P=0.003; NRI=0.424)] and validation cohorts (AUC: 0.762 vs. 0.624, P=0.035; NRI=0.834).
Conclusions: The quantitative approach has the potential to identify stage I-II and III-IV ESCC before treatment.
Keywords: Esophageal cancer; diagnostic imaging; tumor staging; tumor volume.
Figures


Similar articles
-
Computed Tomography-Based Radiomics in Predicting T Stage and Length of Esophageal Squamous Cell Carcinoma.Front Oncol. 2021 Oct 14;11:722961. doi: 10.3389/fonc.2021.722961. eCollection 2021. Front Oncol. 2021. PMID: 34722265 Free PMC article.
-
CT radiomics features to predict lymph node metastasis in advanced esophageal squamous cell carcinoma and to discriminate between regional and non-regional lymph node metastasis: a case control study.Quant Imaging Med Surg. 2021 Feb;11(2):628-640. doi: 10.21037/qims-20-241. Quant Imaging Med Surg. 2021. PMID: 33532263 Free PMC article.
-
CT radiomics in the identification of preoperative understaging in patients with clinical stage T1-2N0 esophageal squamous cell carcinoma.Quant Imaging Med Surg. 2023 Dec 1;13(12):7996-8008. doi: 10.21037/qims-23-275. Epub 2023 Nov 13. Quant Imaging Med Surg. 2023. PMID: 38106287 Free PMC article.
-
Magnetic resonance imaging based radiomics signature for the preoperative discrimination of stage I-II and III-IV head and neck squamous cell carcinoma.Eur J Radiol. 2018 Sep;106:1-6. doi: 10.1016/j.ejrad.2018.07.002. Epub 2018 Jul 4. Eur J Radiol. 2018. PMID: 30150029
-
Radiomics nomogram outperforms size criteria in discriminating lymph node metastasis in resectable esophageal squamous cell carcinoma.Eur Radiol. 2019 Jan;29(1):392-400. doi: 10.1007/s00330-018-5581-1. Epub 2018 Jun 19. Eur Radiol. 2019. PMID: 29922924
Cited by
-
Computed Tomography-Based Radiomics in Predicting T Stage and Length of Esophageal Squamous Cell Carcinoma.Front Oncol. 2021 Oct 14;11:722961. doi: 10.3389/fonc.2021.722961. eCollection 2021. Front Oncol. 2021. PMID: 34722265 Free PMC article.
-
Artificial intelligence in gastrointestinal endoscopy: a comprehensive review.Ann Gastroenterol. 2024 Mar-Apr;37(2):133-141. doi: 10.20524/aog.2024.0861. Epub 2024 Feb 14. Ann Gastroenterol. 2024. PMID: 38481787 Free PMC article. Review.
-
Radiomic applications in upper gastrointestinal cancer surgery.Langenbecks Arch Surg. 2023 Jun 6;408(1):226. doi: 10.1007/s00423-023-02951-z. Langenbecks Arch Surg. 2023. PMID: 37278924 Review.
-
Automatic segmentation of esophageal cancer, metastatic lymph nodes and their adjacent structures in CTA images based on the UperNet Swin network.Cancer Med. 2024 Sep;13(18):e70188. doi: 10.1002/cam4.70188. Cancer Med. 2024. PMID: 39300922 Free PMC article.
-
CT-based radiomics for prediction of response to neoadjuvant immunochemotherapy in patients with esophageal carcinoma.Front Oncol. 2025 May 12;15:1511691. doi: 10.3389/fonc.2025.1511691. eCollection 2025. Front Oncol. 2025. PMID: 40519294 Free PMC article.
References
-
- Räsänen JV, Sihvo EI, Knuuti MJ, et al. Prospective analysis of accuracy of positron emission tomography, computed tomography, and endoscopic ultrasonography in staging of adenocarcinoma of the esophagus and the esophagogastric junction. Ann Surg Oncol. 2003;10:954–60. doi: 10.1245/ASO.2003.12.002. - DOI - PubMed
LinkOut - more resources
Full Text Sources
Other Literature Sources
