. 2018 Aug 28:11:288.
doi: 10.3389/fnmol.2018.00288. eCollection 2018.

Dysregulation of MicroRNAs and Target Genes Networks in Peripheral Blood of Patients With Sporadic Amyotrophic Lateral Sclerosis

Affiliations

Dysregulation of MicroRNAs and Target Genes Networks in Peripheral Blood of Patients With Sporadic Amyotrophic Lateral Sclerosis

Maria Liguori et al. Front Mol Neurosci. .

Erratum in

Abstract

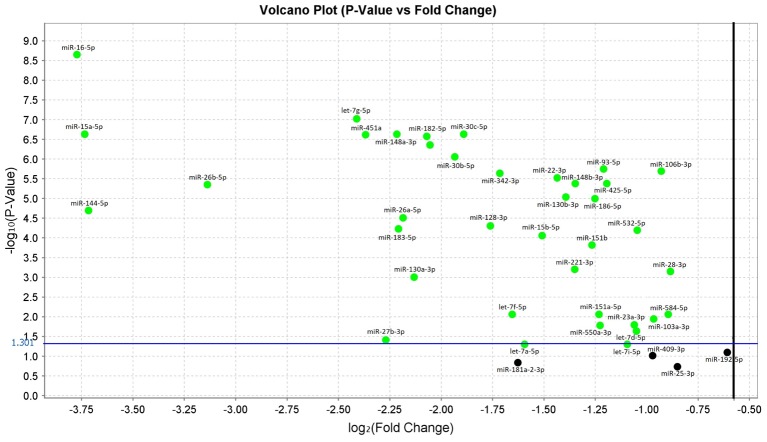
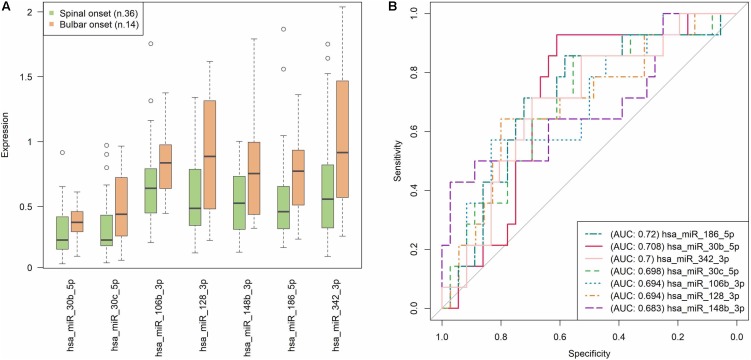
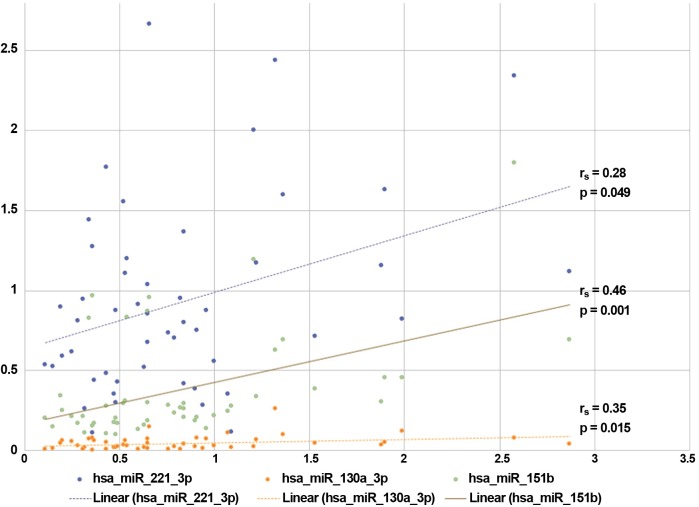
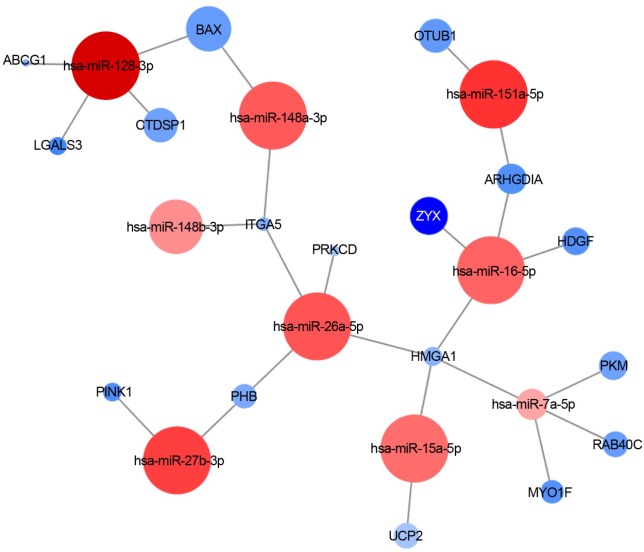
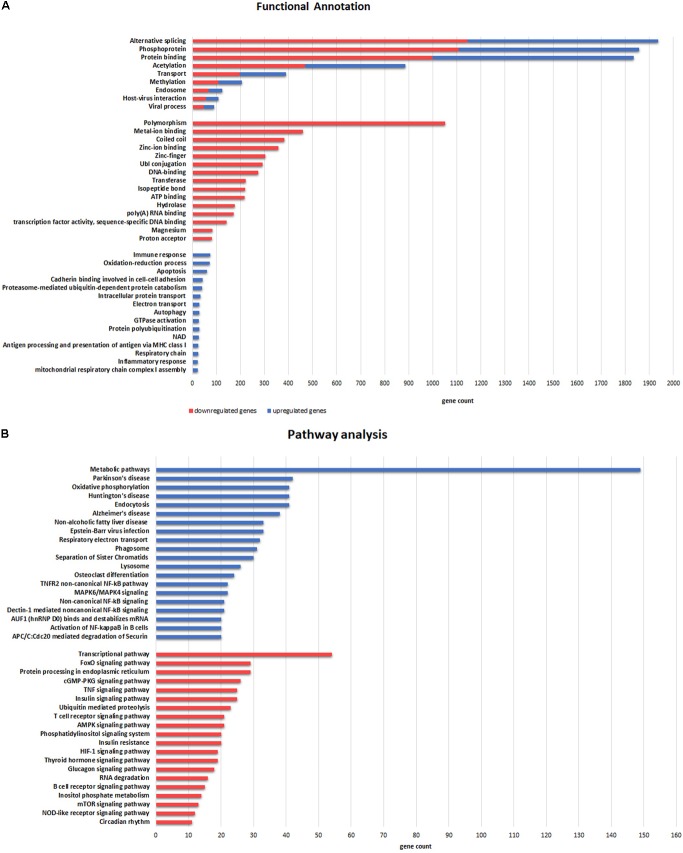
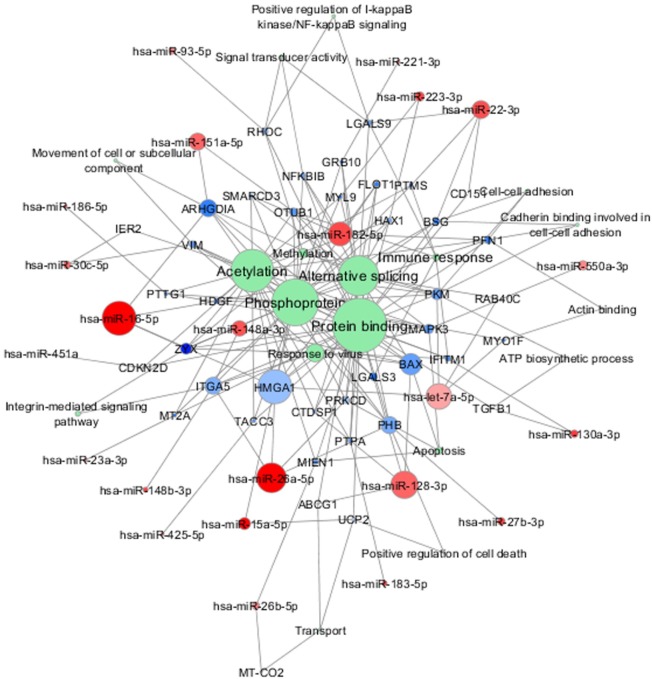
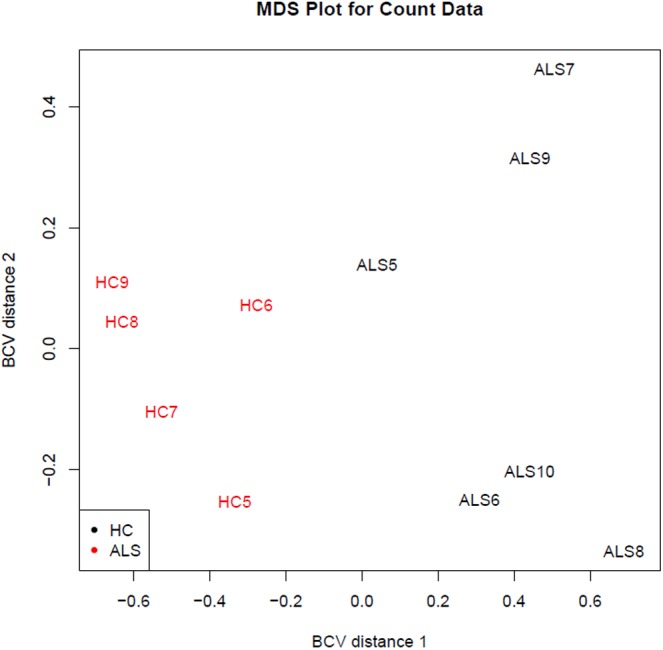
Amyotrophic lateral sclerosis (ALS) is a progressive and fatal neurodegenerative disease. While genetics and other factors contribute to ALS pathogenesis, critical knowledge is still missing and validated biomarkers for monitoring the disease activity have not yet been identified. To address those aspects we carried out this study with the primary aim of identifying possible miRNAs/mRNAs dysregulation associated with the sporadic form of the disease (sALS). Additionally, we explored miRNAs as modulating factors of the observed clinical features. Study included 56 sALS and 20 healthy controls (HCs). We analyzed the peripheral blood samples of sALS patients and HCs with a high-throughput next-generation sequencing followed by an integrated bioinformatics/biostatistics analysis. Results showed that 38 miRNAs (let-7a-5p, let-7d-5p, let-7f-5p, let-7g-5p, let-7i-5p, miR-103a-3p, miR-106b-3p, miR-128-3p, miR-130a-3p, miR-130b-3p, miR-144-5p, miR-148a-3p, miR-148b-3p, miR-15a-5p, miR-15b-5p, miR-151a-5p, miR-151b, miR-16-5p, miR-182-5p, miR-183-5p, miR-186-5p, miR-22-3p, miR-221-3p, miR-223-3p, miR-23a-3p, miR-26a-5p, miR-26b-5p, miR-27b-3p, miR-28-3p, miR-30b-5p, miR-30c-5p, miR-342-3p, miR-425-5p, miR-451a, miR-532-5p, miR-550a-3p, miR-584-5p, miR-93-5p) were significantly downregulated in sALS. We also found that different miRNAs profiles characterized the bulbar/spinal onset and the progression rate. This observation supports the hypothesis that miRNAs may impact the phenotypic expression of the disease. Genes known to be associated with ALS (e.g., PARK7, C9orf72, ALS2, MATR3, SPG11, ATXN2) were confirmed to be dysregulated in our study. We also identified other potential candidate genes like LGALS3 (implicated in neuroinflammation) and PRKCD (activated in mitochondrial-induced apoptosis). Some of the downregulated genes are involved in molecular bindings to ions (i.e., metals, zinc, magnesium) and in ions-related functions. The genes that we found upregulated were involved in the immune response, oxidation-reduction, and apoptosis. These findings may have important implication for the monitoring, e.g., of sALS progression and therefore represent a significant advance in the elucidation of the disease's underlying molecular mechanisms. The extensive multidisciplinary approach we applied in this study was critically important for its success, especially in complex disorders such as sALS, wherein access to genetic background is a major limitation.

Keywords: bioinformatics; clinical parameters; high throughput next-generation sequencing (HT-NGS); microRNA; pathway analysis; peripheral blood markers; sporadic amyotrophic lateral sclerosis; target genes.


Figures

FIGURE 1
FIGURE 1
Volcano plot of validated miRNAs. Green dots represent the 38 differentially expressed miRNAs obtained from the comparison between sALS and HC subjects by qRT-PCR (p < 0.05). All black dots below the blue line did not discriminate sALS from HC. The Y-axis represents the log10 of the p-value and the X-axis represents log fold change of miRNA expression in the sALS versus HC.
FIGURE 2
FIGURE 2
Prediction accuracy of significant miRNAs with respect to the type of disease onset (spinal/bulbar). (A) Each boxplot shows the 25th and the 75th percentiles on the bottom and top of the box, the band inside the box is the 50th percentile (the median) and the ends of the whiskers are the minimum and maximum of the data. Outliers are showed as isolated circles. (B) ROC curves based on miRNAs relative expression data (as resulted from qRT-PCR analysis). In our sample, the AUCs close to 0.7 suggest that none of the seven miRNAs exerts an exclusive impact on the type of sALS onset, but more likely they act together in order to modulate this phenotypic feature. Note that each value in the ROC curves is considered as a putative numerical threshold for separating the samples in the two onset conditions (spinal/bulbar). Then the sensitivity [true positive rate (TPR)] and Specificity [false positive rate (FPR)] are computed for that threshold. The more the expression values are not-overlapping between the two experimental conditions, the more the ROC curve is near the left and the top axes of the plot, and we obtain an area under the curve (AUC) = 1. The less the conditions are separable, the more the ROC curve approaches the bisector of the plot, with an AUC = 0.5.
FIGURE 3
FIGURE 3
Correlations between miRNAs expression and sALS clinical features. The expressions (fold changes) of three validated miRNAs correlated with the progression rate observed in our sALS population. Spearman rank-correlation test: p < 0.05.
FIGURE 4
FIGURE 4
miRNA-target interaction network. An example of experimentally validated miRNA-target gene interactions is visualized as a network (by Cytoscape 3.6.0). Nodes are colored according to the log2 fold change between sALS and HC (red: downregulated; blue: upregulated), and the node size is proportional to the p-value in the DE analysis.
FIGURE 5
FIGURE 5
Functional categories (A) and Pathway (B) enrichment analyses of DE genes. (A) Categories enriched in both upregulated (blue) and downregulated (red) genes are illustrated in the upper part. The more representative categories enriched in downregulated genes are illustrated in the middle section. Categories in the lower part are enriched in upregulated genes. (B) Pathways enriched in upregulated (blue) and downregulated (red) genes are illustrated in the upper and lower part, respectively. The X-axis represents gene counts involved in each functional category and pathway.
FIGURE 6
FIGURE 6
Combined molecular analysis in sALS. Functional annotations of experimentally validated target genes together with their miRNAs are visualized as a network (Cytoscape 3.6.0). Each node size is proportional to the degree of the node (connectivity). Green nodes correspond to functional annotations obtained by functional enrichment analysis (DAVID tool). Color gradient intensity of miRNA and target nodes correlates with upregulated (blue) or downregulated (red) expression levels.
FIGURE 7
FIGURE 7
Distribution of the study samples by sRNA-seq output (discovery phase). The sRNA-Seq data were explored by generating multi-dimensional scaling (MDS) plots. This visualizes the differences between the expression profiles of different samples in two dimensions using the biological coefficient of variation (BCV). The MDS plot shows clear separation of the sALS vs. HC samples.

Comment in

References

    1. Al-Chalabi A., van den Berg L. H., Veldink J. (2017). Gene discovery in amyotrophic lateral sclerosis: implications for clinical management. Nat. Rev. Neurol. 13 96–104. 10.1038/nrneurol.2016.182 - DOI - PubMed
    1. Altuvia Y., Landgraf P., Lithwick G., Elefant N., Pfeffer S., Aravin A., et al. (2005). Clustering and conservation patterns of human microRNAs. Nucleic Acids Res. 33 2697–2706. 10.1093/nar/gki567 - DOI - PMC - PubMed
    1. Alvarez-Zaldiernas C., Lu J., Zheng Y., Yang H., Blasi J., Solsona C., et al. (2016). Cellular redox systems impact the aggregation of Cu, Zn superoxide dismutase linked to familial amyotrophic lateral sclerosis. J. Biol. Chem. 291 17197–17208. 10.1074/jbc.M115.708230 - DOI - PMC - PubMed
    1. Beecham G. W., Hamilton K., Naj A. C., Martin E. R., Huentelman M., Myers A. J., et al. (2014). Genome-wide association meta-analysis of neuropathologic features of Alzheimer’s disease and related dementias. PLoS Genet. 10:e1004606. 10.1371/journal.pgen.1004606 - DOI - PMC - PubMed
    1. Bourassa M. W., Brown H. H., Borchelt D. R., Vogt S., Miller L. M. (2014). Metal-deficient aggregates and diminished copper found in cells expressing SOD1 mutations that cause ALS. Front. Aging Neurosci. 6:110. 10.3389/fnagi.2014.00110 - DOI - PMC - PubMed