

Tibetan Medical Formula Shi-Wei-Gan-Ning-Pill Protects Against Carbon Tetrachloride-Induced Liver Fibrosis - An NMR-Based Metabolic Profiling
- PMID: 30210344
- PMCID: PMC6123542
- DOI: 10.3389/fphar.2018.00965
Tibetan Medical Formula Shi-Wei-Gan-Ning-Pill Protects Against Carbon Tetrachloride-Induced Liver Fibrosis - An NMR-Based Metabolic Profiling
Abstract
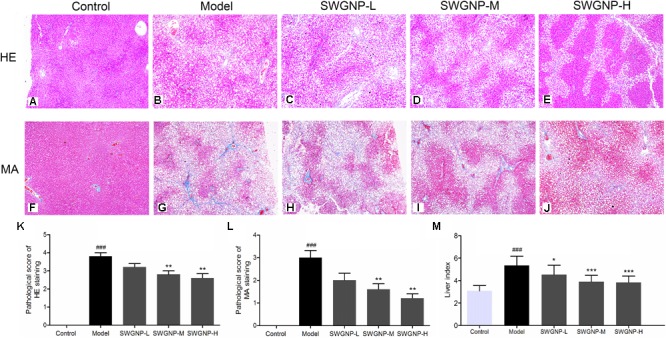
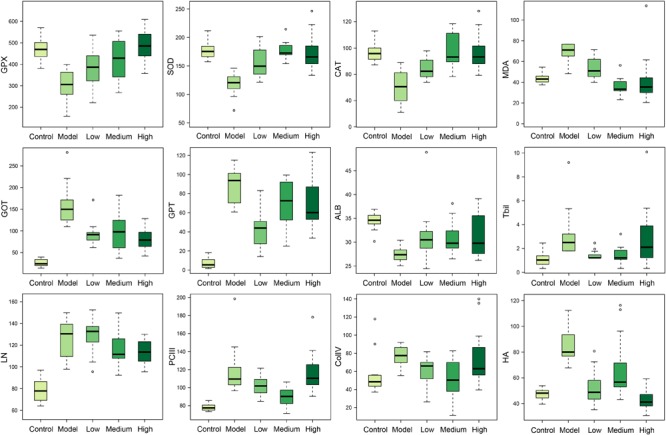
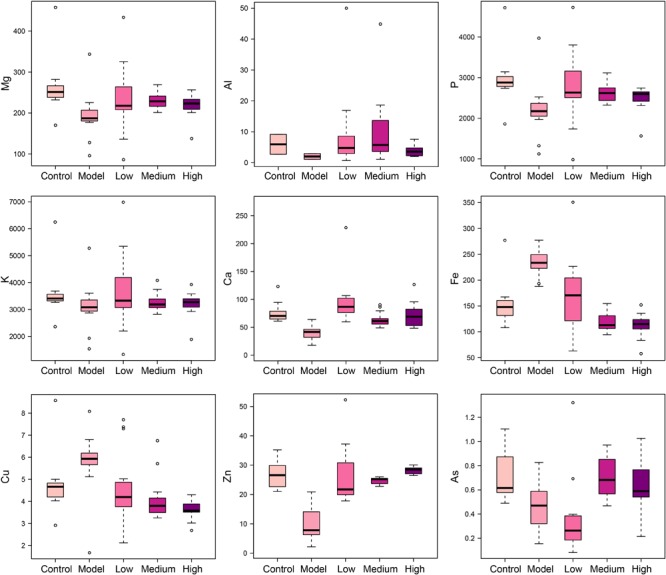
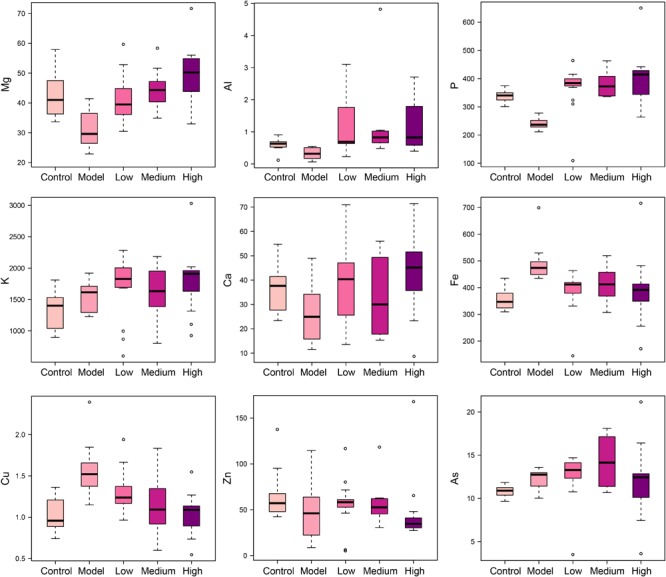
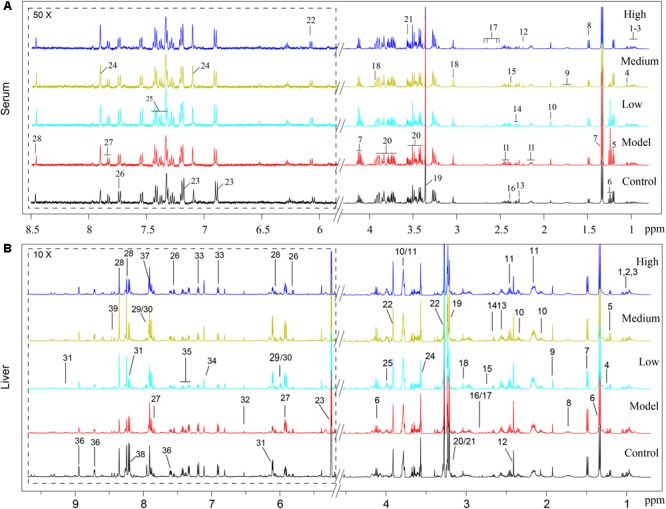
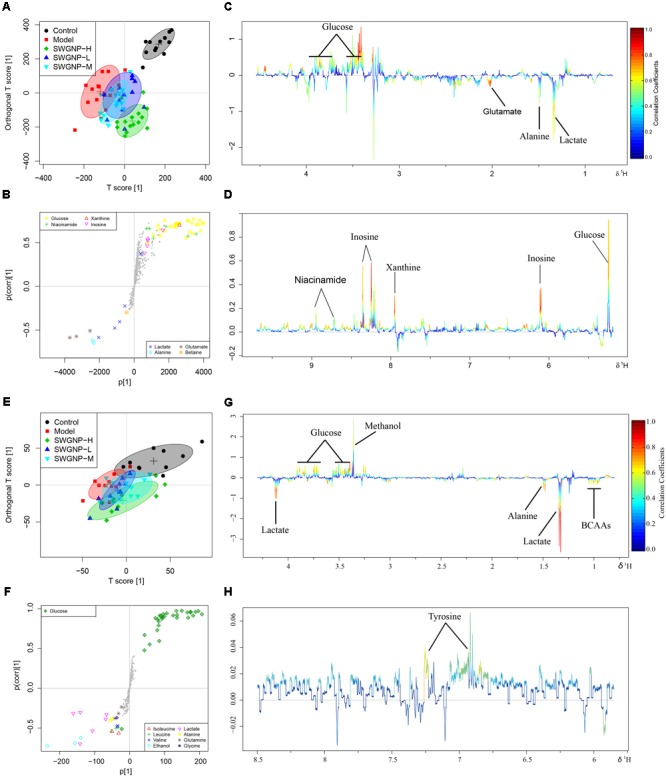
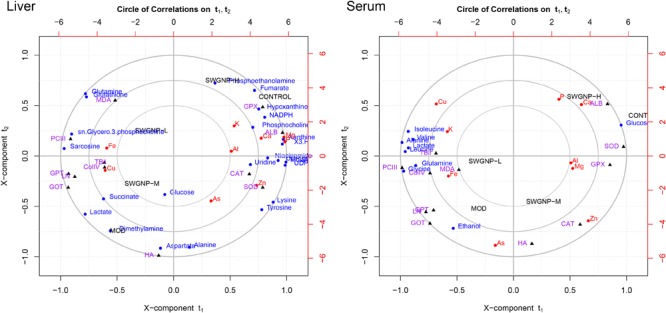
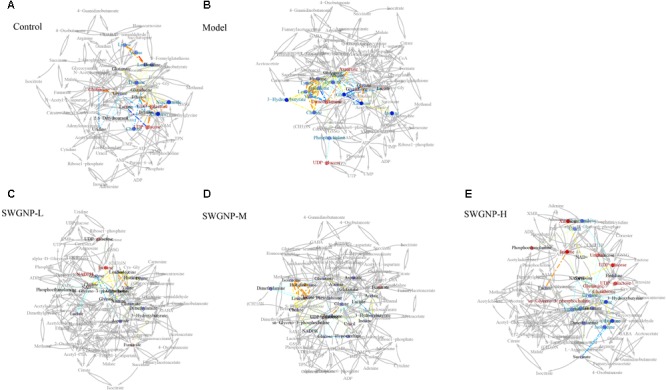
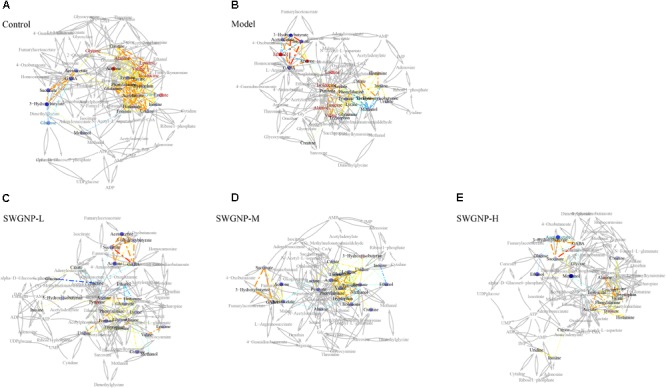
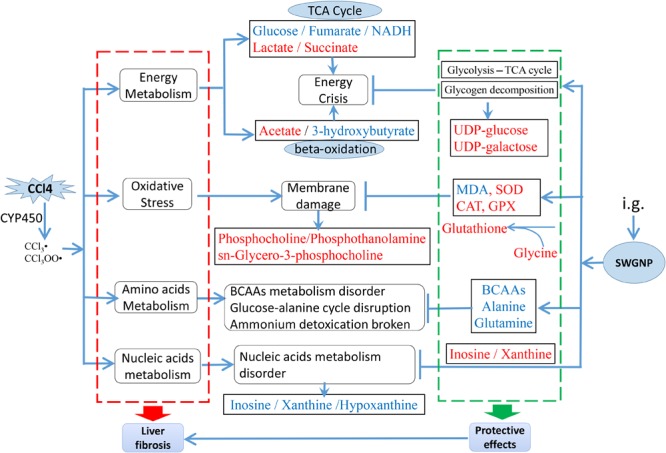
Liver fibrosis is a severe health problem, threatening the life quality and causing death, raising great concerns worldwide. Shi-Wei-Gan-Ning-Pill (SWGNP) is a traditional Tibetan recipe used to treat hepatic injuries; however, its hepatoprotective mechanism has not yet fully clarified. In this study, histological staining, biochemical assays, and elements determination were applied to evaluate the anti-fibrotic efficacy of SWGNP on a carbon tetrachloride (CCl4) induced hepato-fibrosis rat model. NMR-based metabolomics combined with orthogonal partial least squares-discriminant analysis (OPLS-DA), canonical regression analysis, and correlation networks analysis was used to characterize the potential biomarkers as well as metabolic pathways associated with the hepatoprotective activity of SWGNP. The results showed that SWGNP could significantly attenuate the pathological changes and decrease the levels of fibrosis markers (ColIV, HA, LN, and PCIII), and regulate the disordered elements distribution. Multivariate analysis and correlation network analysis revealed that SWGNP could protect rats against CCl4-induced liver fibrosis through anti-oxidation, repairing the impaired energy metabolisms and reversing the disturbed amino acids and nucleic acids metabolisms. In conclusion, this integrated metabolomics approach provided new insights into the mechanism of the hepatoprotective effect of SWGNP in liver fibrosis disease.
Keywords: NMR; Shi-Wei-Gan-Ning-Pill; Tibetan medical formula; carbon tetrachloride; liver fibrosis; metabolic profiling.
Figures
Similar articles
-
Tibetan Medicine Shi-Wei-Gan-Ning-San Alleviates Carbon Tetrachloride-Induced Chronic Liver Injury by Inhibiting TGF-β1 in Wistar Rats.Evid Based Complement Alternat Med. 2022 Aug 16;2022:2011876. doi: 10.1155/2022/2011876. eCollection 2022. Evid Based Complement Alternat Med. 2022. PMID: 36016677 Free PMC article.
-
Hepatoprotection of Herpetospermum caudigerum Wall. against CCl4-induced liver fibrosis on rats.J Ethnopharmacol. 2019 Jan 30;229:1-14. doi: 10.1016/j.jep.2018.09.033. Epub 2018 Sep 27. J Ethnopharmacol. 2019. PMID: 30268654
-
Investigation of the hepatoprotective effect of Corydalis saxicola Bunting on carbon tetrachloride-induced liver fibrosis in rats by 1H-NMR-based metabonomics and network pharmacology approaches.J Pharm Biomed Anal. 2018 Sep 10;159:252-261. doi: 10.1016/j.jpba.2018.06.065. Epub 2018 Jul 2. J Pharm Biomed Anal. 2018. PMID: 29990893
-
Liver metabolomics study reveals protective function of Phyllanthus urinaria against CCl4-induced liver injury.Chin J Nat Med. 2017 Jul;15(7):525-533. doi: 10.1016/S1875-5364(17)30078-X. Chin J Nat Med. 2017. PMID: 28807226
-
Metabolic profiling of endogenous bile acids: a novel method to assess hepatoprotective effect of Tanreqing capsule on carbon-tetrachloride-induced liver injury in rats.Chin J Nat Med. 2018 Apr;16(4):271-283. doi: 10.1016/S1875-5364(18)30057-8. Chin J Nat Med. 2018. PMID: 29703327
Cited by
-
Metabolomic and Lipidomic Biomarkers for Premalignant Liver Disease Diagnosis and Therapy.Metabolites. 2020 Jan 28;10(2):50. doi: 10.3390/metabo10020050. Metabolites. 2020. PMID: 32012846 Free PMC article. Review.
-
The Characterization of Subcutaneous Adipose Tissue in Sunit Sheep at Different Growth Stages: A Comprehensive Analysis of the Morphology, Fatty Acid Profile, and Metabolite Profile.Foods. 2024 Feb 9;13(4):544. doi: 10.3390/foods13040544. Foods. 2024. PMID: 38397521 Free PMC article.
-
Three-tiered authentication of herbal traditional Chinese medicine ingredients used in women's health provides progressive qualitative and quantitative insight.Front Pharmacol. 2024 Feb 5;15:1353434. doi: 10.3389/fphar.2024.1353434. eCollection 2024. Front Pharmacol. 2024. PMID: 38375033 Free PMC article.
-
Traditional utilization, botany, phytochemistry, pharmacology, pharmaceutical analysis, processing and application of the seeds of Herpetospermum pedunculosum (Ser.) C.B. Clarke: a comprehensive review.Front Pharmacol. 2024 Dec 19;15:1498768. doi: 10.3389/fphar.2024.1498768. eCollection 2024. Front Pharmacol. 2024. PMID: 39749198 Free PMC article. Review.
-
Comparative Analysis of Compatibility Influence on Invigorating Blood Circulation for Combined Use of Panax Notoginseng Saponins and Aspirin Using Metabolomics Approach.Front Pharmacol. 2021 Apr 30;12:544002. doi: 10.3389/fphar.2021.544002. eCollection 2021. Front Pharmacol. 2021. PMID: 33995000 Free PMC article.
References
-
- Baker M. (2011). Metabolomics: from small molecules to big ideas. Nat. Methods 8 117–121. 10.1038/nmeth0211-117 - DOI
-
- Benjamini Y., Hochberg Y. (1995). Controlling the false discovery rate: a practical and powerful approach to multiple testing. J. R. Statis. Soc. Ser. B (Methodol.) 57 289–300.
LinkOut - more resources
Full Text Sources
Other Literature Sources