. 2018 Jul 17:4:13.
doi: 10.1038/s41420-018-0078-x. eCollection 2018.

Cellular and molecular responses to acute cocaine treatment in neuronal-like N2a cells: potential mechanism for its resistance in cell death

Affiliations

Cellular and molecular responses to acute cocaine treatment in neuronal-like N2a cells: potential mechanism for its resistance in cell death

Ramesh B Badisa et al. Cell Death Discov. .

Erratum in

Abstract

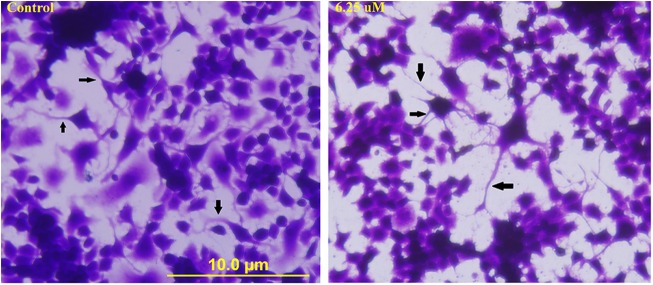
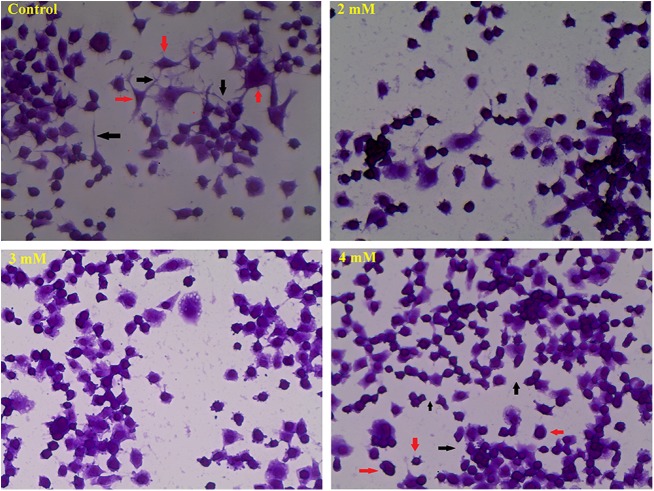
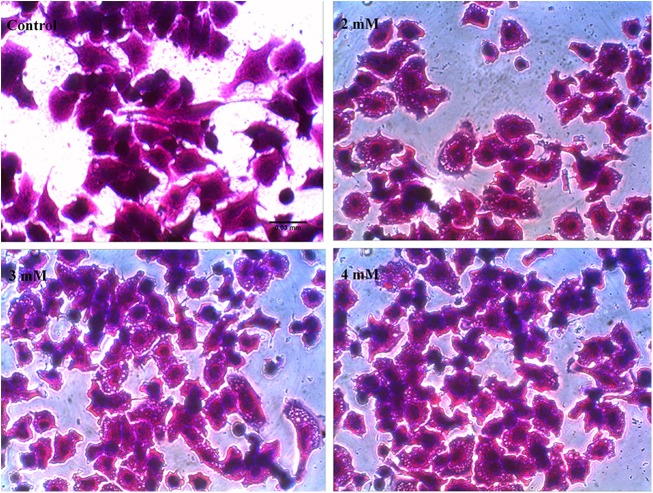
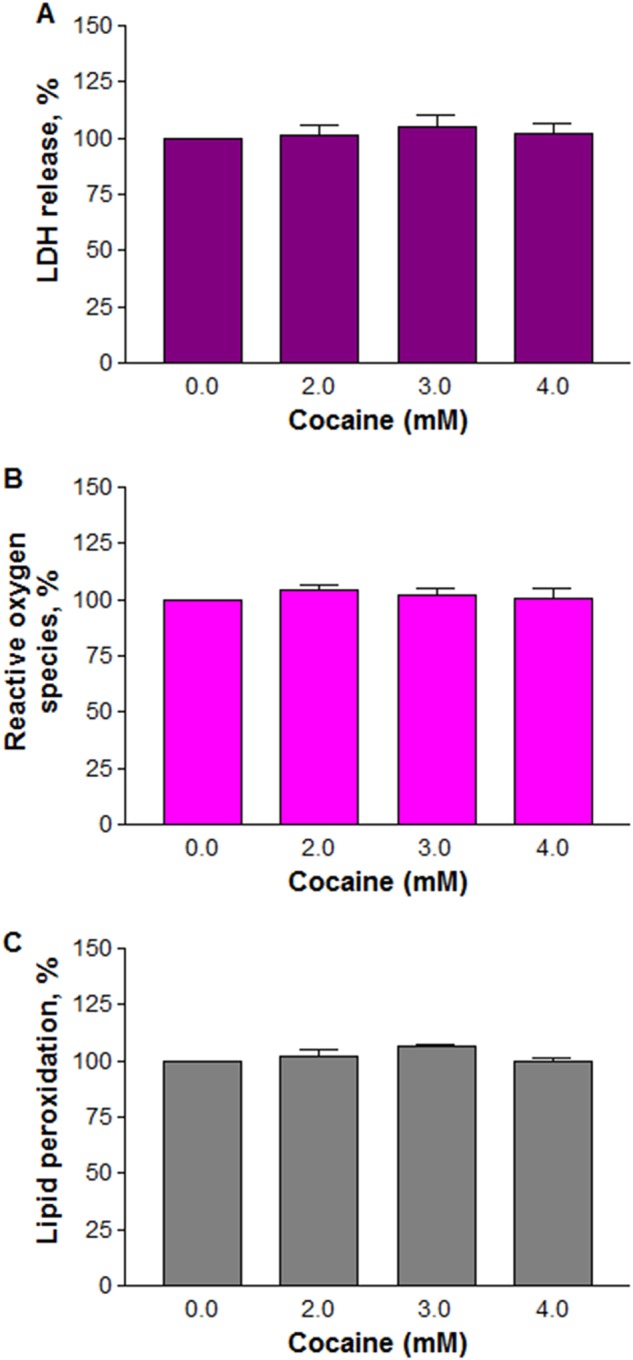
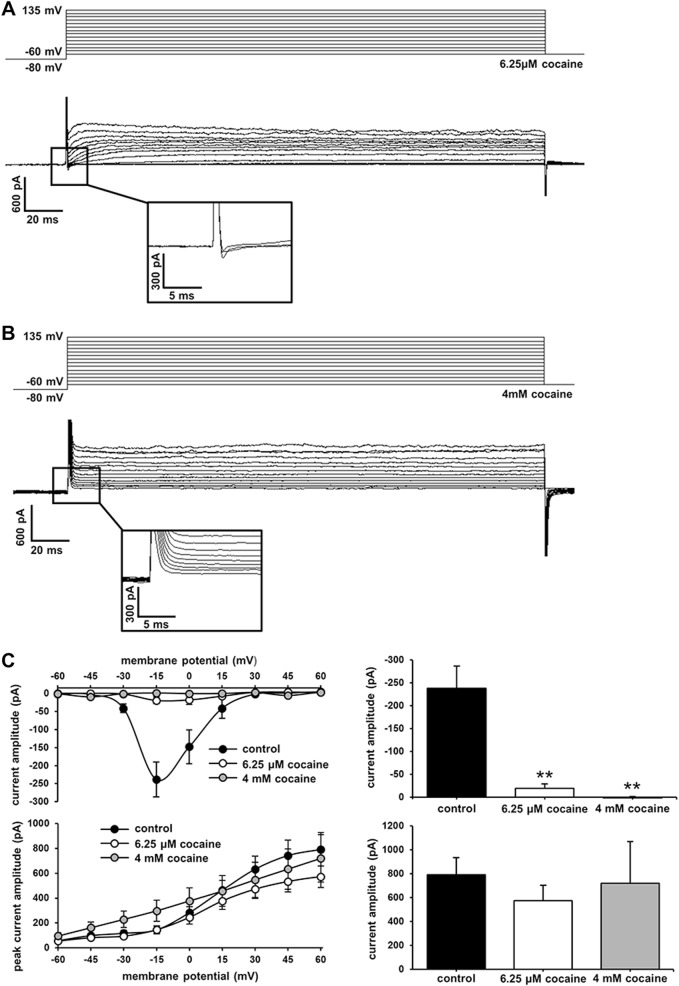
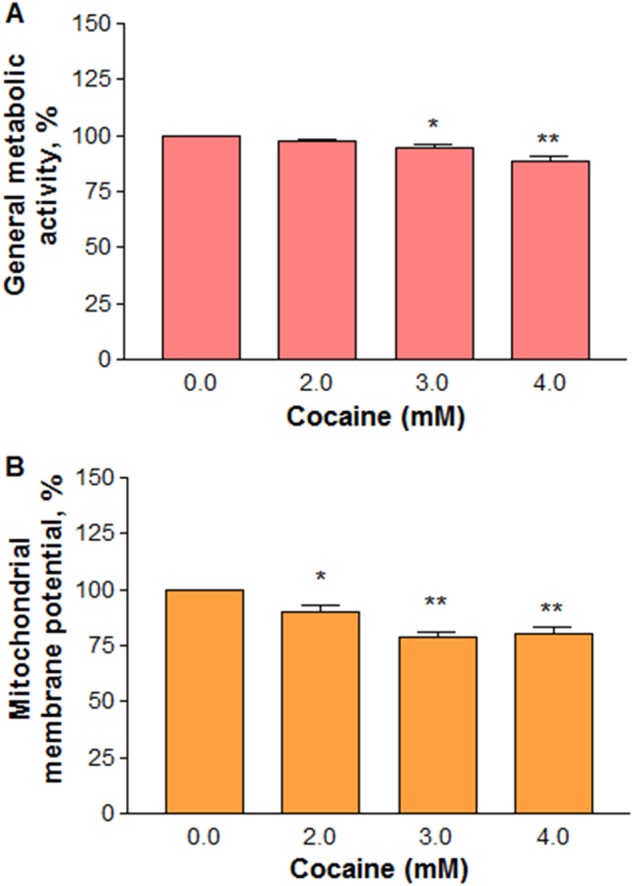
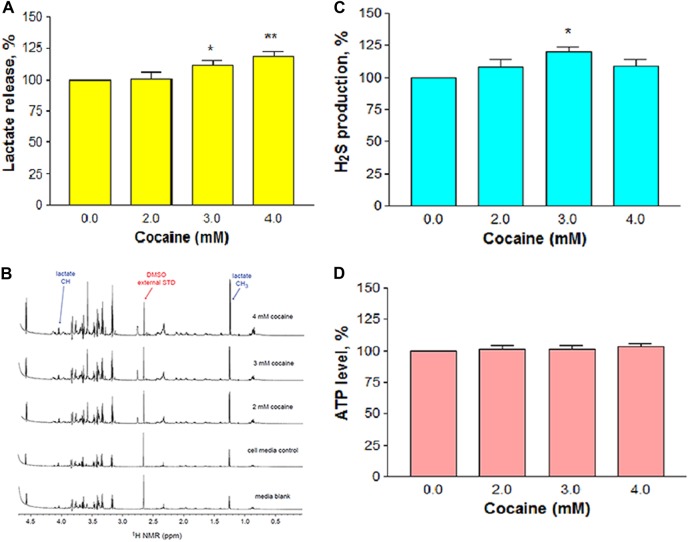
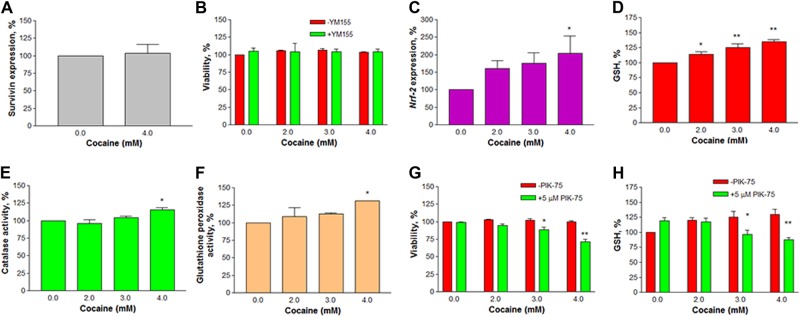
Cocaine is a highly abused drug that causes psychiatric and neurological problems. Its entry into neurons could alter cell-biochemistry and contribute in the manifestation of early pathological symptoms. We have previously shown the acute cocaine effects in rat C6 astroglia-like cells and found that these cells were highly sensitive to cocaine in terms of manifesting certain pathologies known to underlie psychological disorders. The present study was aimed to discern acute cocaine effects on the early onset of various changes in Neuro-2a (N2a) cells. Whole-cell patch-clamp recording of differentiated cells displayed the functional voltage-gated Na+ and K+ channels, which demonstrated the neuronal characteristics of the cells. Treatment of these cells with acute cocaine (1 h) at in vivo (nM to μM) and in vitro (mM) concentrations revealed that the cells remained almost 100% viable. Cocaine administration at 6.25 μM or 4 mM doses significantly reduced the inward currents but had no significant effect on outward currents, indicating the Na+ channel-blocking activity of cocaine. While no morphological change was observed at in vivo doses, treatment at in vitro doses altered the morphology, damaged the neurites, and induced cytoplasmic vacuoles; furthermore, general mitochondrial activity and membrane potential were significantly decreased. Mitochondrial dysfunction enabled the cells switch to anaerobic glycolysis, evidenced by dose-dependent increases in lactate and H2S, resulting unaltered ATP level in the cells. Further investigation on the mechanism of action unfolded that the cell's resistance to cocaine was through the activation of nuclear factor E2-related factor-2 (Nrf-2) gene and subsequent increase of antioxidants (glutathione [GSH], catalase and GSH peroxidase [GPx]). The data clearly indicate that the cells employed a detoxifying strategy against cocaine. On a broader perspective, we envision that extrapolating the knowledge of neuronal resistance to central nervous system (CNS) diseases could delay their onset or progression.


Conflict of interest statement

The authors declare that they have no conflict of interest.

Figures

Fig. 1
Fig. 1. Effect of in vivo concentration of cocaine on morphology.
The cells were treated with equal volume of vehicle (PBS control) or 6.25 μM cocaine for 1 h. Morphological images were taken using an inverted phase contrast IX-70 Olympus microscope with ×20 objective. Arrows show the inter-neuronal connections in the control and 6.25 μM treated cells. Scale bar: 10 μm
Fig. 2
Fig. 2. Effect of in vitro doses of cocaine on cell morphology.
The cells were treated with equal volume of vehicle (PBS control) or 2–4 mM cocaine for 1 h. Morphological images were taken using EVOS Cell Imaging Systems with ×40 objective. Black arrows show the inter-neuronal connections in the control cells and their loss with 4 mM treatment; red arrows indicate triangular or polygonal morphology of control cells but changed to round upon 4 mM treatment.
Fig. 3
Fig. 3. Induction of vacuoles in cells at in vitro doses of cocaine.
The cells were treated with equal volume of vehicle (PBS control) or 2–4 mM cocaine for 1 h. Optical images of vacuoles were taken using an inverted phase contrast IX-70 Olympus microscope with ×40 objective. Scale bar: 0.03 mm
Fig. 4
Fig. 4. Effect of cocaine on plasma membrane integrity.
The cells were treated with various concentrations of cocaine for 1 h. LDH (a) release (n= 8), ROS (b) generation (n= 8) or lipid (c) peroxidation (n= 12) were measured in a micro plate reader. Data were represented as mean ± SEM, P > 0.05, insignificant compared to control, one-way ANOVA, Dunnett’s multiple comparison test
Fig. 5
Fig. 5. Cocaine treatment reduces inward current amplitude.
Representative voltage clamp trace showing reduced inward currents after a low dose (6.25 μM) and b high dose (4 mM) cocaine treatment. Step size = 15 mV. The inset shows a high magnification view of inward currents. c (Left) Current–voltage relationship of inward currents (top) and outward currents (bottom) measured from untreated, low dose, and high dose cocaine-treated N2a cells (n = 8 for each group). c (Right) Average peak current amplitude at −15 mV (top, inward currents) and +60 mV (bottom, outward currents). **P < 0.001, significant in comparison to corresponding controls, one-way ANOVA, Bonferroni’s multiple comparison tests
Fig. 6
Fig. 6. Effect of cocaine on mitochondria.
The cells were treated with various concentrations of cocaine for 1 h. General metabolic activity (a, n= 12) or membrane potential (b, n = 8) were measured in a micro plate reader. Significant in comparison to the control (*P< 0.05 or **P < 0.01, one-way ANOVA, Dunnett’s multiple comparison test)
Fig. 7
Fig. 7. Cocaine-induced anaerobic characters.
The cells were treated with various concentrations of cocaine for 1 h. Lactate was measured by colorimetric (a) method (n = 12). Medium from the untreated cells was taken as a control while the medium without cells was used as a blank. Confirmation of lactate release by1H+ NMR (b) spectroscopy. Lactate peaks are visible in the spectra at 1.25 ppm for the methyl group (doublet) and 4.04 ppm for the methine group (quartet), c H2S production (n = 16), and d ATP measurement by bioluminescence (n = 8). Significant in comparison to the control (*P< 0.05 or **P < 0.01, one-way ANOVA, Dunnett’s multiple comparison test)
Fig. 8
Fig. 8. Effect of cocaine on survivin, Nrf-2, and antioxidants.
For survivin gene expression, the mRNA levels in 4 mM cocaine-treated and control cells were quantified (n = 4) by real-time PCR using GAPDH as the reference gene (a); in another study, the cells were pretreated with 1 µM YM155 (survivin gene inhibitor) for 30 min, followed by cocaine co-treatment for 1 h, and the cell viability was measured (n = 4) in a micro plate reader (b). For Nrf-2 gene expression, the mRNA level was quantified (n= 3) by real-time PCR using GAPDH as the reference gene (c). Colorimetric assays were performed for glutathione (n = 9) (d) or catalase (e, n = 3) or GPx (f, n = 3) or role of PIK-75 (Nrf-2 inhibitor) on cocaine treated cells for viability (g, n = 8) or glutathione (h, n = 8). Data were represented as mean ± SEM, significant compared to the control (*P< 0.05 or **P < 0.01, one-way ANOVA, Dunnett’s (a, c, df) or Bonferroni’s (b, g, h) multiple comparison tests)

References

    1. Haas C, Karila L, Lowenstein W. Cocaine and crack addiction: a growing public health problem. Bull. Acad. Natl. Med. 2009;193:947–962. - PubMed
    1. Wilkinson P, Van Dyke C, Jatlow P, Barash P, Byck R. Intranasal and oral cocaine kinetics. Clin. Pharmacol. Ther. 1980;27:386–394. doi: 10.1038/clpt.1980.52. - DOI - PubMed
    1. Barnett G, Hawks R, Resnick R. Cocaine pharmacokinetics in humans. J. Ethnopharmacol. 1981;3:353–366. doi: 10.1016/0378-8741(81)90063-5. - DOI - PubMed
    1. Chou MJ, Ambre JJ, Ruo TI. Kinetics of cocaine distribution, elimination, and chronotropic effects. Clin. Pharmacol. Ther. 1986;38:318–324. doi: 10.1038/clpt.1985.179. - DOI - PubMed
    1. Fattore L, et al. Astroglial in vivo response to cocaine in mouse dentate gyrus: a quantitative and qualitative analysis by confocal microscopy. Neuroscience. 2002;110:1–6. doi: 10.1016/S0306-4522(01)00598-X. - DOI - PubMed

LinkOut - more resources