

Changes in cerebral activation in individuals with and without visual vertigo during optic flow: A functional near-infrared spectroscopy study
- PMID: 30211002
- PMCID: PMC6129736
- DOI: 10.1016/j.nicl.2018.08.034
Changes in cerebral activation in individuals with and without visual vertigo during optic flow: A functional near-infrared spectroscopy study
Abstract
Background and purpose: Individuals with visual vertigo (VV) describe symptoms of dizziness, disorientation, and/or impaired balance in environments with conflicting visual and vestibular information or complex visual stimuli. Physical therapists often prescribe habituation exercises using optic flow to treat these symptoms, but it is not known how individuals with VV process the visual stimuli. The primary purpose of this study was to use functional near-infrared spectroscopy (fNIRS) to determine if individuals with VV have different cerebral activation during optic flow compared with control subjects.
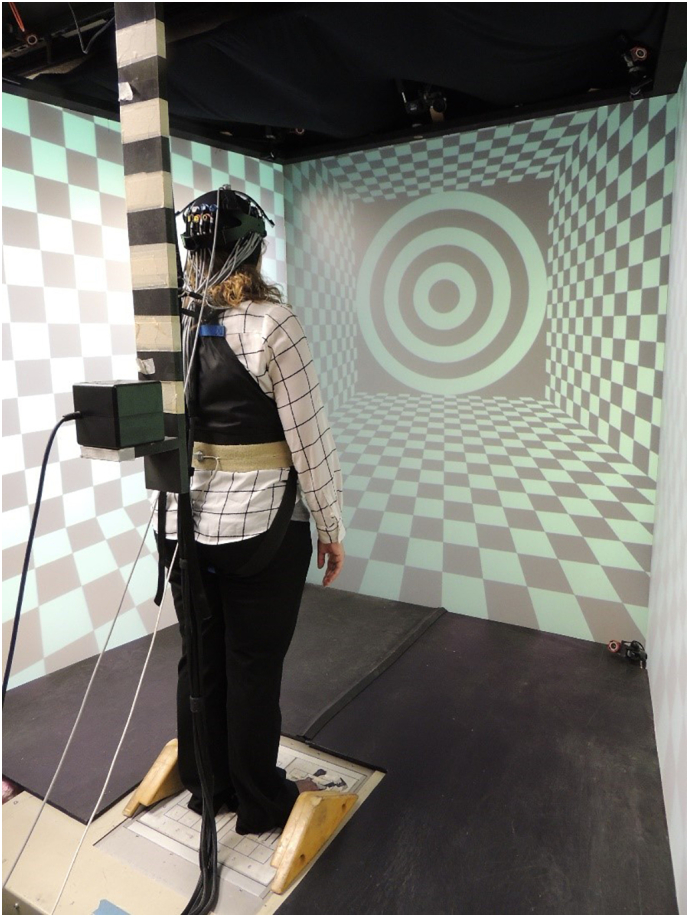
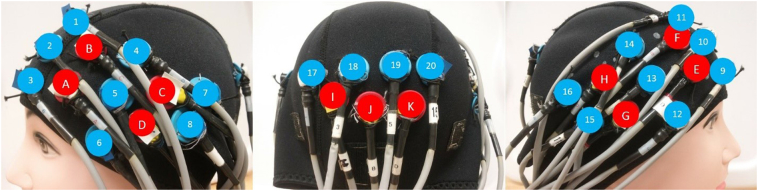
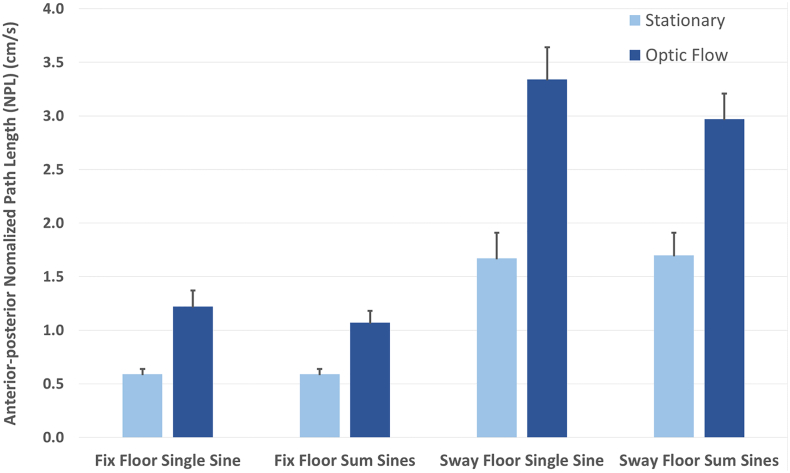
Methods: Fifteen individuals (5 males and 10 females in each group) with VV seeking care for dizziness and 15 healthy controls (CON) stood in a virtual reality environment and viewed anterior-posterior optic flow. The support surface was either fixed or sway-referenced. Changes in cerebral activation were recorded using fNIRS during periods of optic flow relative to a stationary visual environment. Postural sway of the head and center of mass was recorded using an electromagnetic tracker.
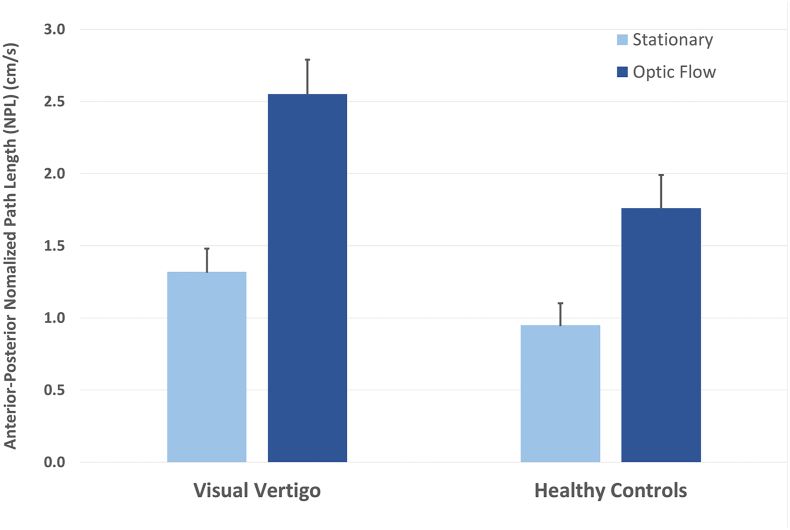
Results: Compared with CON, the VV group displayed decreased activation in the bilateral middle frontal regions when viewing optic flow while standing on a fixed platform. Despite both groups having significantly increased activation in most regions while viewing optic flow on a sway-referenced surface, the VV group did not have as much of an increase in the right middle frontal region when viewing unpredictable optic flow in comparison with the CON group.
Discussion and conclusions: Individuals with VV produced a pattern of reduced middle frontal cerebral activation when viewing optic flow compared with CON. Decreased activation in the middle frontal regions of the cerebral cortex may represent an alteration in control over the normal reciprocal inhibitory visual-vestibular interaction in visually dependent individuals. Although preliminary, these findings add to a growing body of literature using functional brain imaging to explore changes in cerebral activation in individuals with complaints of dizziness, disorientation, and unsteadiness. Future studies in larger samples should explore if this decreased activation is modified following a rehabilitation regimen consisting of visual habituation exercises.
Keywords: Balance; Brain function; Brain imaging; Near-infrared spectroscopy; Neuroimaging.
Figures
Similar articles
-
Perceptual Postural Imbalance and Visual Vertigo.Curr Neurol Neurosci Rep. 2019 Mar 16;19(5):19. doi: 10.1007/s11910-019-0939-6. Curr Neurol Neurosci Rep. 2019. PMID: 30877392 Review.
-
Functional near-infrared spectroscopy during optic flow with and without fixation.PLoS One. 2018 Mar 7;13(3):e0193710. doi: 10.1371/journal.pone.0193710. eCollection 2018. PLoS One. 2018. PMID: 29513720 Free PMC article.
-
Changes in Cortical Activation During Dual-Task Walking in Individuals With and Without Visual Vertigo.J Neurol Phys Ther. 2020 Apr;44(2):156-163. doi: 10.1097/NPT.0000000000000310. J Neurol Phys Ther. 2020. PMID: 32168158 Free PMC article.
-
Aging Affects the Ability to Process the Optic Flow Stimulations: A Functional Near-Infrared Spectrometry Study.J Mot Behav. 2020;52(4):466-473. doi: 10.1080/00222895.2019.1645639. Epub 2019 Jul 30. J Mot Behav. 2020. PMID: 31361196
-
Exploring brain functions in autism spectrum disorder: A systematic review on functional near-infrared spectroscopy (fNIRS) studies.Int J Psychophysiol. 2019 Mar;137:41-53. doi: 10.1016/j.ijpsycho.2019.01.003. Epub 2019 Jan 19. Int J Psychophysiol. 2019. PMID: 30664885
Cited by
-
Functional Near-Infrared Spectrometry as a Useful Diagnostic Tool for Understanding the Visual System: A Review.J Clin Med. 2024 Jan 4;13(1):282. doi: 10.3390/jcm13010282. J Clin Med. 2024. PMID: 38202288 Free PMC article. Review.
-
Advancing Gait Analysis: Integrating Multimodal Neuroimaging and Extended Reality Technologies.Bioengineering (Basel). 2025 Mar 19;12(3):313. doi: 10.3390/bioengineering12030313. Bioengineering (Basel). 2025. PMID: 40150777 Free PMC article. Review.
-
Neuroimaging studies in persistent postural-perceptual dizziness and related disease: a systematic review.J Neurol. 2022 Mar;269(3):1225-1235. doi: 10.1007/s00415-021-10558-x. Epub 2021 May 21. J Neurol. 2022. PMID: 34019178
-
Persistent Postural-Perceptual Dizziness (PPPD) from Brain Imaging to Behaviour and Perception.Brain Sci. 2022 Jun 8;12(6):753. doi: 10.3390/brainsci12060753. Brain Sci. 2022. PMID: 35741638 Free PMC article.
-
Perceptual Postural Imbalance and Visual Vertigo.Curr Neurol Neurosci Rep. 2019 Mar 16;19(5):19. doi: 10.1007/s11910-019-0939-6. Curr Neurol Neurosci Rep. 2019. PMID: 30877392 Review.
References
-
- Andersen G., Dyre B. Spatial orientation from optic flow in the central visual field. Percept. Psychophys. 1989;45(5):453–458. - PubMed
-
- Benjamini Y., Hochberg Y. Controlling the false discovery rate: a practical and powerful approach to multiple testing. J. R. Stat. Soc. 1995:289–300.
-
- Bense S., Stephan T., Yousry T.A., Brandt T., Dieterich M. Multisensory cortical signal increases and decreases during vestibular galvanic stimulation (fMRI) J. Neurophysiol. 2001;85(2):886–899. - PubMed
-
- Bense S., Bartenstein P., Lochmann M., Schlindwein P., Brandt T., Dieterich M. Metabolic changes in vestibular and visual cortices in acute vestibular neuritis. Ann. Neurol. 2004;56(5):624–630. - PubMed
Publication types
MeSH terms
LinkOut - more resources
Full Text Sources
Other Literature Sources
Medical
