

Fecal Hyodeoxycholic Acid Is Correlated With Tylosin-Induced Microbiome Changes in Growing Pigs
- PMID: 30211174
- PMCID: PMC6121748
- DOI: 10.3389/fvets.2018.00196
Fecal Hyodeoxycholic Acid Is Correlated With Tylosin-Induced Microbiome Changes in Growing Pigs
Abstract
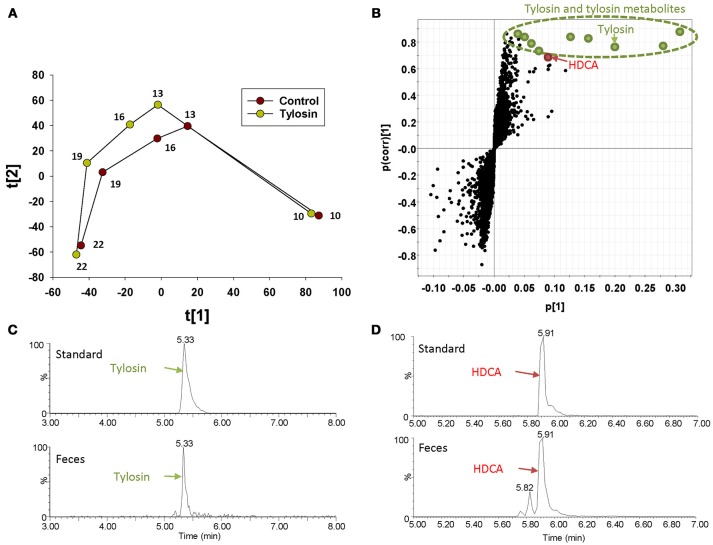
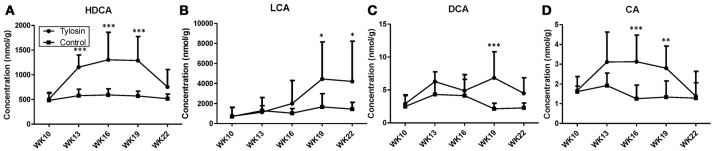
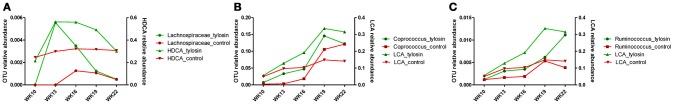
The changes in the gut microbiome play an important role in the promoting effects of antibiotics, such as tylosin, to the health, and productivity of farm animals. Microbial metabolites are expected to be key mediators between antibiotics-induced microbiome changes and growth-promoting effects. The objective of this study was to extend the identification of tylosin-responsive microbes to the identification of tylosin-responsive metabolites in growing pigs. The feeding trial was conducted on a commercial farm using two pens of pigs fed diets with and without tylosin (40 mg/kg of diet). Fecal samples were collected from 10 pigs per pen at weeks 10, 13, 16, 19, and 22 of age, and subsequently analyzed using liquid chromatography-mass spectrometry (LC-MS) analysis. The multivariate model of LC-MS data showed that time-dependent changes occurred in the fecal metabolome of both control and tylosin-treated pigs. More importantly, the metabolomic profiles were similar between the tylosin treatment and control groups in weeks 10 and 22, but diverged during weeks 13-19. Subsequent analyses of the fecal metabolites contributing to the separation of two groups of pigs showed that hyodeoxycholic acid (HDCA), together with tylosin and its metabolites in feces, was greatly increased during weeks 13-19 (P < 0.05) in the group of pigs fed tylosin. The integration of current metabolomics data and the microbiome data from a previous study revealed the consistency between HDCA and a specific genus of microbes in the Clostridia family. Further studies are required to determine the causative relations between tylosin-elicited changes in HDCA and the microbiome as well as the role of HDCA in the growth promoting effects of tylosin.
Keywords: antibiotics; bile acids; metabolomics; microbiome; pigs.
Figures
Similar articles
-
Effects of Tylosin Administration Routes on the Prevalence of Antimicrobial Resistance Among Fecal Enterococci of Finishing Swine.Foodborne Pathog Dis. 2019 May;16(5):309-316. doi: 10.1089/fpd.2018.2551. Epub 2019 Jan 24. Foodborne Pathog Dis. 2019. PMID: 30676777
-
Reduced Feeding Frequency Improves Feed Efficiency Associated With Altered Fecal Microbiota and Bile Acid Composition in Pigs.Front Microbiol. 2021 Oct 12;12:761210. doi: 10.3389/fmicb.2021.761210. eCollection 2021. Front Microbiol. 2021. PMID: 34712219 Free PMC article.
-
The Microbiome and Metabolome of Preterm Infant Stool Are Personalized and Not Driven by Health Outcomes, Including Necrotizing Enterocolitis and Late-Onset Sepsis.mSphere. 2018 Jun 6;3(3):e00104-18. doi: 10.1128/mSphere.00104-18. Print 2018 Jun 27. mSphere. 2018. PMID: 29875143 Free PMC article.
-
Development of high-performance chemical isotope labeling LC-MS for profiling the human fecal metabolome.Anal Chem. 2015 Jan 20;87(2):829-36. doi: 10.1021/ac503619q. Epub 2014 Dec 25. Anal Chem. 2015. PMID: 25486321
-
Dietary fat and gut microbiota interactions determine diet-induced obesity in mice.Mol Metab. 2016 Oct 13;5(12):1162-1174. doi: 10.1016/j.molmet.2016.10.001. eCollection 2016 Dec. Mol Metab. 2016. PMID: 27900259 Free PMC article.
Cited by
-
Experimental facility had a greater effect on growth performance, gut microbiome, and metabolome in weaned pigs than feeding diets containing subtherapeutic levels of antibiotics: A case study.PLoS One. 2023 Aug 3;18(8):e0285266. doi: 10.1371/journal.pone.0285266. eCollection 2023. PLoS One. 2023. PMID: 37535525 Free PMC article.
-
Alginate Alleviates Dextran Sulfate Sodium-Induced Colitis by Promoting Bifidobacterium animalis and Intestinal Hyodeoxycholic Acid Synthesis in Mice.Microbiol Spectr. 2022 Dec 21;10(6):e0297922. doi: 10.1128/spectrum.02979-22. Epub 2022 Oct 11. Microbiol Spectr. 2022. PMID: 36219101 Free PMC article.
-
The Nonsteroidal Anti-Inflammatory Drug Ketorolac Alters the Small Intestinal Microbiota and Bile Acids Without Inducing Intestinal Damage or Delaying Peristalsis in the Rat.Front Pharmacol. 2021 Jun 4;12:664177. doi: 10.3389/fphar.2021.664177. eCollection 2021. Front Pharmacol. 2021. PMID: 34149417 Free PMC article.
-
Analysis of Gastrointestinal Responses Revealed Both Shared and Specific Targets of Zinc Oxide and Carbadox in Weaned Pigs.Antibiotics (Basel). 2020 Jul 30;9(8):463. doi: 10.3390/antibiotics9080463. Antibiotics (Basel). 2020. PMID: 32751572 Free PMC article.
-
Dose-Dependent Effects of Supplementing a Two-Strain Bacillus subtilis Probiotic on Growth Performance, Blood Parameters, Fecal Metabolites, and Microbiome in Nursery Pigs.Animals (Basel). 2023 Dec 28;14(1):109. doi: 10.3390/ani14010109. Animals (Basel). 2023. PMID: 38200840 Free PMC article.
References
-
- Tubiello FN, Salvatore M, Rossi S, Ferrara A, Fitton N, Smith P. The FAOSTAT database of greenhouse gas emissions from agriculture. Environ Res Lett. (2013) 8:1–10. 10.1088/1748-9326/8/1/015009 - DOI
LinkOut - more resources
Full Text Sources
Other Literature Sources