. 2018 Sep 5:4:31.
doi: 10.1038/s41523-018-0083-5. eCollection 2018.

Genomic and expression profiling reveal molecular heterogeneity of disseminated tumor cells in bone marrow of early breast cancer

Affiliations

Genomic and expression profiling reveal molecular heterogeneity of disseminated tumor cells in bone marrow of early breast cancer

Mark Jesus M Magbanua et al. NPJ Breast Cancer. .

Abstract

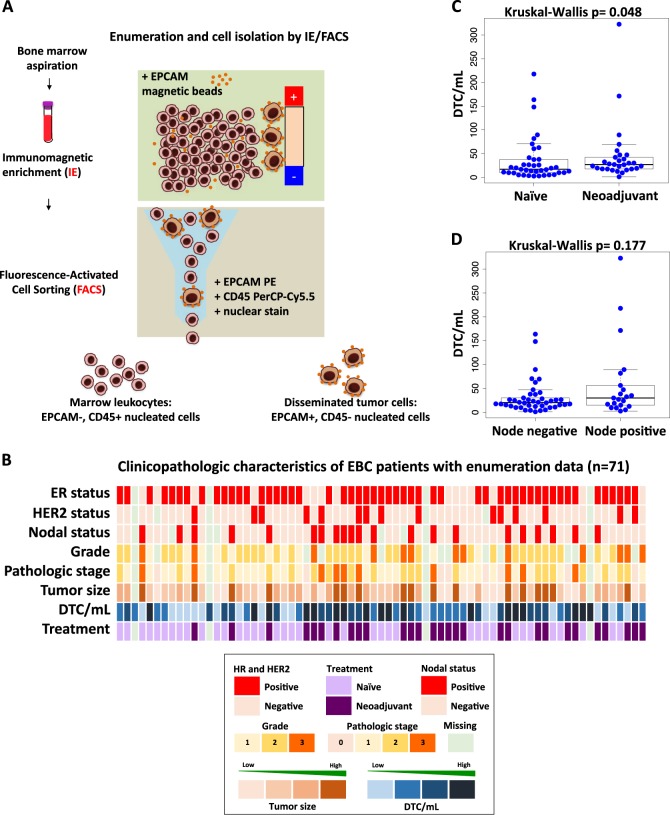
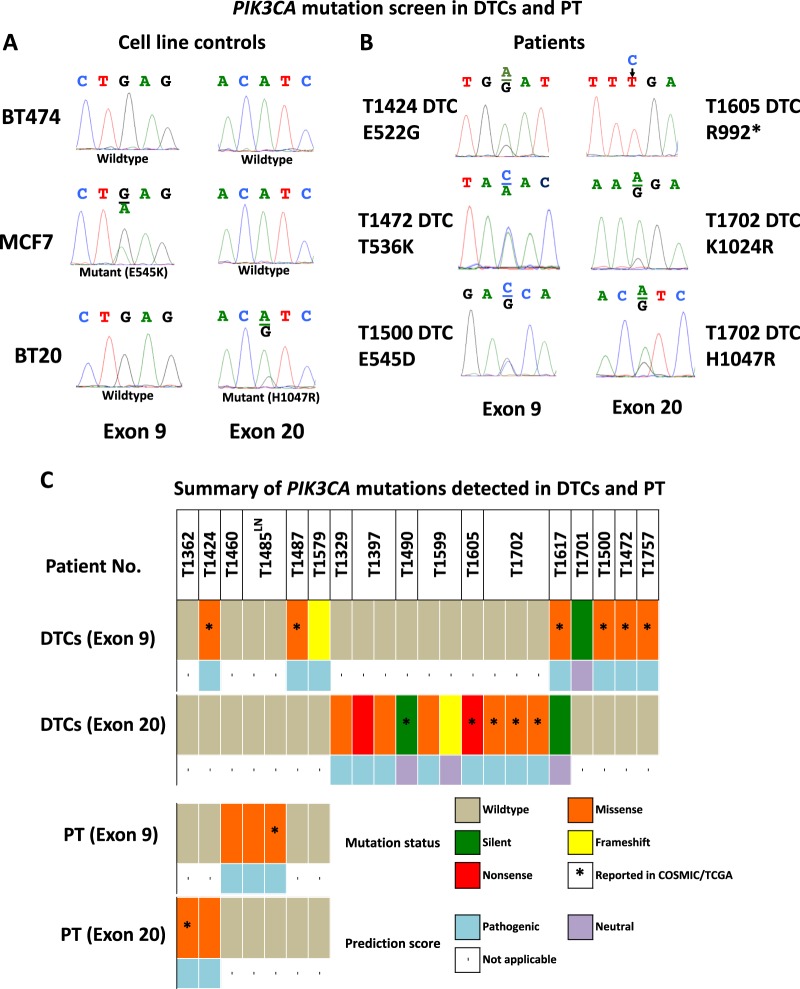
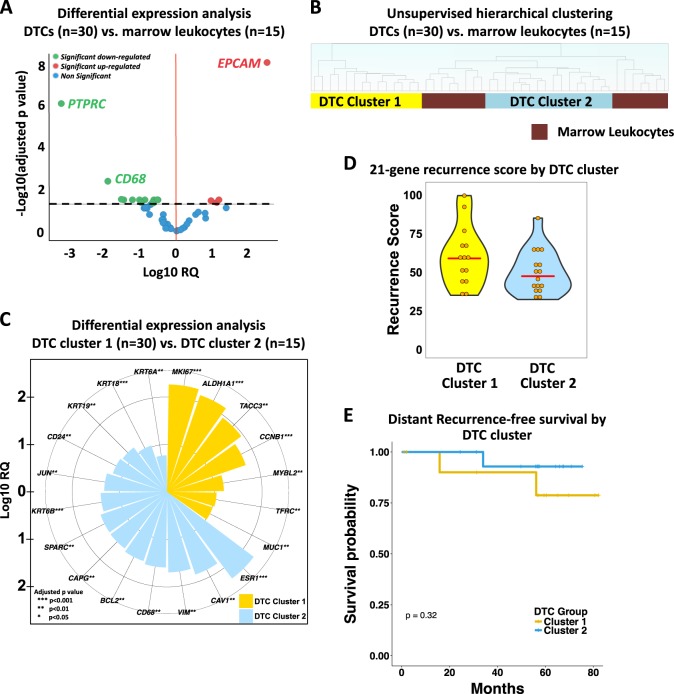
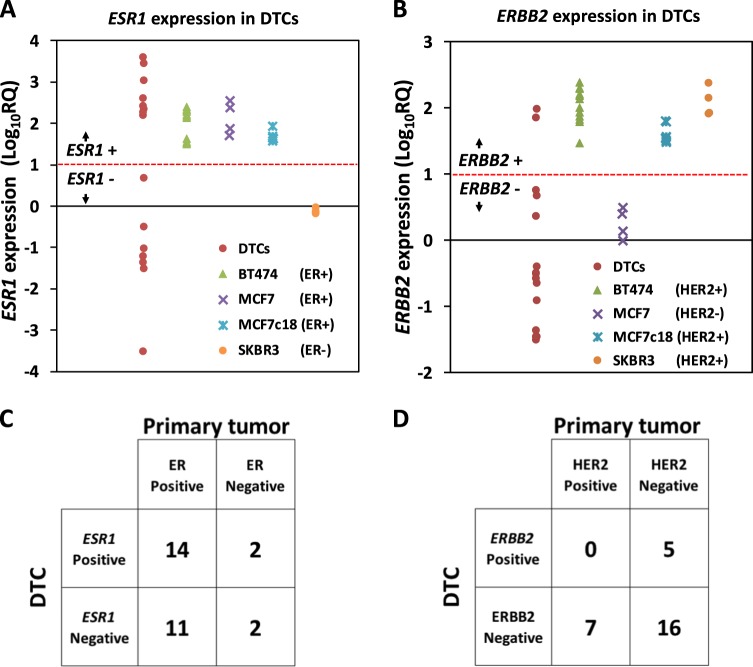
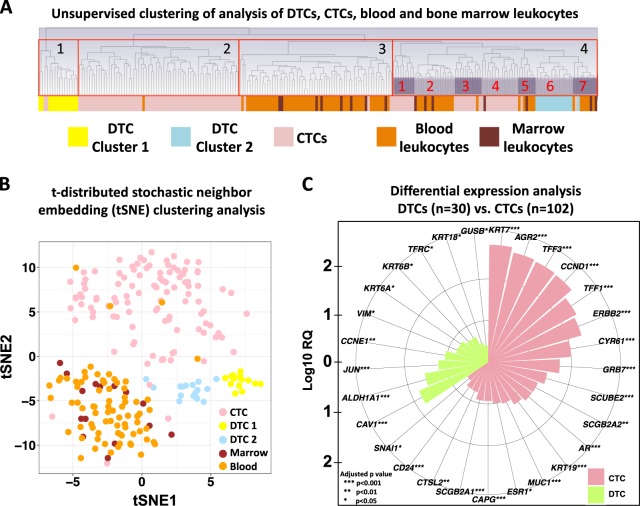
Detection of disseminated tumor cells (DTCs) in bone marrow is an established negative prognostic factor. We isolated small pools of (~20) EPCAM-positive DTCs from early breast cancer patients for genomic profiling. Genome-wide copy number profiles of DTC pools (n = 45) appeared less aberrant than the corresponding primary tumors (PT, n = 16). PIK3CA mutations were detected in 26% of DTC pools (n = 53), none of them were shared with matched PTs. Expression profiling of DTC pools (n = 30) confirmed the upregulation of EPCAM expression and certain oncogenes (e.g., MYC and CCNE1), as well as the absence of hematopoietic features. Two expression subtypes were observed: (1) luminal with dual epithelial-mesenchymal properties (high ESR1 and VIM/CAV1 expression), and (2) basal-like with proliferative/stem cell-like phenotype (low ESR1 and high MKI67/ALDH1A1 expression). We observed high discordance between ESR1 (40%) and ERRB2 (43%) expression in DTC pools vs. the clinical ER and HER2 status of the corresponding primary tumors, suggesting plasticity of biomarker status during dissemination to the bone marrow. Comparison of expression profiles of DTC pools with available data from circulating tumor cells (CTCs) of metastatic breast cancer patients revealed gene expression signatures in DTCs that were unique from those of CTCs. For example, ALDH1A1, CAV1, and VIM were upregulated in DTC pools relative to CTCs. Taken together, analysis of pooled DTCs revealed molecular heterogeneity, possible genetic divergence from corresponding primary tumor, and two distinct subpopulations. Validation in larger cohorts is needed to confirm the presence of these molecular subtypes and to evaluate their biological and clinical significance.


Conflict of interest statement

The authors declare no competing interests.

Figures

Fig. 1
Fig. 1
DTCs from bone marrow of early breast cancer patients were enumerated and isolated for downstream molecular profiling. a Enumeration and isolation of DTCs using a two-step process involving immunomagnetic enrichment and flow cytometry or fluorescence-activated cell sorting (IE/FACS). b Clinical characteristics of 71 patients from whom DTCs were enumerated. Each column represents a patient. cd Comparison of DTC/mL between groups based on patient treatment and nodal status (also see Supplementary Fig. 1 for extended analysis)
Fig. 2
Fig. 2
DTCs appear to have less genomic aberrations vs. matched primary tumors. a Frequency plot of clone-wise comparisons of archival tumors available from 16 patients (15 primary tumors and 1 lymph node) vs. DTCs (n = 45). Red and blue horizontal lines depict frequency of gain and loss, respectively. b Comparison of the extent of genomic aberrations in DTCs vs. primary tumors (PT). The p-values shown were calculated from fitting a linear model with the log-transformed fraction of genome gained (or lost or altered) as the response variable and sample type as the predictor variable along with patient ID as a covariate. c Heatmap based on gain/loss status using Euclidean distance and Ward agglomeration method. Columns represent samples. Chromosomes 1–22 are ordered from bottom to top (rows). Red, blue, and yellow dots represent gain, loss, and amplification, respectively. The yellow box indicates loss of chromosome 19, which is observed predominantly in the right cluster, and appears to drive cluster separation
Fig. 3
Fig. 3
PIK3CA mutations can be detected in DTCs. a Sanger sequencing traces from cell lines used for assay optimization. Positive controls, MCF7 and BT20 carry mutations E545K (Exon 9) and H1047R (Exon 20), respectively, but not the negative control BT474 cells. b Representative Sanger sequencing traces depicting mutations detected in DTCs from five patients. c Summary of sequencing data from DTCs, primary tumors, and a lymph node (LN) with at least one mutation detected. The complete list of patients screened for PIK3CA mutations and corresponding sequencing results are found in Supplementary Table 4
Fig. 4
Fig. 4
Gene expression analysis reveals two groups of DTCs with distinct expression profiles. a Volcano plot showing differentially expressed genes between DTCs and marrow leukocytes. Genes with an adjusted p-value < 0.05 (black dashed line) were considered statistically significant. Relative quantification (RQ) is reported in the logarithmic scale (log10 RQ = log10^2-∆∆CT). A Log10 RQ = 1 or −1 means a gene is expressed 10 times or 1/10 as much, respectively, in DTCs relative to marrow leukocyte samples. b Unsupervised hierarchical clustering analysis of DTCs (n = 30) and CD45-positive marrow leukocytes (n = 15) isolated by IE/FACS. c A rose plot showing genes upregulated in DTCs in cluster 1 (yellow) and cluster 2 (blue). d Violin plot of the 21-gene recurrence scores derived from DTC gene expression data from aQPCR analysis. The red line indicates the median. e Kaplan–Meier analysis for recurrence-free survival between patients whose DTCs belong to cluster 1 vs. cluster 2
Fig. 5
Fig. 5
ESR1/ER and ERBB2/HER2 status in DTCs and matched primary tumors show high discordance. a ESR1 and b ERBB2 expression in DTCs and breast cancer cell lines with known ER and HER2 status, respectively. The red dashed lines indicate the selected cut-off for positivity (Log10 RQ = 1); two-by-two contingency tables showing agreement in c ESR1 and ER status and d ERBB2 and HER2 status in DTCs vs. matched primary tumors
Fig. 6
Fig. 6
DTCs and CTCs exhibit expression profiles that are unique from each other. a Unsupervised hierarchical clustering analysis of CTCs (n = 105) and DTCs (n = 30) along with matched blood leukocytes (n = 76) and marrow leukocytes (n = 15). b t-SNE analysis to determine clusters based on similarities in gene expression. c A rose plot showing genes upregulated in DTCs and CTCs. Genes with an adjusted p-value < 0.05 were considered statistically significant. Relative quantification (RQ) is reported in the logarithmic scale (log10 RQ = log10^2-∆∆CT). A Log10 RQ = 1 or −1 means a gene is expressed 10 times or 1/10 as much, respectively

Similar articles

Cited by

References

    1. Magbanua MJ, Das R, Polavarapu P, Park JW. Approaches to isolation and molecular characterization of disseminated tumor cells. Oncotarget. 2015;6:30715–30729. doi: 10.18632/oncotarget.5568. - DOI - PMC - PubMed
    1. Hartkopf AD, Wallwiener M, Kommoss S, Taran FA, Brucker SY. Detection of disseminated tumor cells from the bone marrow of patients with early breast cancer is associated with high 21-gene recurrence score. Breast Cancer Res. Treat. 2016;156:91–95. doi: 10.1007/s10549-016-3728-9. - DOI - PubMed
    1. Kasimir-Bauer S, et al. Does primary neoadjuvant systemic therapy eradicate minimal residual disease? Analysis of disseminated and circulating tumor cells before and after therapy. Breast Cancer Res. 2016;18:20. doi: 10.1186/s13058-016-0679-3. - DOI - PMC - PubMed
    1. Braun S, et al. A pooled analysis of bone marrow micrometastasis in breast cancer. N. Engl. J. Med. 2005;353:793–802. doi: 10.1056/NEJMoa050434. - DOI - PubMed
    1. Braun S, et al. Cytokeratin-positive cells in the bone marrow and survival of patients with stage I, II, or III breast cancer. N. Engl. J. Med. 2000;342:525–533. doi: 10.1056/NEJM200002243420801. - DOI - PubMed