

Review
doi: 10.1097/RCT.0000000000000790.
Current Update on Desmoid Fibromatosis
Affiliations
- PMID: 30211798
- PMCID: PMC6331223
- DOI: 10.1097/RCT.0000000000000790
Item in Clipboard
Review
Current Update on Desmoid Fibromatosis
J Comput Assist Tomogr.
2019 Jan-Feb.
Abstract
Objective: The purpose of this article is to review the etiopathogenesis, molecular cytogenetics, histopathology, clinical features, and multimodality imaging features of desmoid fibromatosis. Recent advances in the management of desmoid fibromatosis will also be discussed.
Conclusions: Desmoid fibromatosis is a rare soft tissue neoplasm with a high incidence of local recurrence. Imaging plays an important role in the diagnosis and management of this disease.
Conflict of interest statement
Conflicts of Interest: None declared
Figures

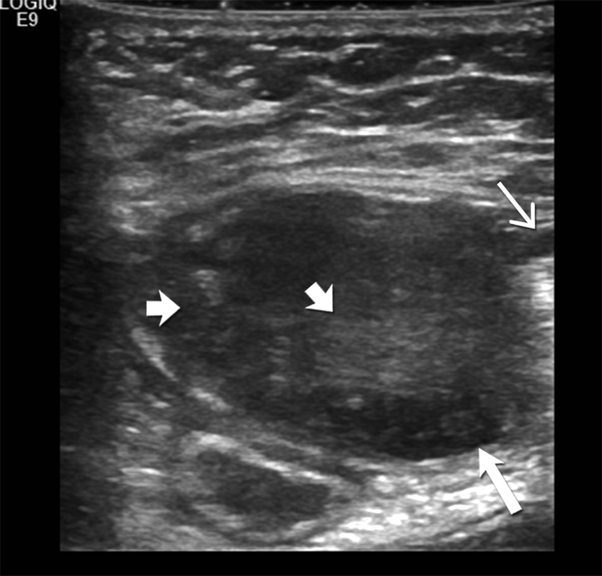
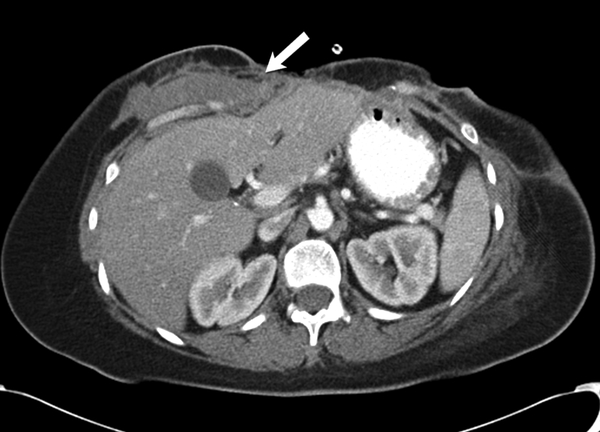
18-year-old-woman with abdominal wall desmoid fibromatosis (A) Axial contrast enhanced CT shows a 3.5 cm well defined lobulated, moderately enhancing, soft tissue mass (open arrow) in the left abdominal wall involving the rectus muscle. The patient had history of abdominal surgery and this mass is seen adjacent to the midline surgical scar (closed arrow). (B)Transverse ultrasound image of the left abdominal wall shows a 3.5 cm heteregenous hypoechoic mass mass (large open arrow) in the left abdominal wall involving the rectus muscle. Hyperechoic foci (short open arrows) are seen within the mass, likley reflecting fibrous collagenous bands. Note the sun-burst like linear extension seen along the fascial plane (closed arrow).
18-year-old-woman with abdominal wall desmoid fibromatosis (A) Axial contrast enhanced CT shows a 3.5 cm well defined lobulated, moderately enhancing, soft tissue mass (open arrow) in the left abdominal wall involving the rectus muscle. The patient had history of abdominal surgery and this mass is seen adjacent to the midline surgical scar (closed arrow). (B)Transverse ultrasound image of the left abdominal wall shows a 3.5 cm heteregenous hypoechoic mass mass (large open arrow) in the left abdominal wall involving the rectus muscle. Hyperechoic foci (short open arrows) are seen within the mass, likley reflecting fibrous collagenous bands. Note the sun-burst like linear extension seen along the fascial plane (closed arrow).
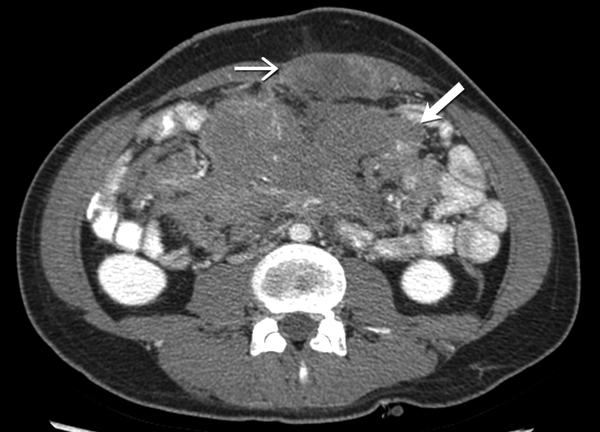
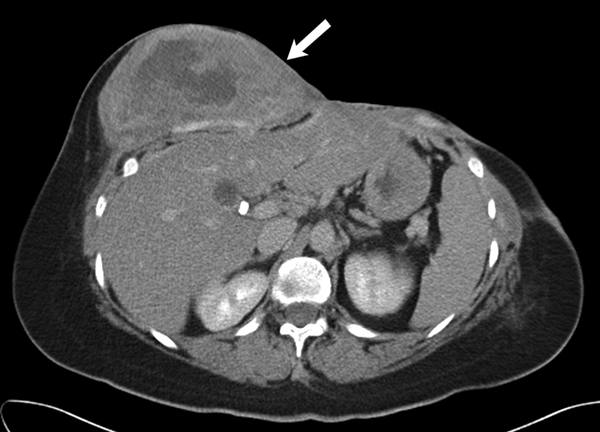
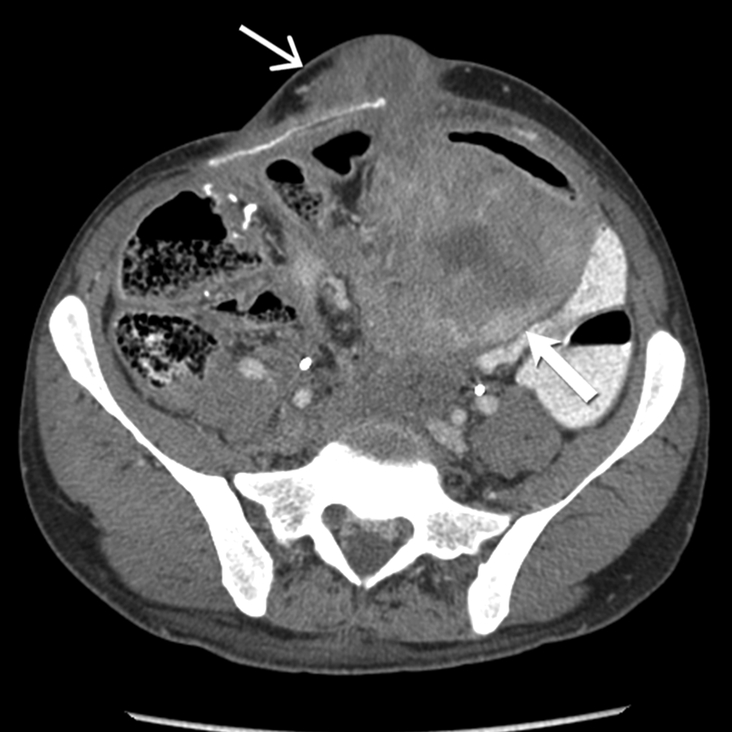
31-year-old man with mesenteric and abdominal wall desmoid fibromatosis Axial contrast enhanced CT shows a large, heterogeneous, mild to moderately enhancing infiltrative soft tissue mass (open arrow) in the mesentery encasing the mesenteric vessels. There is also a lobulated hypovascular soft tissue mass (closed arrow) in the left abdominal wall. Patient had history of familial adenomatosis polyposis. Biopsy of the abdominal wall mass confirmed the diagnosis of desmoid fibromatosis.
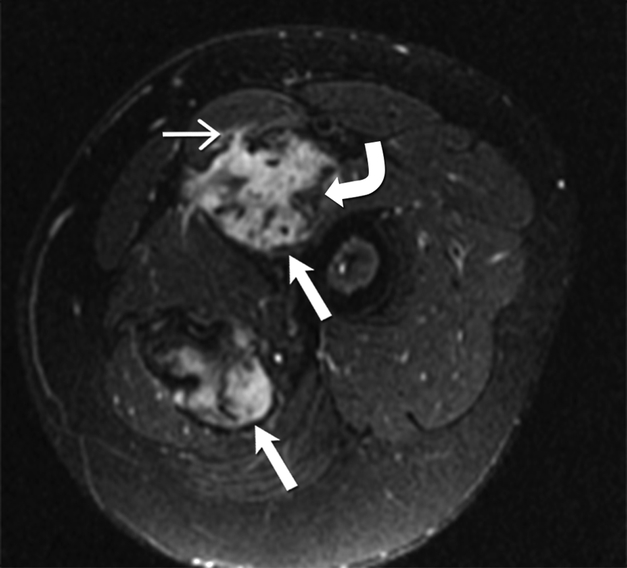
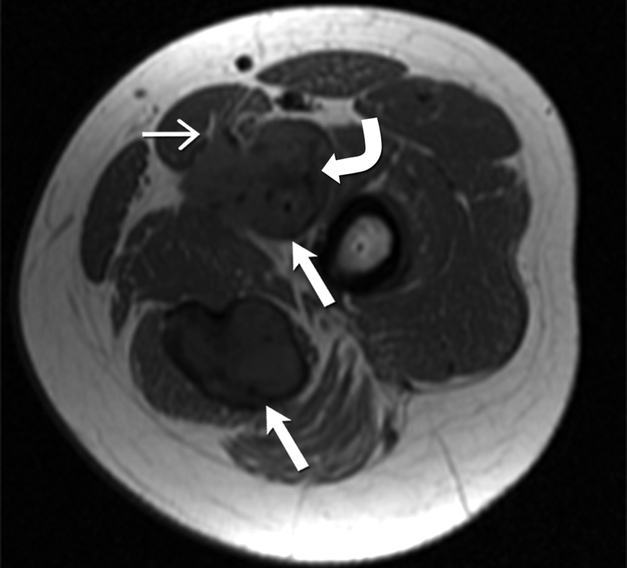
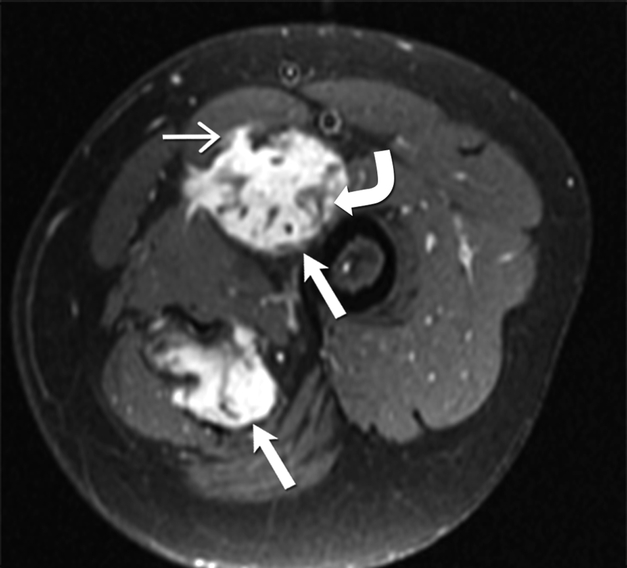
24-year-old-man with desmoid fibromatosis. (A) Axial T2 weighted MR of left thigh shows two heterogeneous high signal intensity soft tissue masses (straight open arrows) in the intermuscular compartment in the left thigh. Bands of linear low T2 signal intensity are seen within the tumor (curved arrow), reflecting the presence of collagen and low cellularity. Linear extensions are also seen extending from the periphery of the mass along the fascia (straight closed arrow). (B)Axial T1 weighted MR of the left thigh shows two heterogeneous soft tissue masses (straight open arrows) in the intermuscular compartment in the left thigh, which are isointense to the skeletal muscle. Bands of linear low T1 signal intensity are seen within the tumor (curved arrow), reflecting the presence of collagen and low cellularity. Linear extensions are also seen extending from the periphery of the mass along the fascia (straight closed arrow). (C) Axial post contrast T1 weighted MR of the left thigh shows two heterogeneous enhancing soft tissue masses (straight open arrows) in the intermuscular compartment in the left thigh. Avid enhancement within the mass reflects areas of high cellularity within the tumor. However, non-enhancing linear bands of low signal intensity are seen within the tumor (curved arrow), reflecting the presence of collagen bands. Linear extensions are also seen extending from the periphery of the mass along the fascia (straight closed arrow).
24-year-old-man with desmoid fibromatosis. (A) Axial T2 weighted MR of left thigh shows two heterogeneous high signal intensity soft tissue masses (straight open arrows) in the intermuscular compartment in the left thigh. Bands of linear low T2 signal intensity are seen within the tumor (curved arrow), reflecting the presence of collagen and low cellularity. Linear extensions are also seen extending from the periphery of the mass along the fascia (straight closed arrow). (B)Axial T1 weighted MR of the left thigh shows two heterogeneous soft tissue masses (straight open arrows) in the intermuscular compartment in the left thigh, which are isointense to the skeletal muscle. Bands of linear low T1 signal intensity are seen within the tumor (curved arrow), reflecting the presence of collagen and low cellularity. Linear extensions are also seen extending from the periphery of the mass along the fascia (straight closed arrow). (C) Axial post contrast T1 weighted MR of the left thigh shows two heterogeneous enhancing soft tissue masses (straight open arrows) in the intermuscular compartment in the left thigh. Avid enhancement within the mass reflects areas of high cellularity within the tumor. However, non-enhancing linear bands of low signal intensity are seen within the tumor (curved arrow), reflecting the presence of collagen bands. Linear extensions are also seen extending from the periphery of the mass along the fascia (straight closed arrow).
24-year-old-man with desmoid fibromatosis. (A) Axial T2 weighted MR of left thigh shows two heterogeneous high signal intensity soft tissue masses (straight open arrows) in the intermuscular compartment in the left thigh. Bands of linear low T2 signal intensity are seen within the tumor (curved arrow), reflecting the presence of collagen and low cellularity. Linear extensions are also seen extending from the periphery of the mass along the fascia (straight closed arrow). (B)Axial T1 weighted MR of the left thigh shows two heterogeneous soft tissue masses (straight open arrows) in the intermuscular compartment in the left thigh, which are isointense to the skeletal muscle. Bands of linear low T1 signal intensity are seen within the tumor (curved arrow), reflecting the presence of collagen and low cellularity. Linear extensions are also seen extending from the periphery of the mass along the fascia (straight closed arrow). (C) Axial post contrast T1 weighted MR of the left thigh shows two heterogeneous enhancing soft tissue masses (straight open arrows) in the intermuscular compartment in the left thigh. Avid enhancement within the mass reflects areas of high cellularity within the tumor. However, non-enhancing linear bands of low signal intensity are seen within the tumor (curved arrow), reflecting the presence of collagen bands. Linear extensions are also seen extending from the periphery of the mass along the fascia (straight closed arrow).
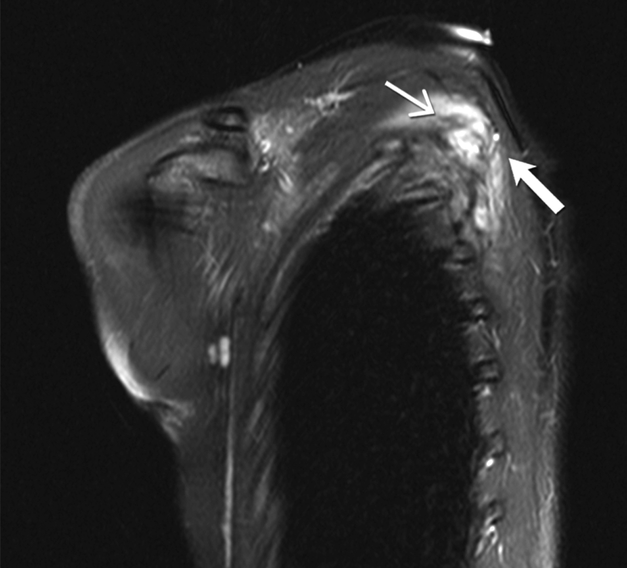
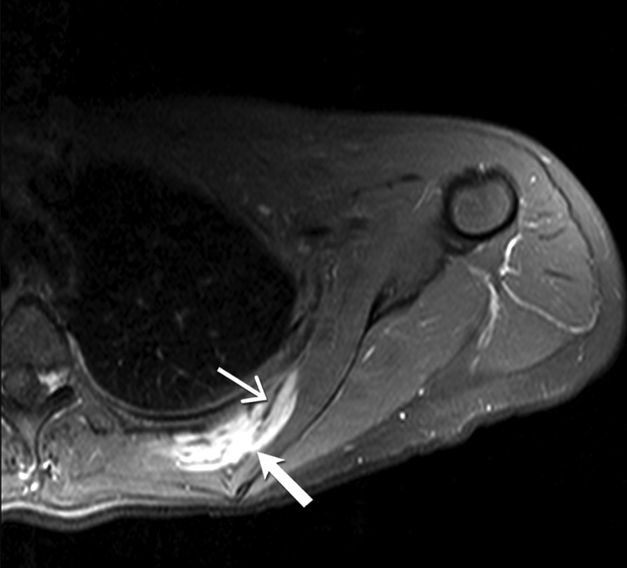
27-year-old woman with desmoid fibromatosis. (A) Coronal fat suppressed T2 weighted image of the left scapula shows an infiltrative 10 × 6 × 3 cm mass (open arrow) lying between the left subscapularis and left posterior ribs. Linear low signal intensity bands ( closed arrow) are seen within the mass, consistent with band sign (B) Axial fat suppressed post contrast enhanced T1 weighted image of the left scapula shows an infiltrative enhancing mass (open arrow) lying between the left subscapularis and left posterior ribs. Linear non—enhancing low signal intensity bands ( closed arrow) are seen within the mass, consistent with band sign (C) Sagittal fat suppressed post contrast enhanced T1 weighted image of the left scapula shows an infiltrative enhancing mass (open arrow) lying between the left subscapularis and left posterior ribs. Linear non-enhancing low signal intensity bands (closed arrow) are seen within the mass, consistent with band sign. Patient had significant pan in this left shoulder and scapular region, and hence this was surgically resected.
27-year-old woman with desmoid fibromatosis. (A) Coronal fat suppressed T2 weighted image of the left scapula shows an infiltrative 10 × 6 × 3 cm mass (open arrow) lying between the left subscapularis and left posterior ribs. Linear low signal intensity bands ( closed arrow) are seen within the mass, consistent with band sign (B) Axial fat suppressed post contrast enhanced T1 weighted image of the left scapula shows an infiltrative enhancing mass (open arrow) lying between the left subscapularis and left posterior ribs. Linear non—enhancing low signal intensity bands ( closed arrow) are seen within the mass, consistent with band sign (C) Sagittal fat suppressed post contrast enhanced T1 weighted image of the left scapula shows an infiltrative enhancing mass (open arrow) lying between the left subscapularis and left posterior ribs. Linear non-enhancing low signal intensity bands (closed arrow) are seen within the mass, consistent with band sign. Patient had significant pan in this left shoulder and scapular region, and hence this was surgically resected.

27-year-old woman with desmoid fibromatosis. (A) Coronal fat suppressed T2 weighted image of the left scapula shows an infiltrative 10 × 6 × 3 cm mass (open arrow) lying between the left subscapularis and left posterior ribs. Linear low signal intensity bands ( closed arrow) are seen within the mass, consistent with band sign (B) Axial fat suppressed post contrast enhanced T1 weighted image of the left scapula shows an infiltrative enhancing mass (open arrow) lying between the left subscapularis and left posterior ribs. Linear non—enhancing low signal intensity bands ( closed arrow) are seen within the mass, consistent with band sign (C) Sagittal fat suppressed post contrast enhanced T1 weighted image of the left scapula shows an infiltrative enhancing mass (open arrow) lying between the left subscapularis and left posterior ribs. Linear non-enhancing low signal intensity bands (closed arrow) are seen within the mass, consistent with band sign. Patient had significant pan in this left shoulder and scapular region, and hence this was surgically resected.
36 year old female with recurrent desmoid fibromatosis (A) Axial contrast enhanced CT of the chest shows a hypovascular infiltrative mass (arrow) in the right lower anterior chest wall. Patient had undergone two surgeries in the past for this recurrent tumor, as well as radiation therapy. The tumor had recurred for the third time locally in the site of surgical bed. (B) Axial contrast enhanced CT performed 18 months after the initial scan shows that the heterogeneous mass (arrow) had enlarged significantly and failed multiple lines of systemic therapy including tamoxifen, sulindac, and Adriamycin based chemotherapy. Given the increasing pain in this region and failed response to systemic therapy, surgical resection was performed
36 year old female with recurrent desmoid fibromatosis (A) Axial contrast enhanced CT of the chest shows a hypovascular infiltrative mass (arrow) in the right lower anterior chest wall. Patient had undergone two surgeries in the past for this recurrent tumor, as well as radiation therapy. The tumor had recurred for the third time locally in the site of surgical bed. (B) Axial contrast enhanced CT performed 18 months after the initial scan shows that the heterogeneous mass (arrow) had enlarged significantly and failed multiple lines of systemic therapy including tamoxifen, sulindac, and Adriamycin based chemotherapy. Given the increasing pain in this region and failed response to systemic therapy, surgical resection was performed
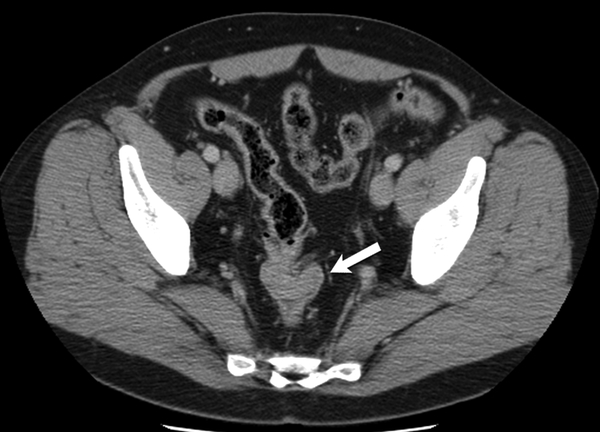
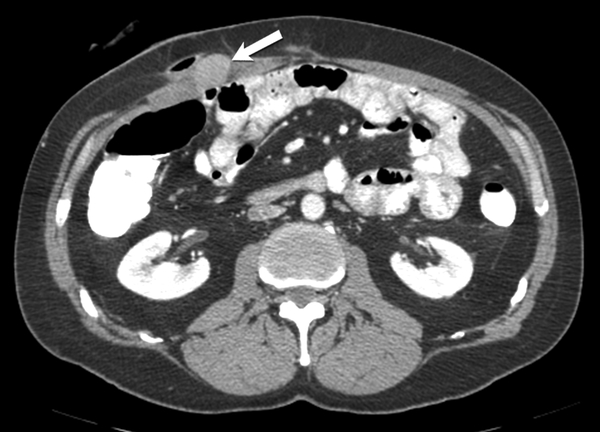
47-year-old man with familial adenomatosis polyposis (A) Axial contrast enhanced CT of the abdomen shows enhancing circumferential rectal tumor (arrow in A). Biopsy confirmed rectal adenocarcinoma. Patient underwent low anterior resection and diverting ileostomy. (B) Axial CT scan of the abdomen performed 4 months after surgery shows a 2 cm soft tissue mass in the right abdominal wall near the ileostomy surgical scar. Biopsy of the abdominal wall mass confirmed the diagnosis of desmoid fibromatosis.
47-year-old man with familial adenomatosis polyposis (A) Axial contrast enhanced CT of the abdomen shows enhancing circumferential rectal tumor (arrow in A). Biopsy confirmed rectal adenocarcinoma. Patient underwent low anterior resection and diverting ileostomy. (B) Axial CT scan of the abdomen performed 4 months after surgery shows a 2 cm soft tissue mass in the right abdominal wall near the ileostomy surgical scar. Biopsy of the abdominal wall mass confirmed the diagnosis of desmoid fibromatosis.
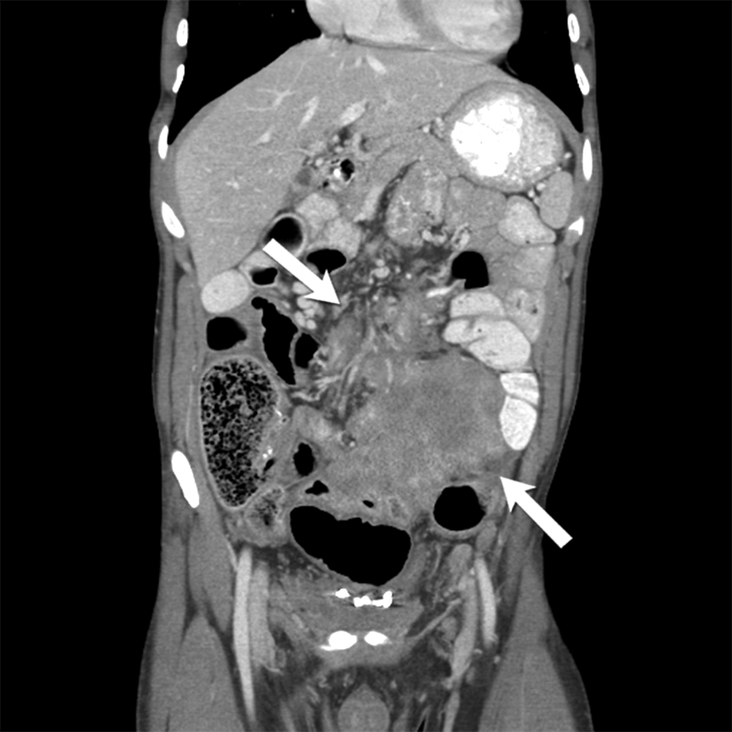
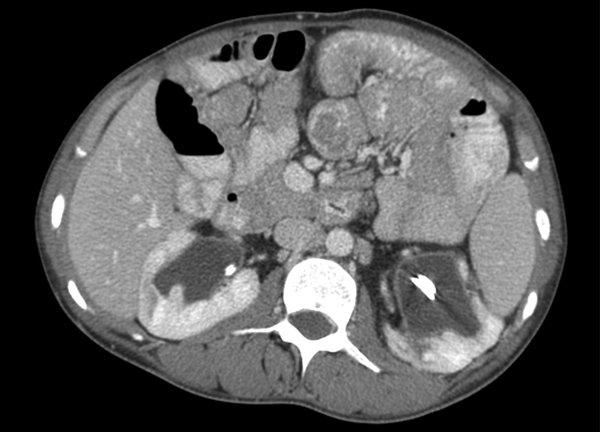
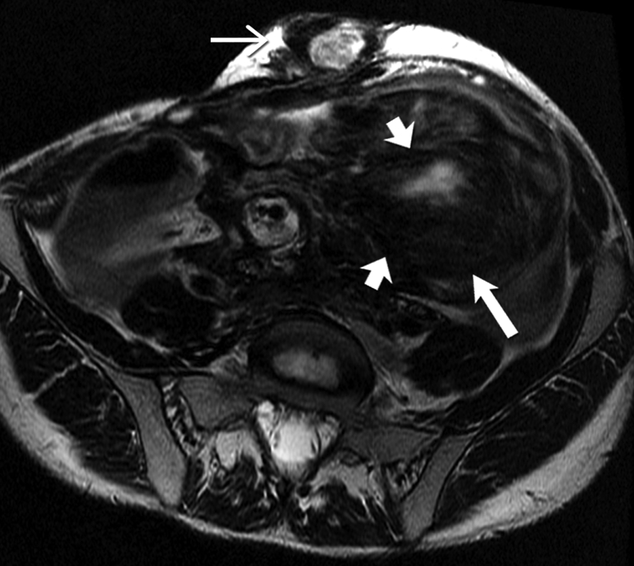
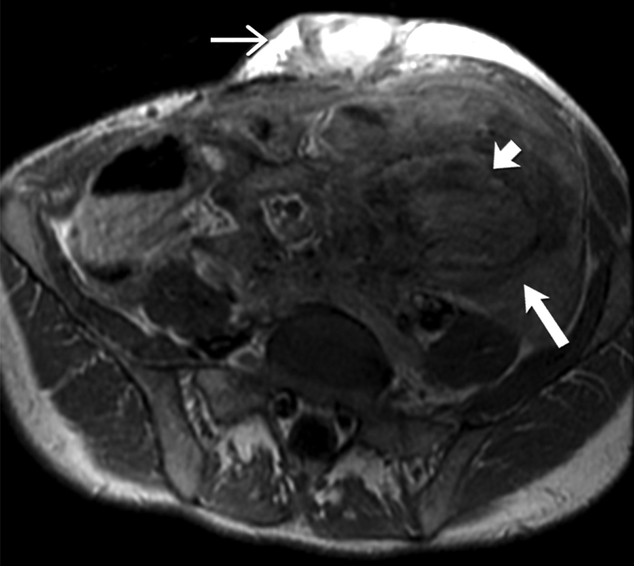
26-year-old man with familial adenomatosis polyposis and desmoid fibromatosis (A) Coronal contrast enhanced T1 weighted image shows a large infiltrative mass in the root of mesentery encasing the major vascular structures and infiltrating the adjacent bowel loops. Mildly dilated small bowel loops are seen. Patient had partial small bowel obstruction. (B) Axial contrast enhanced CT of the abdomen shows the heterogeneous mesenteric tumor (open arrow). Patient had history of rectal cancer which was treated with low anterior resection and had also undergone prior mesh repair of ventral hernia. Note the heterogeneous abdominal wall mass (close arrow) seen along the site of surgical scar, adjacent to abdominal wall mesh. (C) Axial contrast enhanced CT of the upper abdomen shows bilateral hydronephrosis secondary to ureteric obstruction by the infiltrative mesenteric mass. Bilateral ureteral stents are in situ. (D) Axial T2 weighted MR of the abdomen shows heterogeneous mesenteric mass (long open arrow) with numerous linear bands (short open arrow) of low signal intensity and central areas of high signal intensity. The abdominal wall mass (close arrow) shows similar signal intensity characteristics (E) Axial post contrast enhanced T1 weighted MR of the abdomen shows enhancement within the cellular areas of the heterogeneous mesenteric mass (long open arrow). Non-enhancing linear bands of low signal intensity reflecting collagen bands (short open arrow) are also seen within the tumor. The abdominal wall mass (close arrow) shows similar enhancement characteristics. (F) Axial high B value diffusion weighted MR of the abdomen shows only mild restricted diffusion in the central portions of the mesenteric tumor (open arrow) and abdominal wall mass (close arrow) corresponding to the cellular areas of the tumor. In general, MR signal intensity characteristics of desmoid fibromatosis reflect the histological and cellular components of the tumor. Highly cellular areas of the tumor tend to be T2 hyperintense, demonstrate avid enhancement and are associated with restricted diffusion. In contrast, collagen bands and fibrous, hypocellular portions of the tumor tend to be T2 hypointense, demonstrate poor enhancement and do not restrict diffusion.
26-year-old man with familial adenomatosis polyposis and desmoid fibromatosis (A) Coronal contrast enhanced T1 weighted image shows a large infiltrative mass in the root of mesentery encasing the major vascular structures and infiltrating the adjacent bowel loops. Mildly dilated small bowel loops are seen. Patient had partial small bowel obstruction. (B) Axial contrast enhanced CT of the abdomen shows the heterogeneous mesenteric tumor (open arrow). Patient had history of rectal cancer which was treated with low anterior resection and had also undergone prior mesh repair of ventral hernia. Note the heterogeneous abdominal wall mass (close arrow) seen along the site of surgical scar, adjacent to abdominal wall mesh. (C) Axial contrast enhanced CT of the upper abdomen shows bilateral hydronephrosis secondary to ureteric obstruction by the infiltrative mesenteric mass. Bilateral ureteral stents are in situ. (D) Axial T2 weighted MR of the abdomen shows heterogeneous mesenteric mass (long open arrow) with numerous linear bands (short open arrow) of low signal intensity and central areas of high signal intensity. The abdominal wall mass (close arrow) shows similar signal intensity characteristics (E) Axial post contrast enhanced T1 weighted MR of the abdomen shows enhancement within the cellular areas of the heterogeneous mesenteric mass (long open arrow). Non-enhancing linear bands of low signal intensity reflecting collagen bands (short open arrow) are also seen within the tumor. The abdominal wall mass (close arrow) shows similar enhancement characteristics. (F) Axial high B value diffusion weighted MR of the abdomen shows only mild restricted diffusion in the central portions of the mesenteric tumor (open arrow) and abdominal wall mass (close arrow) corresponding to the cellular areas of the tumor. In general, MR signal intensity characteristics of desmoid fibromatosis reflect the histological and cellular components of the tumor. Highly cellular areas of the tumor tend to be T2 hyperintense, demonstrate avid enhancement and are associated with restricted diffusion. In contrast, collagen bands and fibrous, hypocellular portions of the tumor tend to be T2 hypointense, demonstrate poor enhancement and do not restrict diffusion.
26-year-old man with familial adenomatosis polyposis and desmoid fibromatosis (A) Coronal contrast enhanced T1 weighted image shows a large infiltrative mass in the root of mesentery encasing the major vascular structures and infiltrating the adjacent bowel loops. Mildly dilated small bowel loops are seen. Patient had partial small bowel obstruction. (B) Axial contrast enhanced CT of the abdomen shows the heterogeneous mesenteric tumor (open arrow). Patient had history of rectal cancer which was treated with low anterior resection and had also undergone prior mesh repair of ventral hernia. Note the heterogeneous abdominal wall mass (close arrow) seen along the site of surgical scar, adjacent to abdominal wall mesh. (C) Axial contrast enhanced CT of the upper abdomen shows bilateral hydronephrosis secondary to ureteric obstruction by the infiltrative mesenteric mass. Bilateral ureteral stents are in situ. (D) Axial T2 weighted MR of the abdomen shows heterogeneous mesenteric mass (long open arrow) with numerous linear bands (short open arrow) of low signal intensity and central areas of high signal intensity. The abdominal wall mass (close arrow) shows similar signal intensity characteristics (E) Axial post contrast enhanced T1 weighted MR of the abdomen shows enhancement within the cellular areas of the heterogeneous mesenteric mass (long open arrow). Non-enhancing linear bands of low signal intensity reflecting collagen bands (short open arrow) are also seen within the tumor. The abdominal wall mass (close arrow) shows similar enhancement characteristics. (F) Axial high B value diffusion weighted MR of the abdomen shows only mild restricted diffusion in the central portions of the mesenteric tumor (open arrow) and abdominal wall mass (close arrow) corresponding to the cellular areas of the tumor. In general, MR signal intensity characteristics of desmoid fibromatosis reflect the histological and cellular components of the tumor. Highly cellular areas of the tumor tend to be T2 hyperintense, demonstrate avid enhancement and are associated with restricted diffusion. In contrast, collagen bands and fibrous, hypocellular portions of the tumor tend to be T2 hypointense, demonstrate poor enhancement and do not restrict diffusion.
26-year-old man with familial adenomatosis polyposis and desmoid fibromatosis (A) Coronal contrast enhanced T1 weighted image shows a large infiltrative mass in the root of mesentery encasing the major vascular structures and infiltrating the adjacent bowel loops. Mildly dilated small bowel loops are seen. Patient had partial small bowel obstruction. (B) Axial contrast enhanced CT of the abdomen shows the heterogeneous mesenteric tumor (open arrow). Patient had history of rectal cancer which was treated with low anterior resection and had also undergone prior mesh repair of ventral hernia. Note the heterogeneous abdominal wall mass (close arrow) seen along the site of surgical scar, adjacent to abdominal wall mesh. (C) Axial contrast enhanced CT of the upper abdomen shows bilateral hydronephrosis secondary to ureteric obstruction by the infiltrative mesenteric mass. Bilateral ureteral stents are in situ. (D) Axial T2 weighted MR of the abdomen shows heterogeneous mesenteric mass (long open arrow) with numerous linear bands (short open arrow) of low signal intensity and central areas of high signal intensity. The abdominal wall mass (close arrow) shows similar signal intensity characteristics (E) Axial post contrast enhanced T1 weighted MR of the abdomen shows enhancement within the cellular areas of the heterogeneous mesenteric mass (long open arrow). Non-enhancing linear bands of low signal intensity reflecting collagen bands (short open arrow) are also seen within the tumor. The abdominal wall mass (close arrow) shows similar enhancement characteristics. (F) Axial high B value diffusion weighted MR of the abdomen shows only mild restricted diffusion in the central portions of the mesenteric tumor (open arrow) and abdominal wall mass (close arrow) corresponding to the cellular areas of the tumor. In general, MR signal intensity characteristics of desmoid fibromatosis reflect the histological and cellular components of the tumor. Highly cellular areas of the tumor tend to be T2 hyperintense, demonstrate avid enhancement and are associated with restricted diffusion. In contrast, collagen bands and fibrous, hypocellular portions of the tumor tend to be T2 hypointense, demonstrate poor enhancement and do not restrict diffusion.
26-year-old man with familial adenomatosis polyposis and desmoid fibromatosis (A) Coronal contrast enhanced T1 weighted image shows a large infiltrative mass in the root of mesentery encasing the major vascular structures and infiltrating the adjacent bowel loops. Mildly dilated small bowel loops are seen. Patient had partial small bowel obstruction. (B) Axial contrast enhanced CT of the abdomen shows the heterogeneous mesenteric tumor (open arrow). Patient had history of rectal cancer which was treated with low anterior resection and had also undergone prior mesh repair of ventral hernia. Note the heterogeneous abdominal wall mass (close arrow) seen along the site of surgical scar, adjacent to abdominal wall mesh. (C) Axial contrast enhanced CT of the upper abdomen shows bilateral hydronephrosis secondary to ureteric obstruction by the infiltrative mesenteric mass. Bilateral ureteral stents are in situ. (D) Axial T2 weighted MR of the abdomen shows heterogeneous mesenteric mass (long open arrow) with numerous linear bands (short open arrow) of low signal intensity and central areas of high signal intensity. The abdominal wall mass (close arrow) shows similar signal intensity characteristics (E) Axial post contrast enhanced T1 weighted MR of the abdomen shows enhancement within the cellular areas of the heterogeneous mesenteric mass (long open arrow). Non-enhancing linear bands of low signal intensity reflecting collagen bands (short open arrow) are also seen within the tumor. The abdominal wall mass (close arrow) shows similar enhancement characteristics. (F) Axial high B value diffusion weighted MR of the abdomen shows only mild restricted diffusion in the central portions of the mesenteric tumor (open arrow) and abdominal wall mass (close arrow) corresponding to the cellular areas of the tumor. In general, MR signal intensity characteristics of desmoid fibromatosis reflect the histological and cellular components of the tumor. Highly cellular areas of the tumor tend to be T2 hyperintense, demonstrate avid enhancement and are associated with restricted diffusion. In contrast, collagen bands and fibrous, hypocellular portions of the tumor tend to be T2 hypointense, demonstrate poor enhancement and do not restrict diffusion.

26-year-old man with familial adenomatosis polyposis and desmoid fibromatosis (A) Coronal contrast enhanced T1 weighted image shows a large infiltrative mass in the root of mesentery encasing the major vascular structures and infiltrating the adjacent bowel loops. Mildly dilated small bowel loops are seen. Patient had partial small bowel obstruction. (B) Axial contrast enhanced CT of the abdomen shows the heterogeneous mesenteric tumor (open arrow). Patient had history of rectal cancer which was treated with low anterior resection and had also undergone prior mesh repair of ventral hernia. Note the heterogeneous abdominal wall mass (close arrow) seen along the site of surgical scar, adjacent to abdominal wall mesh. (C) Axial contrast enhanced CT of the upper abdomen shows bilateral hydronephrosis secondary to ureteric obstruction by the infiltrative mesenteric mass. Bilateral ureteral stents are in situ. (D) Axial T2 weighted MR of the abdomen shows heterogeneous mesenteric mass (long open arrow) with numerous linear bands (short open arrow) of low signal intensity and central areas of high signal intensity. The abdominal wall mass (close arrow) shows similar signal intensity characteristics (E) Axial post contrast enhanced T1 weighted MR of the abdomen shows enhancement within the cellular areas of the heterogeneous mesenteric mass (long open arrow). Non-enhancing linear bands of low signal intensity reflecting collagen bands (short open arrow) are also seen within the tumor. The abdominal wall mass (close arrow) shows similar enhancement characteristics. (F) Axial high B value diffusion weighted MR of the abdomen shows only mild restricted diffusion in the central portions of the mesenteric tumor (open arrow) and abdominal wall mass (close arrow) corresponding to the cellular areas of the tumor. In general, MR signal intensity characteristics of desmoid fibromatosis reflect the histological and cellular components of the tumor. Highly cellular areas of the tumor tend to be T2 hyperintense, demonstrate avid enhancement and are associated with restricted diffusion. In contrast, collagen bands and fibrous, hypocellular portions of the tumor tend to be T2 hypointense, demonstrate poor enhancement and do not restrict diffusion.
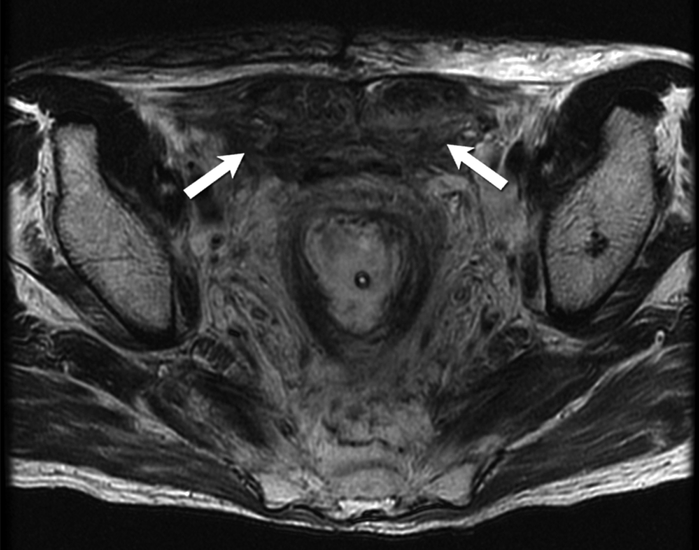
48-year-old man with familial adenomatosis polyposis and abdominal wall desmoid fibromatosis Axial T2 weighted MR image shows heterogeneous fusiform bilateral abdominal wall masses (arrows) containing T2-hyperintense and T2-hypointense areas.
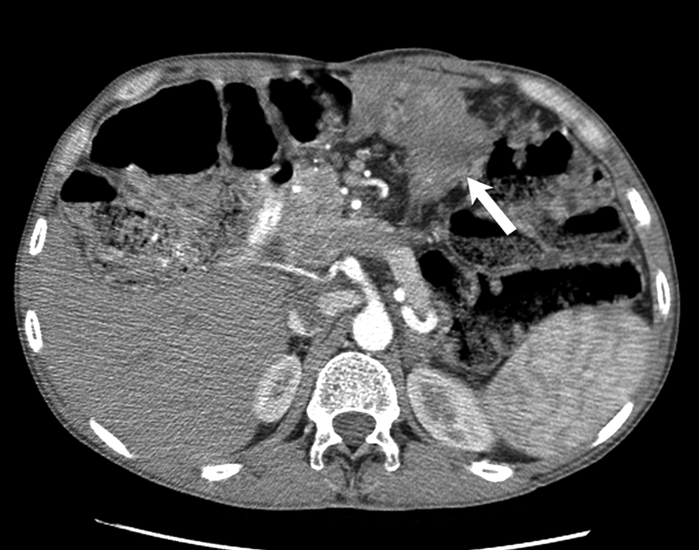
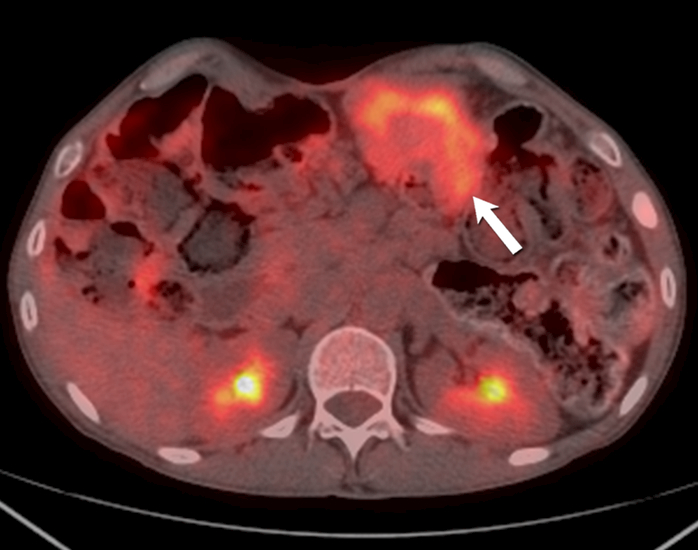
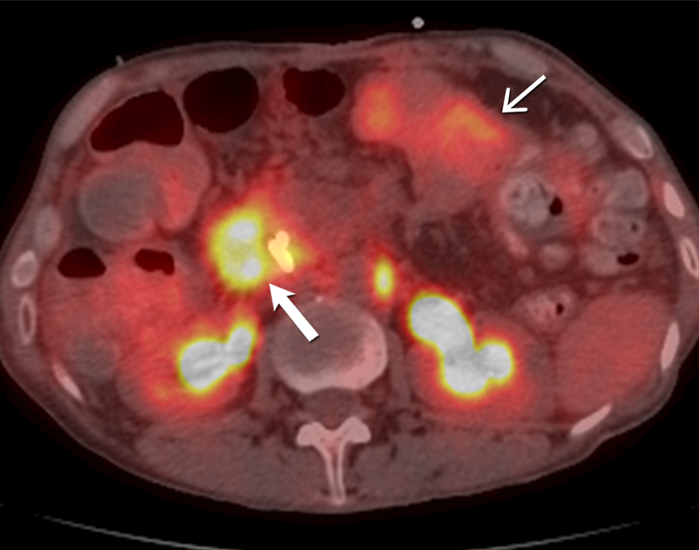
51-year-old- man with familial adenomatosis polyposis and desmoid fibromatosis (A) Axial contrast enhanced CT of abdomen shows large infiltrative mesenteric mass (arrow). (B) Axial fused PET CT shows only mild FDG uptake (SUVmax 4.2) in the mesenteric desmoid fibromatosis (arrow). Patient was asymptomatic and this was monitored during routine follow up for familial adenomatosis polyposis. Three years later, patient developed rapidly progressive metastatic rectal adenocarcinoma. (C) Axial contrast enhanced CT of abdomen performed 3 years later shows a new heterogeneous mass (arrow) involving the periampullary and duodenal region. In the interval period, patient had been diagnosed with metastatic rectal adenocarcinoma. Biopsy of the duodenal/ periampullary mass confirmed metastatic adenocarcinoma. (D) Axial fused PET CT of the abdomen shows markedly FDG avid (SUVmax 9.6) metastatic adenocarcinoma involving the periampullary and duodenal region (open arrow). In contrast, note the mesenteric desmoid fibromatosis (close arrow) has only mild FDG uptake (SUVmax 4.4).
51-year-old- man with familial adenomatosis polyposis and desmoid fibromatosis (A) Axial contrast enhanced CT of abdomen shows large infiltrative mesenteric mass (arrow). (B) Axial fused PET CT shows only mild FDG uptake (SUVmax 4.2) in the mesenteric desmoid fibromatosis (arrow). Patient was asymptomatic and this was monitored during routine follow up for familial adenomatosis polyposis. Three years later, patient developed rapidly progressive metastatic rectal adenocarcinoma. (C) Axial contrast enhanced CT of abdomen performed 3 years later shows a new heterogeneous mass (arrow) involving the periampullary and duodenal region. In the interval period, patient had been diagnosed with metastatic rectal adenocarcinoma. Biopsy of the duodenal/ periampullary mass confirmed metastatic adenocarcinoma. (D) Axial fused PET CT of the abdomen shows markedly FDG avid (SUVmax 9.6) metastatic adenocarcinoma involving the periampullary and duodenal region (open arrow). In contrast, note the mesenteric desmoid fibromatosis (close arrow) has only mild FDG uptake (SUVmax 4.4).

51-year-old- man with familial adenomatosis polyposis and desmoid fibromatosis (A) Axial contrast enhanced CT of abdomen shows large infiltrative mesenteric mass (arrow). (B) Axial fused PET CT shows only mild FDG uptake (SUVmax 4.2) in the mesenteric desmoid fibromatosis (arrow). Patient was asymptomatic and this was monitored during routine follow up for familial adenomatosis polyposis. Three years later, patient developed rapidly progressive metastatic rectal adenocarcinoma. (C) Axial contrast enhanced CT of abdomen performed 3 years later shows a new heterogeneous mass (arrow) involving the periampullary and duodenal region. In the interval period, patient had been diagnosed with metastatic rectal adenocarcinoma. Biopsy of the duodenal/ periampullary mass confirmed metastatic adenocarcinoma. (D) Axial fused PET CT of the abdomen shows markedly FDG avid (SUVmax 9.6) metastatic adenocarcinoma involving the periampullary and duodenal region (open arrow). In contrast, note the mesenteric desmoid fibromatosis (close arrow) has only mild FDG uptake (SUVmax 4.4).
51-year-old- man with familial adenomatosis polyposis and desmoid fibromatosis (A) Axial contrast enhanced CT of abdomen shows large infiltrative mesenteric mass (arrow). (B) Axial fused PET CT shows only mild FDG uptake (SUVmax 4.2) in the mesenteric desmoid fibromatosis (arrow). Patient was asymptomatic and this was monitored during routine follow up for familial adenomatosis polyposis. Three years later, patient developed rapidly progressive metastatic rectal adenocarcinoma. (C) Axial contrast enhanced CT of abdomen performed 3 years later shows a new heterogeneous mass (arrow) involving the periampullary and duodenal region. In the interval period, patient had been diagnosed with metastatic rectal adenocarcinoma. Biopsy of the duodenal/ periampullary mass confirmed metastatic adenocarcinoma. (D) Axial fused PET CT of the abdomen shows markedly FDG avid (SUVmax 9.6) metastatic adenocarcinoma involving the periampullary and duodenal region (open arrow). In contrast, note the mesenteric desmoid fibromatosis (close arrow) has only mild FDG uptake (SUVmax 4.4).
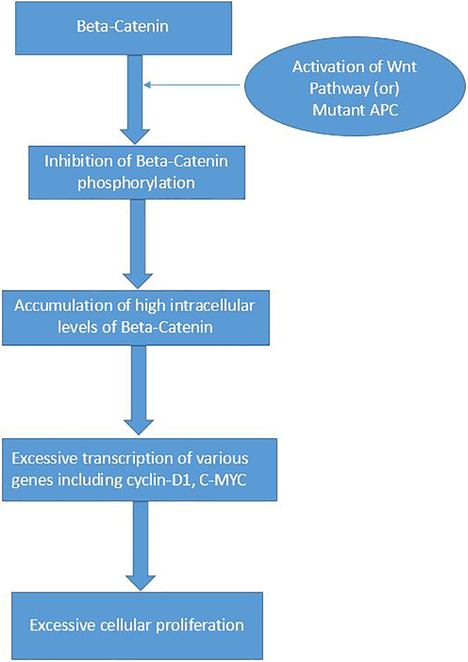
The Wnt-Beta-Catenin pathway in Desmoid Fibromatosis β-catenin molecule is normally located in the adherens junctions. Adenomatosis Polyposis Coli (APC) gene complex regulates the phosphorylation of β-catenin and its subsequent degradation in the proteasomes. When there is activation of Wnt (by its binding with its ligand) or there is mutation in the APC gene, it prevents the APC induced phosphorylation of the β-catenin. This results in excessive intracellular accumulation of β-catenin, which translocates to the nucleus and causes significant activation and transcription of various genes including Cyclin-D1 and C-MYC. In turn, this leads to a cascade of events resulting in excessive cell proliferation.
References
-
- Sakorafas GH, Nissotakis C, Peros G. Abdominal desmoid tumors. Surg Oncol 2007; 16:131–142 - PubMed
-
- Nieuwenhuis MH, Casparie M, Mathus-Vliegen LM, Dekkers OM, Hogendoorn PC, Vasen HF. A nation-wide study comparing sporadic and familial adenomatous polyposis-related desmoid-type fibromatoses. Int J Cancer 2011; 129:256–261 - PubMed
-
- Fiore M, MacNeill A, Gronchi A, Colombo C. Desmoid-Type Fibromatosis: Evolving Treatment Standards. Surg Oncol Clin N Am 2016; 25:803–826 - PubMed
-
- Martinez Trufero J, Pajares Bernad I, Torres Ramon I, Hernando Cubero J, Pazo Cid R. Desmoid-Type Fibromatosis: Who, When, and How to Treat. Curr Treat Options Oncol 2017; 18:29. - PubMed
Publication types
MeSH terms
Grants and funding
LinkOut - more resources
Full Text Sources
Other Literature Sources
Medical
