. 2018 Sep;126(9):97005.
doi: 10.1289/EHP3550.

Effects of the Endocrine-Disrupting Chemicals, Vinclozolin and Polychlorinated Biphenyls, on Physiological and Sociosexual Phenotypes in F2 Generation Sprague-Dawley Rats

Affiliations

Effects of the Endocrine-Disrupting Chemicals, Vinclozolin and Polychlorinated Biphenyls, on Physiological and Sociosexual Phenotypes in F2 Generation Sprague-Dawley Rats

Krittika Krishnan et al. Environ Health Perspect. 2018 Sep.

Abstract

Background: Exposure to endocrine-disrupting chemicals (EDCs) during gestation influences development of the F1 generation offspring and can result in disease and dysfunction in adulthood. Limited evidence suggests consequences on the F2 generation, exposed as germ cells within the F1 fetus. These F2s provide a unique window into the programming effects of EDCs.

Objective: This study assessed intergenerational effects of EDC exposure on adult physiology and behavior in Sprague-Dawley rats.

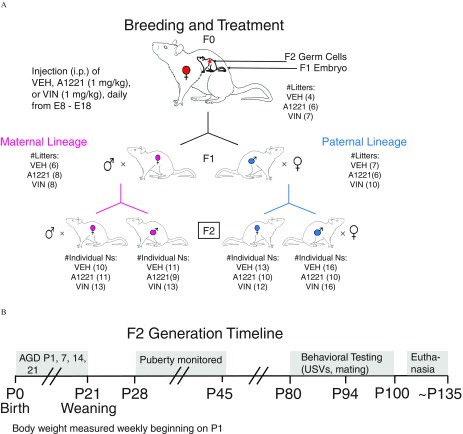
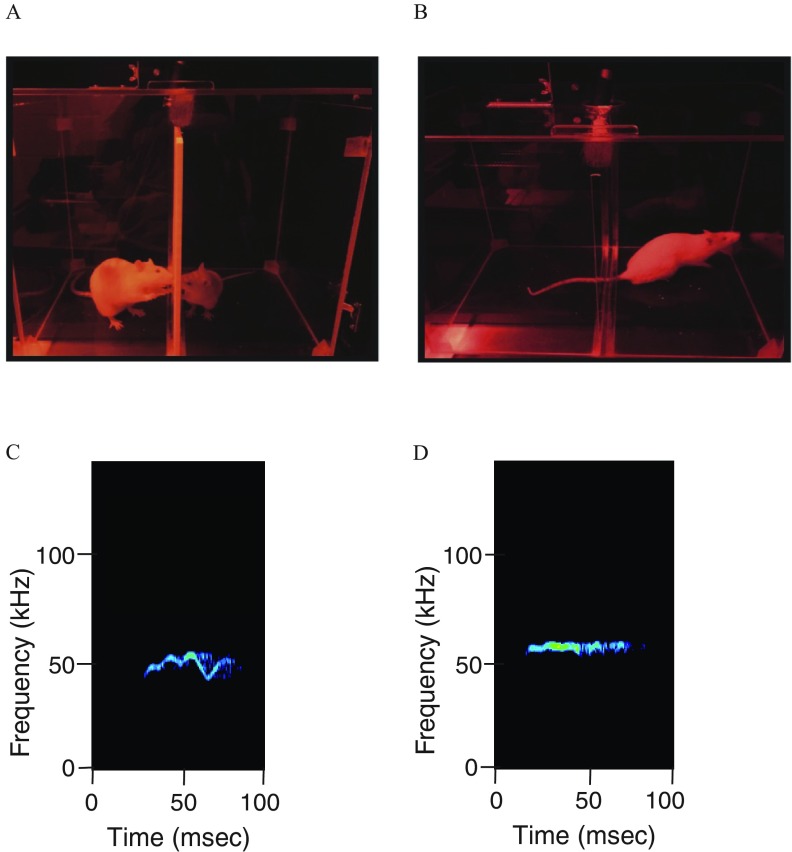
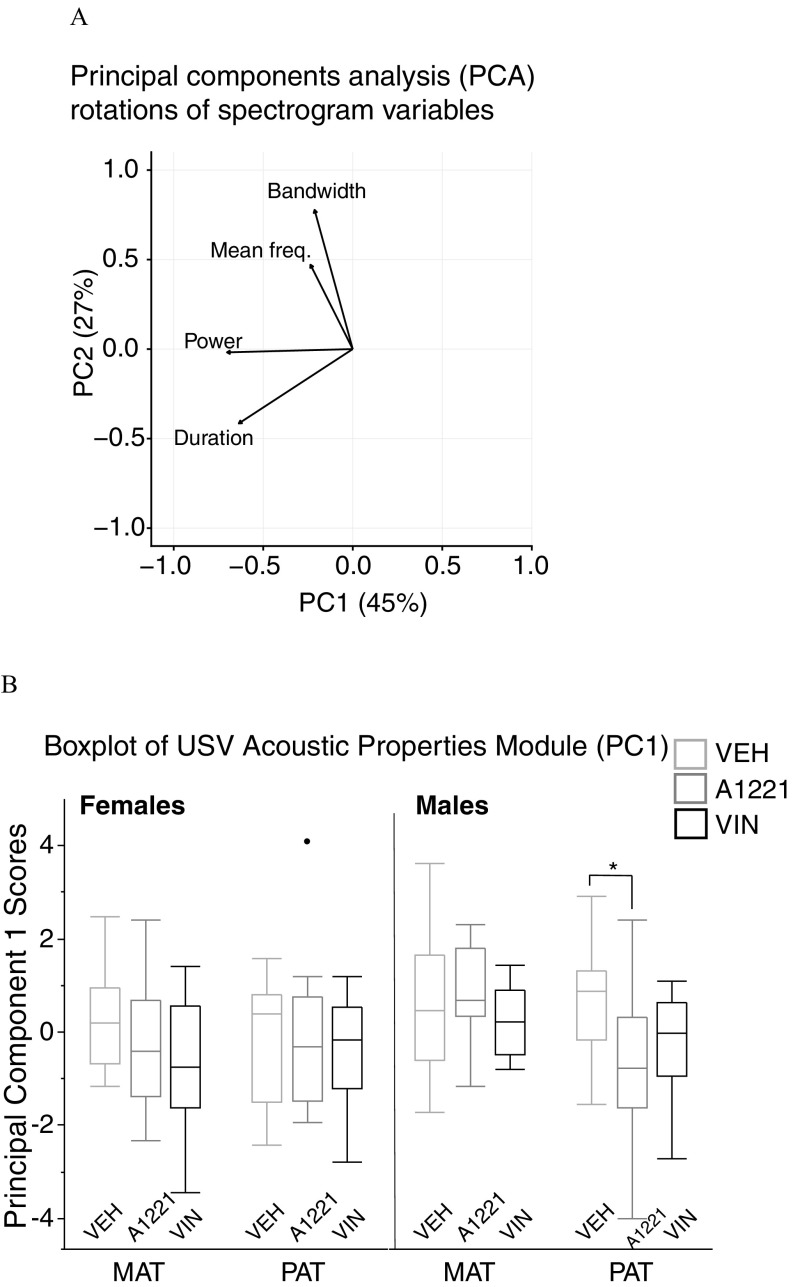
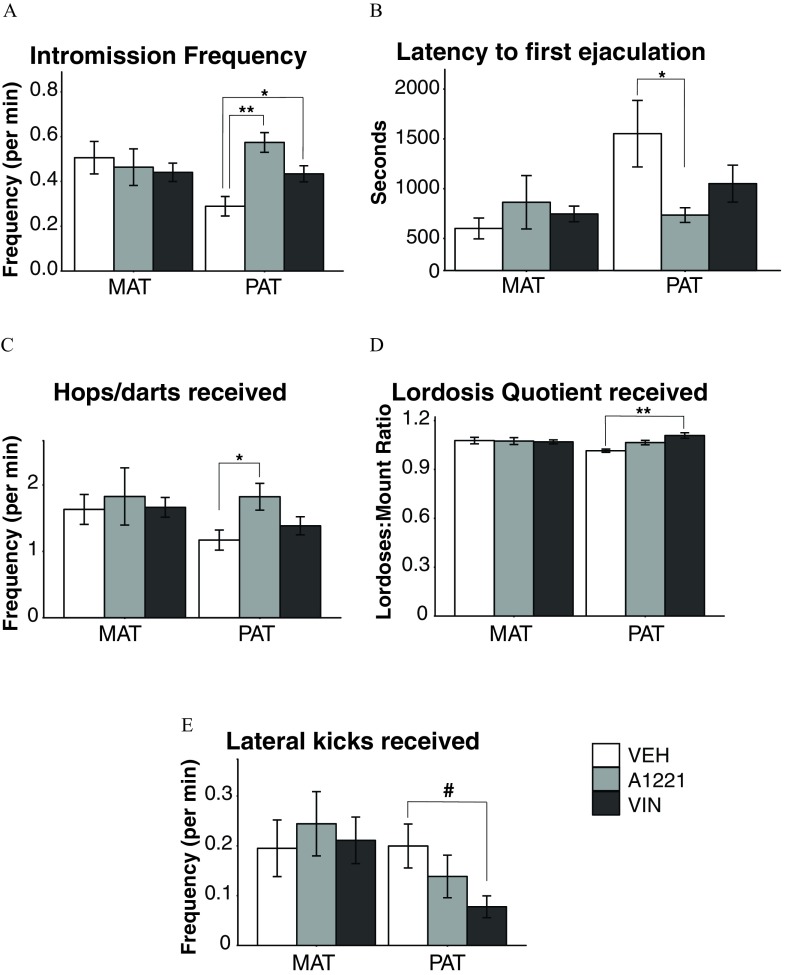
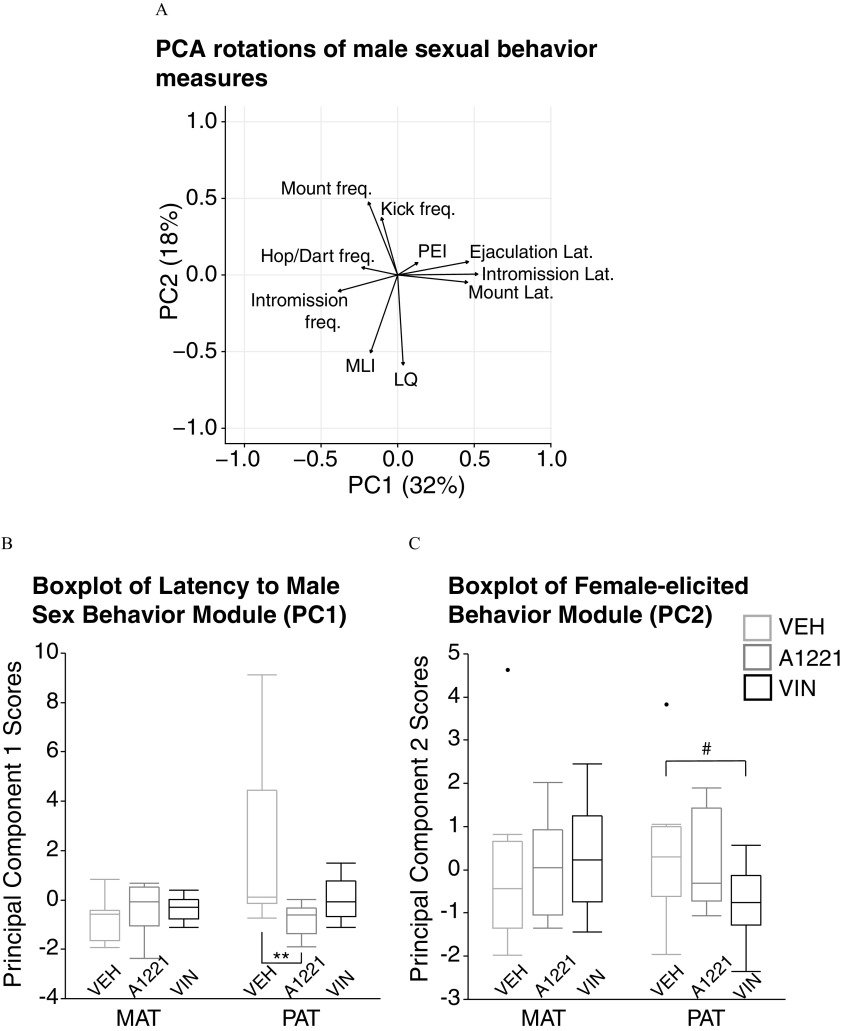
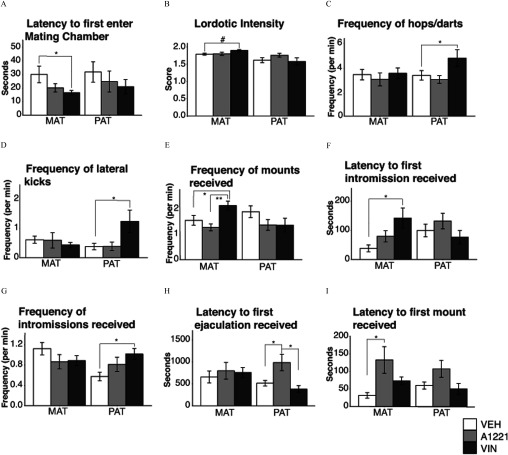
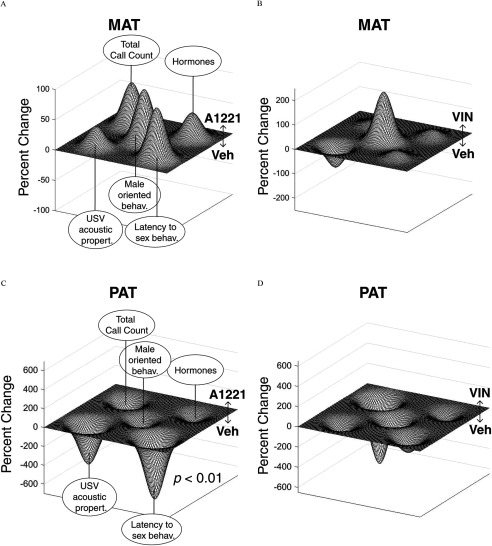
Methods: Pregnant rats were exposed to either a polychlorinated biphenyl (PCB) mixture, Aroclor 1,221 (A1221), the fungicide vinclozolin (VIN), or the vehicle (VEH) (6% dimethylsulfoxide in sesame oil) alone. A1221 is weakly estrogenic, while VIN is antiandrogenic, enabling us to compare different classes of EDCs. The F1 male and female offspring were bred to generate the paternal- and maternal-lineage F2 generation. This F2 generation was assessed for physiological outcomes, ultrasonic vocalizations (USVs), and sexual behavior in adulthood.

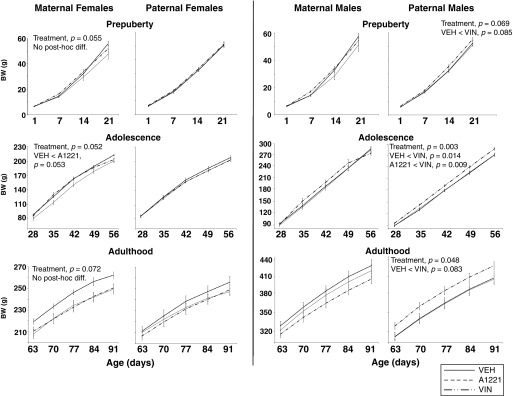
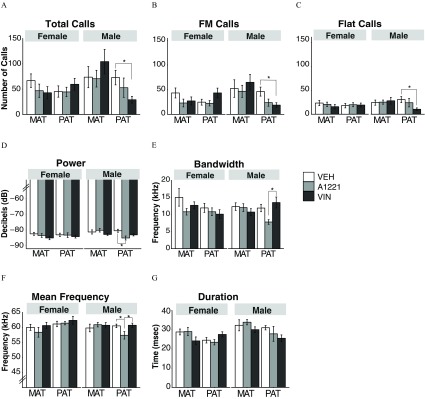
Results: Each EDC caused phenotypic effects in a sex- and lineage-dependent manner. The most robustly affected group was the paternal-lineage males. F2 VIN paternal male descendants had increased body weight throughout the lifespan, lower concentrations of circulating estradiol, and lower adrenal and testicular indices. Both VIN and A1221 paternal-lineage males also exhibited the greatest number of changes in the characteristics of USVs in response to an opposite-sex animal and changes in sexual behaviors in a mating test.

Conclusion: Exposure of rats to EDCs at the germ cell stage led to differences in the physiological and behavioral phenotype later in life, especially in males. This finding has implications for multigenerational physiological and reproductive health in wildlife and humans. https://doi.org/10.1289/EHP3550.


Figures

Figure 1A is a conceptual diagram showing breeding and treatment paradigm of pregnant rat. Figure 1B is a F2 generation timeline from P0 Birth to P135.
Figure 1.
(A) The breeding and treatment paradigm is shown. Pregnant rats were exposed to vinclozolin (VIN), Aroclor 1,221 (A1221), or the vehicle (VEH) dimethylsulfoxide (DMSO) daily from E8–E18. The F1 fetus was exposed directly, and F2 generation was exposed as developing germ cells, as indicated within the F0 dam. The numbers of F0 litters is indicated (four VEH, six A1221, seven VIN). From these litters, to generate a maternal lineage, six VEH, eight A1221, and eight VIN F1 females were allowed to mature and breed with untreated male Sprague-Dawley rats. To generate the paternal lineage, seven VEH, six A1221, and 10 VIN F1 males were allowed to mature and were bred with untreated female Sprague-Dawley rats. The F2 male and female pups of each lineage were the focal experimental animals, with numbers of individuals used for behavioral phenotyping indicated in parentheses and no more than two pups of a sex were used per litter. (B) Timeline of developmental monitoring and behavioral characterization in the F2 generation is shown. Note: AGD, anogenital distance; i.p., intraperitoneal; P, postnatal day; USV, ultrasonic vocalization.
Figures 2A and 2B are ultrasonic images. Figures 2C and 2D are spectrograms showing frequency (kHz; y-axis) across time (ms; x-axis) for FM and flat USVs, respectively.
Figure 2.
(A) Photograph of an ultrasonic vocalization (USV) testing session shows an experimental and a stimulus animal interacting across a plastic grid. (B) Photograph showing the experimental rat alone in the chamber after removal of the stimulus rat. Representative spectrograms of (C) FM, and (D) flat USVs are shown. Note: FM, frequency modulated.
Figure 3 left pane comprises six line graphs plotting body weight in grams (y-axis) across age in days (x-axis) during three phases of development prepuberty, adolescence, and adulthood for maternal females and paternal females. The right pane depicts the same for maternal males and paternal males.
Figure 3.
Body weight (BW; grams) is shown from birth through adulthood for F2 females and F2 males during three phases of development: prepuberty (P1–P21), adolescence (P28–P56), and adulthood (P63–P91). Note: A1221, Aroclor 1,221; VEH, vehicle; VIN, vinclozolin. For each curve, p-values were determined by repeated-measures analysis of variance (ANOVA) followed by Tukey’s HSD for posthoc analysis. Data are shown as mean±standard   error   of   the   mean  (SEM).
Figure 4A is a bar graph with mean plus or minus S E M plotting concentrations of estradiol (picograms per milliliter) (y-axis) across maternal and paternal males and females (x-axis) for V E H, A1221, and V I N. Figure 4B is a bar graph with mean plus or minus S E M plotting concentrations of testosterone (nanograms per milliliter) (y-axis) across maternal and paternal males (x-axis) for V E H, A1221, and V I N.
Figure 4.
Serum estradiol (A) and testosterone (B) concentrations are shown for F2 rats. (A) Serum estradiol in female and male rats. Maternal-lineage females were euthanized as adults on proestrus, whereas paternal females were euthanized on day 18 of pregnancy, indicated as E18. All male rats were euthanized between 4–4.5 mo of age. (B) Serum testosterone in the same adult male rats. Note: A1221, Aroclor 1,221; MAT, maternal; PAT, paternal; VEH, vehicle; VIN, vinclozolin. *p<0.05; #p<0.10, as determined using ANOVA followed by Tukey’s HSD posthoc analysis. Data shown are mean±standard   error   of   the   mean  (SEM).
Figures 5A, 5B, and 5C are bar graphs with mean plus or minus S E M plotting number of total calls, FM calls, and Flat calls, respectively (y-axis), across maternal and paternal males and females (x-axis) for V E H, A1221, and V I N. Figures 5D and 5E are bar graphs with mean plus or minus S E M plotting decibels and frequency (y-axis) for power and bandwidth, respectively, across maternal and paternal males and females (x-axis) for V E H, A1221, and V I N. Figures 5F and 5G are bar graphs with mean plus or minus S E M plotting frequency and time (millisecond) (y-axis) for mean frequency and duration, respectively, across maternal and paternal males and females (x-axis) for V E H, A1221, and V I N.
Figure 5.
Ultrasonic vocalization (USV) results are shown for 50-kHz calls emitted by adult female and male rats of the maternal and paternal lineages. (A) Total, (B) FM, and (C) flat USVs are shown, as well as (D) call power, (E) bandwidth, (F) mean frequency, and (G) duration. Note: A1221, Aroclor 1,221; MAT, maternal; PAT, paternal; VEH, vehicle; VIN, vinclozolin. *p<0.05 as determined by analysis of variance (ANOVA) followed by Tukey’s HSD posthoc analysis. Data shown are mean±standard   error   of   the   mean  (SEM).
Figure 6A is graphical representation plotting PC2 (27 percent) (y-axis) across PC1 (45 percent) (x-axis) for bandwidth, mean frequency, power, and duration. Figure 6B is a box plot showing principal component 1 scores (y-axis) across maternal and paternal females and males (x-axis) for V E H, A1221, and V I N.
Figure 6.
(A) Principal components analysis (PCA) with spectrogram measures, and (B) boxplots of USV Acoustic Properties Module scores from principal component 1 (PC1). Arrows indicate the directionality of loading of each variable onto each PC. (B) Boxplot data are shown as median (line), with the 25th percentile and 75th percentile indicated by the upper and lower quartiles of the box. Whiskers represent the furthest points within 1.5× interquartile range (IQR) of the limits of the box (75th quartile minus 25th quartile). A single datapoint (black circle) in the paternal A1221 females was a statistical outlier. Note: A1221, Aroclor 1,221; MAT, maternal; PAT, paternal; VEH, vehicle; VIN, vinclozolin. *p<0.05 determined by one-way analysis of variance (ANOVA).
Figures 7A, 7C, and 7E are bar graphs with mean plus or minus S E M plotting frequency per minute (y-axis) for intromission frequency, hops or darts received, and lateral kicks received, respectively, across maternal and paternal males (x-axis) for V E H, A1221, and V I N. Figure 7B is a bar graph with mean plus or minus S E M plotting seconds (y-axis) across maternal and paternal males (x-axis) for V E H, A1221, and V I N for latency to first ejaculation. Figure 7D is a bar graph with mean plus or minus S E M plotting lordoses:mount ratio (y-axis) across maternal and paternal males (x-axis) for V E H, A1221, and V I N for lordosis quotient received.
Figure 7.
Males were observed for sexual behavior with an untreated receptive female. (A) Frequency of intromissions, (B) latency to ejaculate, (C) numbers of hops/darts received, (D) lordosis quotient, and (E) lateral kicks received are shown. Note: A1221, Aroclor 1,221; MAT, maternal; PAT, paternal; VEH, vehicle; VIN, vinclozolin. Data are shown as mean±standard   error   of   the   mean  (SEM). #p<0.10; *p<0.05; **p<0.01 as determined by analysis of variance (ANOVA) followed by Tukey’s HSD posthoc analysis.
Figure 8A is a graphical representation plotting PC2 (18 percent) (y-axis) across PC1 (32 percent) (x-axis). Figures 8B (latency to male sex behavior module) and 8C (female-elicited behavior module) are box plots showing principal component 1 scores and principal component 2 scores for, respectively, (y-axis) across maternal and paternal males (x-axis) for V E H, A1221, and V I N.
Figure 8.
(A) Principal components analysis (PCA) with male sexual behavior measures, (B) boxplots of measures associated with PC1 [Latency to Male Sex Behavior Module (PC1)], and (C) measures associated with PC2 [Female-elicited Behavior Module (PC2)] are shown. A) Arrows indicate the directionality and magnitude of variable loading onto each PC. (B, C) Boxplot data are shown as median (line), with the 25th percentile and 75th percentile indicated by the upper and lower quartiles of the box. Whiskers represent the furthest points within 1.5×interquartile   range  (IQR). Two datapoints (black circle), one each in the maternal vehicle male and the paternal vehicle male groups, were statistical outliers. Note: A1221, Aroclor 1,221; MAT, maternal; PAT, paternal; VEH, vehicle; VIN, vinclozolin. #p<0.10; **p<0.01 as determined by one-way analysis of variance (ANOVA).
Figures 9A, 9F, 9H, and 9I are bar graphs with mean plus or minus S E M plotting seconds (y-axis) for latency to first enter mating chamber, latency to first intromission received, latency to first ejaculation received, and latency to first mount received, respectively, across maternal and paternal females (x-axis) for V E H, A1221, and V I N. Figure 9B is a bar graph with mean plus or minus S E M plotting score (y-axis) for lordic intensity (y-axis) across maternal and paternal females (x-axis) for V E H, A1221, and V I N. Figures 9C, 9D, 9G, and 9E are bar graphs with mean plus or minus S E M plotting frequency per minute (y-axis) for frequency of hops or darts, frequency of lateral kicks, frequency of mounts received, and frequency of intromissions received, respectively, across maternal and paternal females (x-axis) for V E H, A1221, and V I N.
Figure 9.
Females were observed for sexual behavior in a paced mating chamber. Latency to first enter the (A) mating chamber, (B) lordotic intensity, (C) frequency of hops/darts, (D) frequency of lateral kicks to males, (E) frequency of mounts received, (F) latency to receive a first intromission, (G) frequency of intromissions, (H) latency to first ejaculation, and (I) latency to first mount are shown as mean±standard   error   the   mean  (SEM). Note: A1221, Aroclor 1,221; MAT, maternal; PAT, paternal; VEH, vehicle; VIN, vinclozolin. #p<0.1; *p<0.05; **p<0.01 as determined by analysis of variance (ANOVA) followed by Tukey’s HSD posthoc analysis.
Figure 10A, 10B, 10C, and 10D are functional landscapes.
Figure 10.
Functional landscapes for male behavior and serum hormones are shown for maternal and paternal lineages for A1221 (A and C, respectively) and VIN (B and D, respectively) compared to VEH. Each landscape displays the relative difference of each endocrine-disrupting chemical (EDC) treatment from VEH within each lineage. A relative increase for one group over the other is shown by directionality and height of a peak of valley. Nodes around the outer corners (beginning upper left and going clockwise) are: total call counts, serum hormones module, latency to engage in sex behavior module, ultrasonic vocalization (USV) call properties module, and male-oriented sex behaviors in the middle. Note that the y-axis scale differs between each landscape. Note: A1221, Aroclor 1,221; MAT, maternal; PAT, paternal; VEH, vehicle; VIN, vinclozolin.

References

    1. Adler NT. 1969. Effects of the male's copulatory behavior on successful pregnancy of the female rat. J Comp Physiol Psychol 69(4):613–622, PMID: 5391014, 10.1037/h0028244. - DOI - PubMed
    1. Agency for Toxic Substances and Disease Registry. 2000. Toxicological Profile For Polychlorinated Biphenyls (PCBs). 1–948. - PubMed
    1. Alyea RA, Gollapudi BB, Rasoulpour RJ. 2014. Are we ready to consider transgenerational epigenetic effects in human health risk assessment? Environ Mol Mutagen 55(3):292–298, PMID: 24259352, 10.1002/em.21831. - DOI - PubMed
    1. Anway MD, Cupp AS, Uzumcu M, Skinner MK. 2005. Epigenetic transgenerational actions of endocrine disruptors and male fertility. Science 308(5727):1466–1469, PMID: 15933200, 10.1126/science.1108190. - DOI - PMC - PubMed
    1. Barker DJ, Root DH, Ma S, Jha S, Megehee L, Pawlak AP, et al. . 2010. Dose-dependent differences in short ultrasonic vocalizations emitted by rats during cocaine self-administration. Psychopharmacology (Berl) 211(4):435–442, PMID: 20571780, 10.1007/s00213-010-1913-9. - DOI - PMC - PubMed

Publication types

MeSH terms

LinkOut - more resources