. 2018 Sep 13;14(9):e1007669.
doi: 10.1371/journal.pgen.1007669. eCollection 2018 Sep.

Pan-cancer inference of intra-tumor heterogeneity reveals associations with different forms of genomic instability

Affiliations

Pan-cancer inference of intra-tumor heterogeneity reveals associations with different forms of genomic instability

Franck Raynaud et al. PLoS Genet. .

Abstract

Genomic instability is a major driver of intra-tumor heterogeneity. However, unstable genomes often exhibit different molecular and clinical phenotypes, which are associated with distinct mutational processes. Here, we algorithmically inferred the clonal phylogenies of ~6,000 human tumors from 32 tumor types to explore how intra-tumor heterogeneity depends on different implementations of genomic instability. We found that extremely unstable tumors associated with DNA repair deficiencies or high chromosomal instability are not the most intrinsically heterogeneous. Conversely, intra-tumor heterogeneity is greatest in tumors exhibiting relatively high numbers of both mutations and copy number alterations, a feature often observed in cancers associated with exogenous mutagens. Independently of the type of instability, tumors with high number of clones invariably evolved through branching phylogenies that could be stratified based on the extent of clonal (early) and subclonal (late) instability. Interestingly, tumors with high number of subclonal mutations frequently exhibited chromosomal instability, TP53 mutations, and APOBEC-related mutational signatures. Vice versa, mutations of chromatin remodeling genes often characterized tumors with few subclonal but multiple clonal mutations. Understanding how intra-tumor heterogeneity depends on genomic instability is critical to identify markers predictive of the tumor complexity and envision therapeutic strategies able to exploit this association.


Conflict of interest statement

The authors have declared that no competing interests exist.

Figures

Fig 1
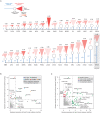
Fig 1. Number of clones in human tumors.
A) Number of clones in human tumors within each tumor type. Tumor types are ranked by median number of clones. The number of clones in each human tumor is the weighted mean of the number of clones obtained in the top scoring PhyloWGS phylogenies for that sample. The thick central line of each box plot represents the median number of significant motifs, the bounding box corresponds to the 25th–75th percentiles, and the whiskers extend up to 1.5 times the interquartile range. B-E) Correlation between number of inferred clones by PhyloWGS (Y-axis) and tumor purity (B) inferred by ABSOLUTE, mean number of reads per mutated sites (RMS) (C), number of mutations (D) and number of copy number altered segments (E) (X-axes).
Fig 2
Fig 2. Genomic instability and intra-tumor heterogeneity.
A) Number of mutations (left panel) and number of clones (right panel) in tumor types and subtypes with high mutation instability. Samples are color coded by the their number of copy number changes, with high color intensity corresponding to high number of events. B) Number of copy number altered segments (left panel) and number of clones (right panel) in tumor types and subtypes with high chromosomal instability. Samples are color coded by the their number of mutations, with high color intensity corresponding to high number of events. C) Total number of mutations (Y-axis) versus of copy number altered segments (CNA, X-axis) for all tumor samples (n = 5593). Samples are grouped 4 classes: low numbers of mutations (<300) and CNA (<80) (gray), high number of mutations (>300) and low number of CNA (<80) (M class, green), high number of CNA (>80) and low number of mutations (<300) (C class, red), or high numbers of both mutations (>300) and CNA (>80) (MC class, orange). D) Number of clones in classes M, C, MC, and with Low Instability. Samples are color coded by the their total number of alterations, with high color intensity corresponding to high number of events. E) The mean number of clones increases (from cold to warm colors) in samples with relatively high numbers of both mutations and CNA. Axes are normalized by the maximum of the logarithm of the number of mutations (Y-axis) and CNA (X-axis). Acronyms: LUAD: lung adenocarcinoma, SKCM: skin melanoma, MSI: microsatellite instability, POLE: tumors with hotspot mutations of polymerase-ε gene, STAD: stomach adenocarcinoma, BRCA: breast cancer, UCEC: endometrial cancer, CIN: chromosomal instability.
Fig 3
Fig 3. Linear and divergent evolution for low and high number of clones.
A) Example of Tree score values for phylogenies with 5 clones. The Tree scores increase with increasing divergence. B-C) Tree score as a function of the number of clones observed in human (B) and simulated (C) tumors. Divergent phylogenies can emerge when at least 3 clones are detected (blue dotted line). The range of Tree scores for phylogenies with more than 3 clones goes from a minimal divergence value (green line) to a maximal divergence value (red line). Points are colored to reflect point density with cold colors for low density and warm colors for high density. D) Box plot comparison of Tree scores in samples exhibiting features of neutral evolution (R2 model fit > 0.98, black) and samples that do not exhibit such features (R2 model fit < 0.98, red) in individual cancer types that where the difference was significant (FDR < 0.2, left) and across the whole dataset (right). Acronyms: PAAD: pancreatic adenocarcinoma, LUAD: lung adenocarcinoma, STAD: stomach adenocarcinoma, BRCA: breast cancer, CHOL: cholangiosarcoma, LUSC: lung squamous-cell cancer, OV: ovarian cancer, CRC: colorectal cancer.
Fig 4
Fig 4. Clonal and subclonal genomic instability.
A) Mean clonal and subclonal mutations found in each tumor type. For each tumor type we report: mean number of clonal mutations (blue line), mean number of subclonal mutations (height of the red triangle), mean Tree score (base width of the red triangle), and mean Tree score variance (shade of red within the triangle: intense red corresponds to high variance, transparent red corresponds to low variance). B) Statistical significance of the difference between the numbers of clonal (X-axis) and subclonal (Y-axis) mutations in patient exhibiting a specific mutational signature (S, n = 22) in each tumor type. Signatures of known etiology that scored as significant (p-value < 0.003, FDR < 0.1) in at least 2 tumor types are labeled and color coded based on their etiology, all other significant signatures are in black. Signatures below the significance threshold are in gray. C) Statistical significance of the difference between the numbers of clonal (X-axis) and subclonal (Y-axis) mutations in patient exhibiting a specific alteration (n = 505) in each tumor type. Significant alterations (p-value < 0.001, FDR < 0.25) are color coded based on their type as described in the legend. Alterations below the significance threshold are in gray. Acronyms: TGCT: testicular cancer, THCA: thyroid cancer, PCPG: pheochromocytoma / paraganglioma, PRAD: prostate cancer, UVM: uveal melanoma, KICH: kidney chromophobe cancer, LGG: low grade glioma, AML: acute myeloid leukemia, PAAD: pancreatic adenocarcinoma, THYM: thymoma, MESO: mesothelioma, OV: ovarian cancer, KIRP: kidney papillary cancer, ACC: adrenocortical cancer, BRCA: breast cancer, GBM: glioblastoma, LIHC: liver cancer, UCS: uterine carcinosarcoma, SARC: sarcoma, CESC: cervical cancer, DLBC: diffuse large B-cell lymphoma, HNSC: head and neck squamous-cell cancer, LUAD: lung adenocarcinoma, CHOL: cholangiosarcoma, BLCA: bladder cancer, ESCA: esophageal cancer, CRC: colorectal cancer, LUSC: lung squamous-cell cancer, STAD: stomach adenocarcinoma, UCEC: endometrial cancer, SKCM: skin melanoma.

References

    1. McGranahan N. and Swanton C., “Clonal Heterogeneity and Tumor Evolution: Past, Present, and the Future,” Cell, vol. 168, no. 4, pp. 613–628, February 2017. - PubMed
    1. Vogelstein B., Papadopoulos N., Velculescu V. E., Zhou S., Diaz L. A., and Kinzler K. W., “Cancer genome landscapes,” Science, vol. 339, no. 6127, pp. 1546–1558, March 2013. - PMC - PubMed
    1. Negrini S., Gorgoulis V. G., and Halazonetis T. D., “Genomic instability—an evolving hallmark of cancer,” Nat. Rev. Mol. Cell Biol., vol. 11, no. 3, pp. 220–228, March 2010. - PubMed
    1. Nowell P. C., “The clonal evolution of tumor cell populations,” Science, vol. 194, no. 4260, pp. 23–28, October 1976. - PubMed
    1. Burrell R. A., McGranahan N., Bartek J., and Swanton C., “The causes and consequences of genetic heterogeneity in cancer evolution,” Nature, vol. 501, no. 7467, pp. 338–345, September 2013. - PubMed

Publication types