. 2018 Nov 30;46(21):11262-11273.
doi: 10.1093/nar/gky827.

Distinctive structural basis for DNA recognition by the fission yeast Zn2Cys6 transcription factor Pho7 and its role in phosphate homeostasis

Affiliations

Distinctive structural basis for DNA recognition by the fission yeast Zn2Cys6 transcription factor Pho7 and its role in phosphate homeostasis

Angad Garg et al. Nucleic Acids Res. .

Abstract

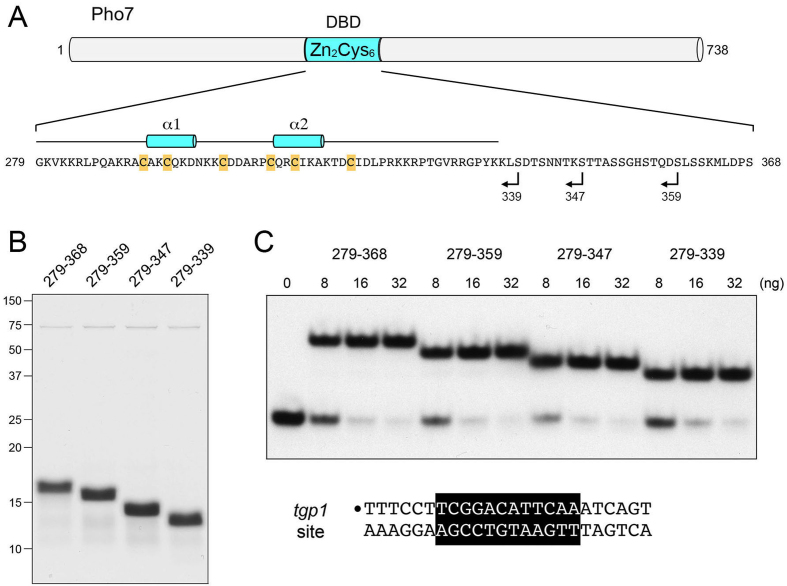
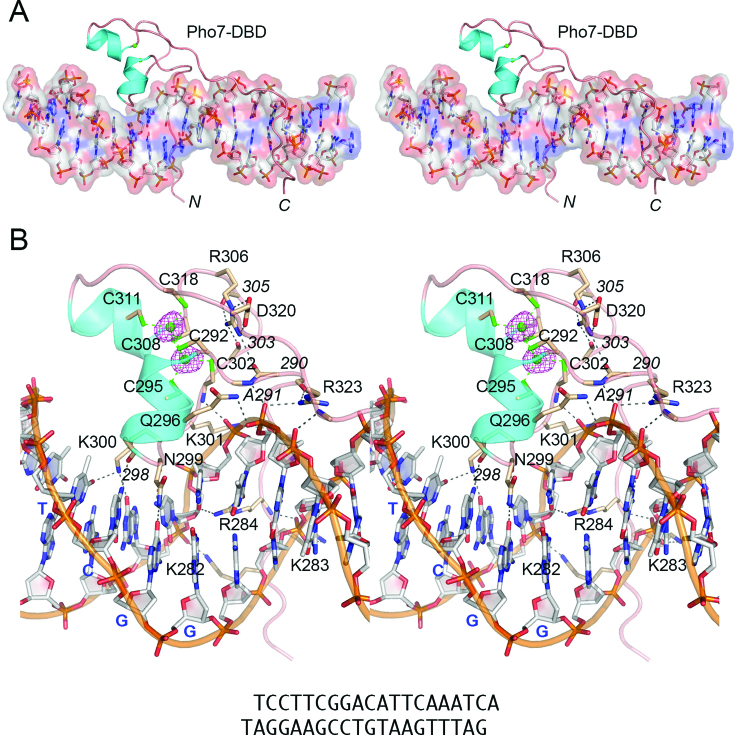
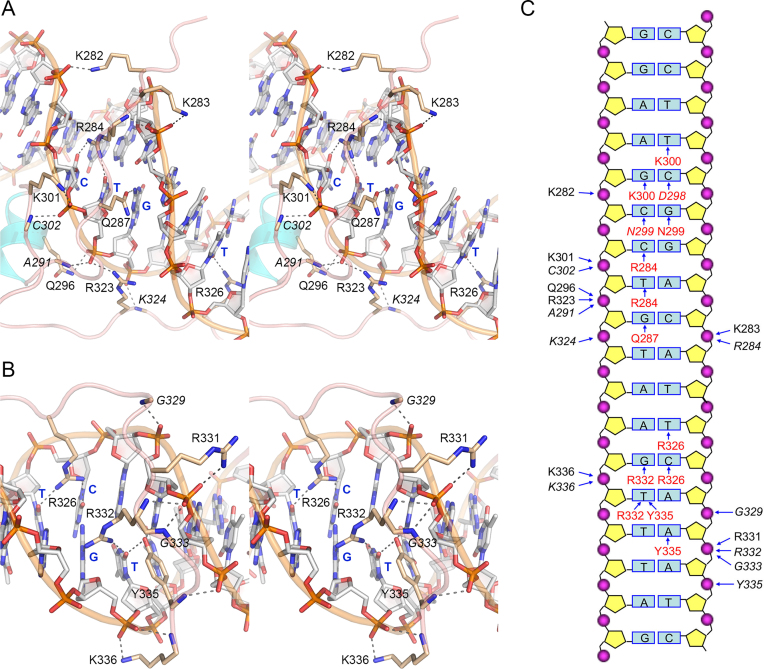
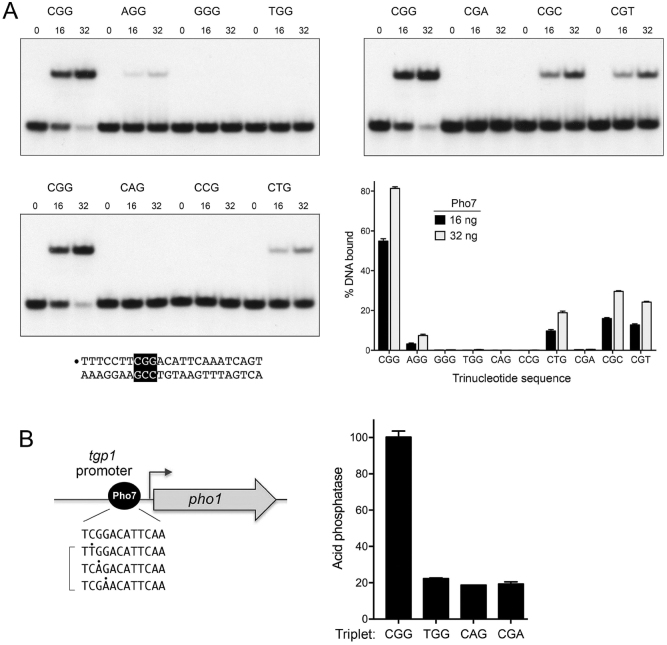
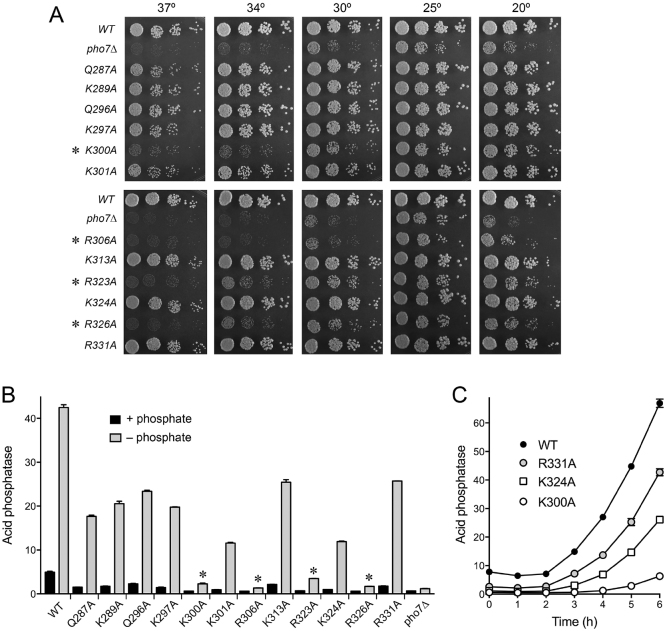
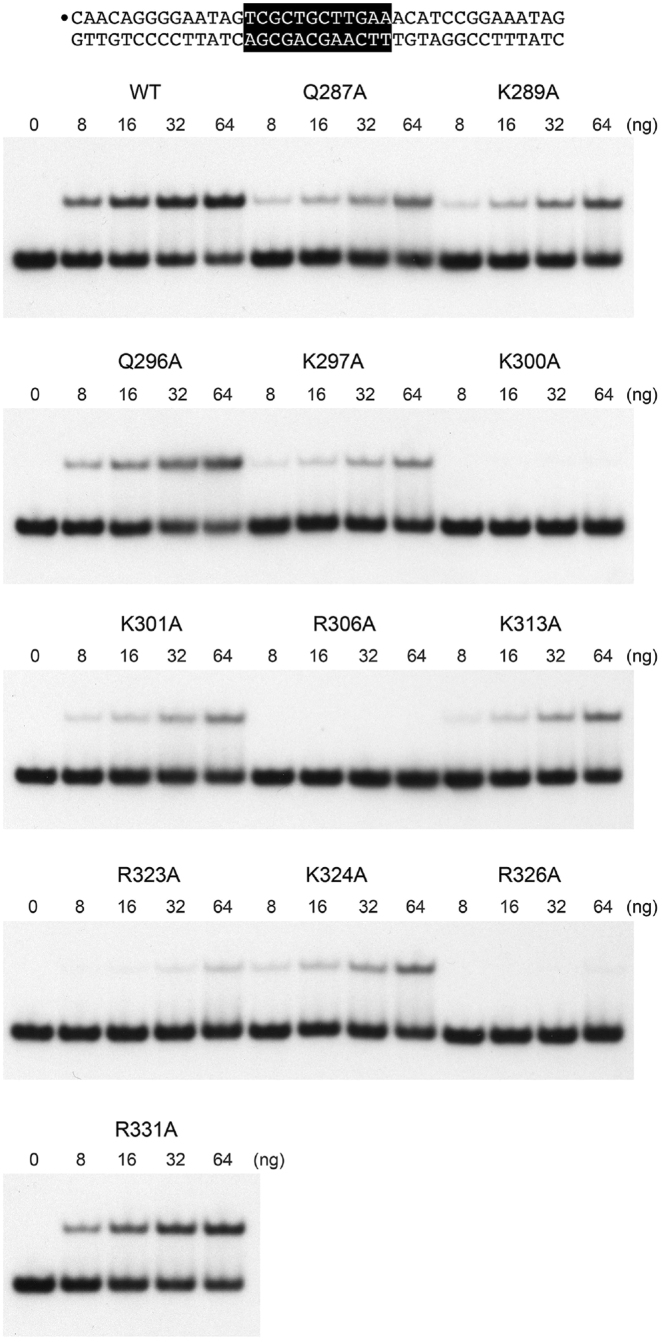
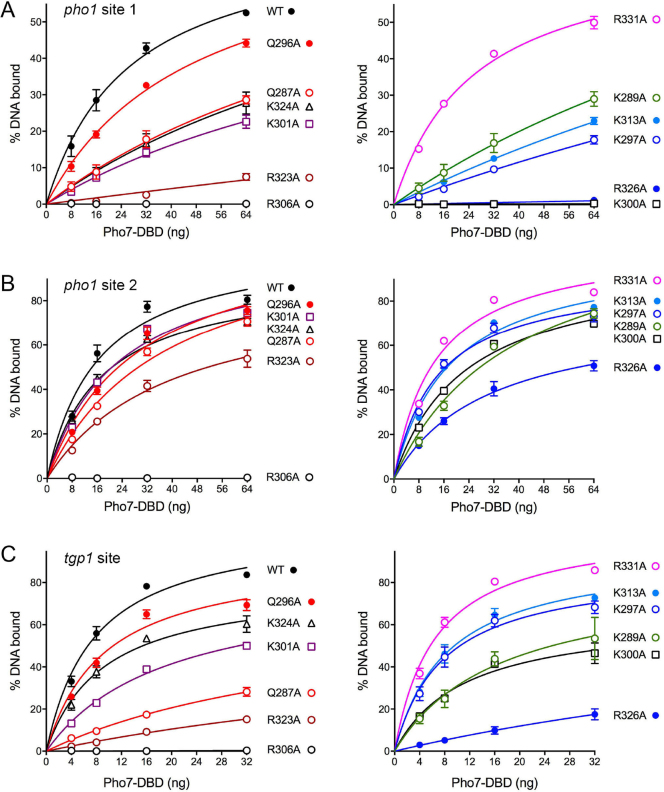
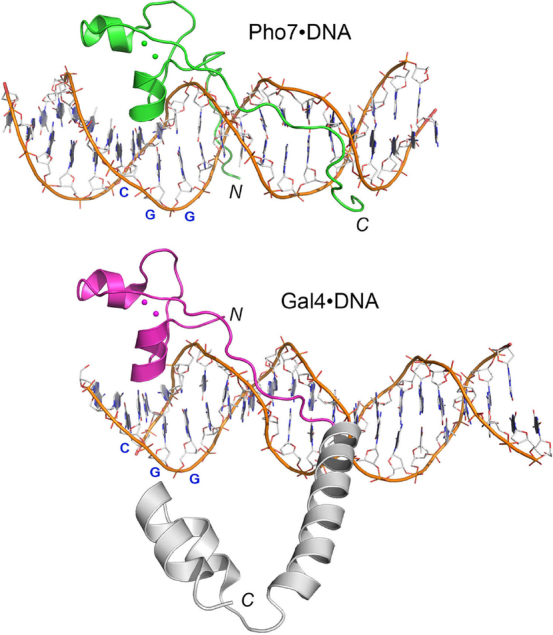
Pho7, a member of the Zn2Cys6 family of fungal transcription factors, is the key transcriptional activator underlying fission yeast phosphate homeostasis, a physiological response to phosphate starvation in which the pho1, pho84 and tgp1 genes are upregulated. Here, we delineated a minimized 61-amino-acid Pho7 DNA-binding domain (DBD) and determined the 1.7 Å crystal structure of the DBD at its target site in the tgp1 promoter. Two distinctive features of the Pho7 DBD are: it binds DNA as a monomer, unlike most other fungal zinc-cluster factors that bind as homodimers; and it makes extensive interactions with its asymmetric target sequence over a 14-bp footprint that entails hydrogen bonding to 13 individual bases within, and remote from, the CGG triplet typically recognized by other Zn2Cys6 DBDs. Base pair substitutions at Pho7 sites in the tgp1 and pho1 promoters highlight the importance of the 5'-CGG triplet for Pho7 binding in vitro and Pho7-dependent gene expression in vivo. We identify several DBD amino acids at which alanine substitution effaced or attenuated the pho1 phosphate starvation response and concordantly reduced Pho7 binding to a pho1 promoter site.


Figures

Figure 1.
Figure 1.
Pho7 DNA binding domain. (A) The 738-aa Pho7 polypeptide is depicted as a gray cylinder, with the position of the Zn2Cys6 DNA binding domain (DBD; aa 279–368) highlighted in blue. The amino acid sequence of the DBD is shown, with the six zinc-binding cysteines highlighted in gold. The margins of the DBD C-terminal truncations analyzed in the present study are indicated by reverse arrowheads. The secondary structure elements (two α-helices) revealed by the DBD crystal structure are shown above the amino acid sequence. (B) Aliquots (5 μg) of the indicated recombinant DBD proteins were analyzed by SDS-PAGE. The Coomassie blue-stained gel is shown. The positions and sizes (in kDa) of marker polypeptides are indicated on the left. (C) Truncation defines a minimized DBD. EMSAs were performed using the 32P-labeled tgp1 promoter DNA probe shown at the bottom. The 32P label is indicated by •. The Pho7 binding motif is shown in white font on black background. Reaction mixtures (10 μl) containing 0.5 pmol 32P-labeled DNA, 0.34 μg poly(dI-dC), 50 mM NaCl, and 0, 8, 16 or 32 ng Pho7-DBD were incubated for 10 min at room temperature. The mixtures were analyzed by native PAGE in 0.25× TBE. An autoradiograph of the dried gel is shown.
Figure 2.
Figure 2.
Structure of Pho7 DBD bound to tgp1 site DNA. (A) Global stereo view of the Pho7–DNA complex with the DNA depicted as a stick model, with an overlying transparent surface model to highlight the major and minor grooves. The Pho7 protein is rendered as a cartoon trace with cyan α-helices; the two zinc atoms are shown as green spheres. The N and C termini of the DBD are labeled. (B) A detailed stereo view focused on the interactions of the DBD with the DNA major groove over the 5′-TCGG base pairs. The DNA is shown as a stick model with gray carbons and a gold cartoon trace through the backbone phosphates. The 5′-TCGG ‘top strand’ nucleobases are labeled in blue bold font. Selected amino acids in the DBD are depicted as stick models with beige carbons and labeled in plain black font for side-chains and black italic font for main-chains. Pho7–DNA hydrogen bonds and selected intra-Pho7 hydrogen bonds are indicated by black dashed lines. Cysteine–zinc interactions are denoted by green dashed lines. Anomalous difference density for the zinc atoms, contoured at 4σ, is shown in red mesh.
Figure 3.
Figure 3.
The Pho7–DNA interface. (A) Detailed stereo view focused on the interactions of the DBD in the minor groove over the 5′-GAC base pairs. The 3′-CTG ‘bottom strand’ nucleobases are labeled in blue bold font. (B) Detailed stereo view focused on the interactions of the DBD in the minor groove over the 5′-TCAA base pairs. Selected bases are labeled in blue bold font. Pho7–DNA hydrogen bonds are indicated by black dashed lines in panel A and B. (C) Cartoon diagram summarizing Pho7–DNA contacts. The DNA is depicted as a two-dimensional base pair ladder with the ‘top’ (5′-CGG triplet-containing) strand on the right and the complementary bottom strand on the left. Amino acids that contact particular backbone phosphates are labeled to the left and right of the phosphates (depicted as magenta spheres) in plain black font for side-chain phosphate contacts and italic black font for main-chain phosphate contacts, as indicated by the arrows pointing at the phosphates. Amino acids that contact particular nucleobases are labeled in red font (plain for protein side-chain interactions with bases and italics for main-chain contacts), as indicated by the arrows pointing at the bases.
Figure 4.
Figure 4.
Effect of CGG triplet mutations on Pho7-DBD binding to the tgp1 promoter in vitro and promoter activity in vivo. (A) The 24-bp tgp1 promoter DNA is shown at bottom left with the CGG triplet highlighted in white font on black background. The 5′ 32P-label on the top strand is indicated by •. Single base pair changes at each position of the CGG triplet were introduced into the 24-bp DNA as specified. Reaction mixtures (10 μl) containing 0.5 pmol 32P-labeled DNA, 50 mM NaCl, 0.34 μg poly(dI•dC), and 0, 16 or 32 ng of Pho7 DBD were incubated for 10 min at room temperature. The mixtures were analyzed by native PAGE in 0.25x TBE. Autoradiographs of the dried gels are shown. The extents of Pho7 binding to each 24-mer DNA were quantified and are plotted in the bar graph at bottom right. Each datum in the graph is the average of three independent binding experiments ± SEM. (B) In the tgp1•pho1 reporter plasmid shown in cartoon form at left, the pho1 ORF is fused immediately downstream of a fragment of genomic DNA encompassing the tgp1 transcription start (forward arrow) site plus 42 bp of downstream sequence and 871 bp (–871) of upstream tgp1 sequence. A single binding site for Pho7 (depicted as a black ball) has been mapped in the tgp1 promoter (6). The 12-nucleotide site is shown below the reporter cartoon, along with three mutated versions of the CGG triplet. tgp1•pho1 reporter plasmids with wild-type and the mutated Pho7 sites were introduced into a strain deleted for the endogenous pho1 gene. Plasmid-containing cells were grown logarithmically in YES medium and assayed for acid phosphatase activity (6).
Figure 5.
Figure 5.
Effect of Pho7 mutations on phosphate homeostasis in vivo. (A) S. pombe strains deleted of pho7 (pho7Δ) or bearing the pho7 alleles as indicated were spot-tested for growth at the temperatures specified. Alleles that did not complement the temperature-sensitive growth defect of pho7Δ are denoted by asterisks. (B) Acid phosphatase activity of cells bearing the indicated pho7 alleles assayed before (+ phosphate) and 5 h after (– phosphate) transfer of logarithmically growing cells to medium lacking phosphate. (C) Acid phosphatase activity of cells bearing the indicated pho7 alleles, plotted as a function of time after transfer to medium lacking phosphate.
Figure 6.
Figure 6.
Binding of Pho7 mutants to pho1 promoter site 1. EMSAs were performed using the 32P-labeled site 1 DNA probe shown at the top. The 32P label is indicated by •. The Pho7 binding motif is shown in white font on black background. Reaction mixtures (10 μl) containing 0.24 pmol 32P-labeled DNA, 0.34 μg poly(dI-dC), 50 mM NaCl, and 0, 8, 16, 32 or 64 ng Pho7-DBD were incubated for 10 min at room temperature. The mixtures were analyzed by native PAGE in 0.25× TBE. Autoradiographs of the dried gels are shown.
Figure 7.
Figure 7.
Mutational effects on Pho7 binding to three target sites. EMSAs were performed using the pho1 site 1 (A), pho1 site 2 (B), and tgp1 site (C) DNA probes as described in the legends to Figure 6, Supplementary Figures S5 and S6. The extents of DNA binding were quantified and are plotted as function of input Pho7. For clarity, the WT and mutant binding curves for each site are plotted in two groups in side-by-side graphs. Each datum in the graphs is the average of three independent binding experiments ±SEM.
Figure 8.
Figure 8.
Comparison of Pho7 and Gal4 DNA binding modes. A vertically offset superposition of the Pho7•DNA and Gal4•DNA (pdb: 3COQ) complexes with respect to their zinc modules and the 5′-CGG base pair triplet that they recognize in the major groove is shown. Only one Gal4 protomer of the DNA-bound homodimer is included. The DNA-interacting portions of the Pho7 and Gal4 proteins are colored green and magenta, respectively. The Pho7 DBD has no counterpart of the coiled-coil homodimerization domain at the C-terminus of the Gal4 DBD (colored gray).

References

    1. Tomar P., Sinha 2H.. Conservation of PHO pathway in ascomycetes and the role of Pho84. J. Biosci. 2014; 39:525–536. - PubMed
    1. Jain A., Nagarajan V.K., Raghothama K.G.. Transcriptional regulation of phosphate acquisition by higher plants. Cell. Mol. Life Sci. 2012; 69:3207–3224. - PMC - PubMed
    1. Carter-O’Connell I., Peel M.T., Wykoff D.D., O’Shea E.K.. Genome-wide characterization of the phosphate starvation response in Schizosaccharomyces pombe. BMC Genomics. 2012; 13:697. - PMC - PubMed
    1. Henry T.C., Power J.E., Kerwin C.L., Mohammed A., Weissman J.S., Cameron D.M., Wykoff D.D.. Systematic screen of Schizosaccharomyces pombe deletion collection uncovers parallel evolution of the phosphate signal pathways in yeasts. Euk. Cell. 2011; 10:198–206. - PMC - PubMed
    1. Schwer B., Sanchez A., Shuman S.. RNA polymerase II CTD phospho-sites Ser5 and Ser7 govern phosphate homeostasis in fission yeast. RNA. 2015; 21:1770–1780. - PMC - PubMed

Publication types

MeSH terms

LinkOut - more resources