. 2018 Oct 12;46(18):9875-9889.
doi: 10.1093/nar/gky828.

Synthetic negative feedback circuits using engineered small RNAs

Affiliations

Synthetic negative feedback circuits using engineered small RNAs

Ciarán L Kelly et al. Nucleic Acids Res. .

Abstract

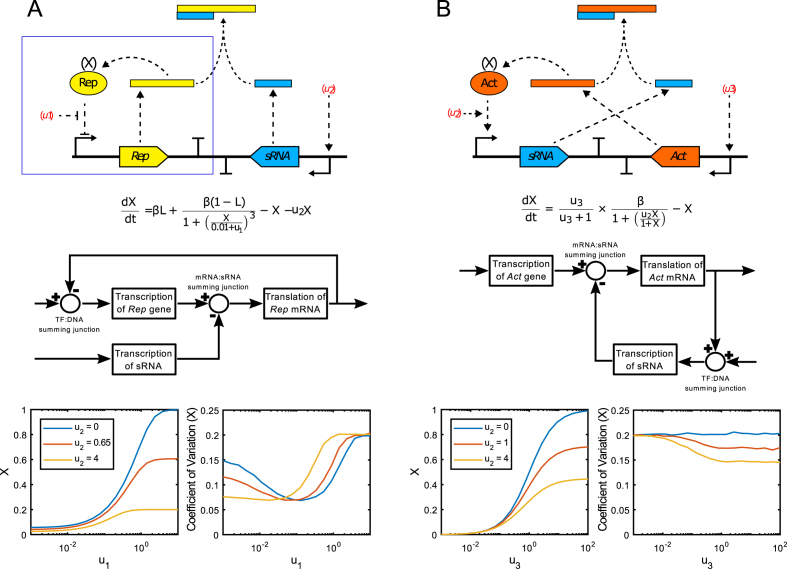
Negative feedback is known to enable biological and man-made systems to perform reliably in the face of uncertainties and disturbances. To date, synthetic biological feedback circuits have primarily relied upon protein-based, transcriptional regulation to control circuit output. Small RNAs (sRNAs) are non-coding RNA molecules that can inhibit translation of target messenger RNAs (mRNAs). In this work, we modelled, built and validated two synthetic negative feedback circuits that use rationally-designed sRNAs for the first time. The first circuit builds upon the well characterised tet-based autorepressor, incorporating an externally-inducible sRNA to tune the effective feedback strength. This allows more precise fine-tuning of the circuit output in contrast to the sigmoidal, steep input-output response of the autorepressor alone. In the second circuit, the output is a transcription factor that induces expression of an sRNA, which inhibits translation of the mRNA encoding the output, creating direct, closed-loop, negative feedback. Analysis of the noise profiles of both circuits showed that the use of sRNAs did not result in large increases in noise. Stochastic and deterministic modelling of both circuits agreed well with experimental data. Finally, simulations using fitted parameters allowed dynamic attributes of each circuit such as response time and disturbance rejection to be investigated.


Figures

Figure 1.
Figure 1.
Schematic biological and block diagrams of the circuit architectures investigated in this study and modelling predictions of each circuit's performance. (A) An sRNA-tuned autorepressor circuit consisting of: a gene encoding a repressor protein (Rep); a promoter upstream of the repressor-encoding gene (Rep), which the repressor protein can bind to and inhibit transcription from; an sRNA, whose expression can be induced through an external input (u2) and which reduces the translation of the autorepressor mRNA, thus reducing the effective feedback strength of the autorepressor loop (blue box). Block diagram shows the transcription factor (TF):DNA and mRNA:sRNA summing junctions (circles with + and - symbols). Simulations predict that the addition of the sRNA would increase the fidelity of steady-state output (X) tuning through the use of two external inputs (u2 and u1; red and yellow lines) instead of one (u1 only; blue line). Additionally the use of an sRNA should not result in large increases in output noise. (B) A closed-loop sRNA feedback circuit consisting of a translation-inhibiting sRNA, whose expression can be induced through an external input (u2), in closed-loop feedback with an mRNA encoding the transcriptional activator (Act) of the inducible promoter upstream of the sRNA-encoding gene. The steady-state output can primarily be set using a different external input (u3) which binds to a constitutively-expressed transcriptional activator (not shown) inducing transcription of the Act gene. Block diagram shows the transcription factor (TF):DNA and mRNA:sRNA summing junctions (circles with + and – symbols). Simulations predict that the closed sRNA-act mRNA feedback loop would reduce the range of the steady-state output (area between blue and yellow lines). Additionally the use of an sRNA is predicted to reduce output noise.
Figure 2.
Figure 2.
Testing of two synthetic sRNAs targeting the tetR-sfGFP mRNA, and investigating the inducibility of an sRNA. (A) Plasmids encoding sRNAs targeting the Shine Dalgarno sequence (pCK209) or start codon (pCK220) of the tetR-sfGFP mRNA were designed and constructed and the ability of each sRNA to inhibit translation assessed. E. coli strain JW3876 was transformed with pCK210 (encoding the autorepressor) and one of pCK209, pCK220 or pAH23 (negative control, no sRNA), cultured at 37°C in EZ rich defined medium supplemented with glycerol and increasing concentrations of aTc, and GFP fluorescence measured at late exponential phase (5 h) by flow cytometry. (B) Comparison of the 0 ng/ml aTc samples from A. (C) Experimentally-obtained coefficients of variation around the TetR-sfGFP mean from A. (D) To test the inducible expression of sRNA, the proD promoter of pCK209 was replaced with the E. coli rhaBAD promoter, resulting in plasmid pAH17. E. coli strain JW3876 was transformed with pCK210 and pAH17, cultured at 37°C in EZ rich defined medium supplemented with glycerol and 0 or 0.4 mg/ml l-rhamnose, and GFP fluorescence measured at late exponential phase (5 h) by flow cytometry. Fluorescence intensity represents the geometric mean of fluorescence. Error bars shown represent the standard deviation of three independent biological replicates. Statistical significance was determined using a one-way ANOVA, followed by a Tukey's multiple comparison test assuming unequal variance.
Figure 3.
Figure 3.
Testing the tunability of the sRNA-tuned autorepressor plasmid pCK221. A) Schematic diagram of plasmid pCK221. (B) Testing the tunability of sRNA translation inhibition with increasing concentrations of L-rhamnose. E. coli strain JW3876 was transformed with pCK221, cultured at 37°C in EZ rich defined medium supplemented with glycerol and increasing concentrations of l-rhamnose and GFP fluorescence measured at late exponential phase (5 h) by flow cytometry. (C) Testing the ability to fine-tune the coarse aTc input–output dial with the inducible expression of the sRNA. E. coli strain JW3876 was transformed with pCK221, cultured at 37°C in EZ rich defined medium supplemented with glycerol and increasing concentrations of l-rhamnose and aTc and GFP fluorescence measured at late exponential phase (5 h) by flow cytometry (white columns). Simulated steady-state output is overlayed to show model fit (blue X). (D) Experimentally-obtained coefficients of variation around the TetR-sfGFP mean when output is tuned using both l-rhamnose and aTc (white columns) with predicted coefficients of variation overlayed (red stars). Fluorescence intensity represents the geometric mean of fluorescence. Error bars shown represent the standard deviation of three independent biological replicates. Statistical significance was determined using a one-way ANOVA, followed by a Tukey's multiple comparison test assuming unequal variance.
Figure 4.
Figure 4.
Characterisation of a closed-loop negative sRNA feedback circuit. (A) Plasmids allowing the inducible expression of sRNAs targeting the Shine Dalgarno sequence (pAH15) or start codon (pAH16) of the rhaS-sfGFP mRNA were designed and constructed and the ability of each sRNA to inhibit translation assessed. E. coli strain JW3876 was transformed with pAH12 (constitutive expression of rhaS-sfGFP) and one of pAH15, pAH16 or pAH23 (negative control, no sRNA), cultured at 37°C in EZ rich defined medium supplemented with glycerol and 0.2 mg/ml l-rhamnose, and GFP fluorescence measured at late exponential phase (5 h) by flow cytometry. (B) The tunability of sRNA translation inhibition with increasing concentrations of l-rhamnose was tested. E. coli strain JW3876 was transformed with pCK222 (constitutive expression of rhaS-sfGFP and the PrhaBAD-SD sRNA construct), cultured at 37°C in EZ rich defined medium supplemented with glycerol and increasing concentrations of l-rhamnose, and GFP fluorescence measured at late exponential phase (5 h) by flow cytometry. (C) Schematic diagram of plasmid pCK227 where the proD promoter in front of rhaS-sfGFP on pCK222 (Supplementary Figure S12) is replaced by xylS and the Pm promoter from Pseudomonas putida. (D) Testing the ability to set the output level with one external input and the feedback strength with another external input. E. coli strain JW3876 was transformed with pCK227, cultured at 37°C in EZ rich defined medium supplemented with glycerol and increasing concentrations of l-rhamnose and m-toluic acid, and GFP fluorescence measured at late exponential phase (5 h) by flow cytometry (white columns). Simulated steady-state output is overlayed to test model fit (blue X). (E) Experimentally-obtained coefficients of variation around the TetR-sfGFP mean when output is tuned using both l-rhamnose and m-toluic acid (white columns) with predicted coefficients of variation overlayed (red stars). Fluorescence intensity represents the geometric mean of fluorescence. Error bars shown represent the standard deviation of three independent biological replicates. Statistical significance was determined using a one-way ANOVA, followed by a Tukey's multiple comparison test assuming unequal variance.
Figure 5.
Figure 5.
Dynamic simulations of models fitted to experimental data. (A) Simulation of step responses for the autorepressor without sRNA induction. The system's response time (black dots, defined as the point at which the output reaches 90% of its maximum value) increases as the system's input formula image is increased. (B) Simulation of the autorepressor with sRNA induction, demonstrating that sRNA tuning allows the same absolute output levels to be achieved without substantially changing response time. (C) Simulation of the closed-loop sRNA circuit without feedback ( formula image). (D) Simulation of the closed-loop sRNA circuit with feedback (formula image), demonstrating that feedback allows the system to achieve the same output levels with a shorter response time. (E) Demonstration of disturbance rejection for the closed-loop sRNA feedback circuit. A time-varying signal (sub-figure F) is applied to formula image such that formula image. When feedback is introduced by increasing formula imagethe system's sensitivity to an equivalent variation in formula imageis reduced. By tuning both inputs it is therefore possible to achieve a given output level while simultaneously reducing the effect of disturbances at one input.

Similar articles

Cited by

References

    1. Andrianantoandro E., Basu S., Karig D.K., Weiss R.. Synthetic biology: new engineering rules for an emerging discipline. Mol. Syst. Biol. 2006; 2:2006.0028. - PMC - PubMed
    1. Anderson J., Strelkowa N., Stan G.-B., Douglas T., Savulescu J., Barahona M., Papachristodoulou A.. Engineering and ethical perspectives in synthetic biology. Rigorous, robust and predictable designs, public engagement and a modern ethical framework are vital to the continued success of synthetic biology. EMBO Rep. 2012; 13:584–590. - PMC - PubMed
    1. Kwok R. Five hard truths for synthetic biology. Nature. 2010; 463:288–290. - PubMed
    1. Müller K.M., Arndt K.M.. Standardization in synthetic biology. Methods Mol. Biol. 2012; 813:23–43. - PubMed
    1. Canton B., Labno A., Endy D.. Refinement and standardization of synthetic biological parts and devices. Nat. Biotechnol. 2008; 26:787–793. - PubMed

Publication types

MeSH terms