. 2018 Nov 30;46(21):11502-11513.
doi: 10.1093/nar/gky817.

The RNA exosome contributes to gene expression regulation during stem cell differentiation

Affiliations

The RNA exosome contributes to gene expression regulation during stem cell differentiation

Marta Lloret-Llinares et al. Nucleic Acids Res. .

Abstract

Gene expression programs change during cellular transitions. It is well established that a network of transcription factors and chromatin modifiers regulate RNA levels during embryonic stem cell (ESC) differentiation, but the full impact of post-transcriptional processes remains elusive. While cytoplasmic RNA turnover mechanisms have been implicated in differentiation, the contribution of nuclear RNA decay has not been investigated. Here, we differentiate mouse ESCs, depleted for the ribonucleolytic RNA exosome, into embryoid bodies to determine to which degree RNA abundance in the two states can be attributed to changes in transcription versus RNA decay by the exosome. As a general observation, we find that exosome depletion mainly leads to the stabilization of RNAs from lowly transcribed loci, including several protein-coding genes. Depletion of the nuclear exosome cofactor RBM7 leads to similar effects. In particular, transcripts that are differentially expressed between states tend to be more exosome sensitive in the state where expression is low. We conclude that the RNA exosome contributes to down-regulation of transcripts with disparate expression, often in conjunction with transcriptional down-regulation.


Figures
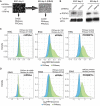
Figure 1.
Figure 1.
Effects of RRP40 depletion in ESCs and EBs. (A) Schematic representation of the experimental procedure and data collection. Scrambled control or RRP40-specific shRNAs were introduced using lentiviral vectors into ESCs, after which cells were differentiated into EB for 3 days. From each cell state and shRNA condition, CAGE, RNAseq and PROseq data were collected. The scale bar on the lower right corner of the images represents 100 μm (ESC) and 200 μm (EBd3). (B) Western blotting analysis of RRP40 levels in ESCs treated with the indicated shRNAs and differentiated for 0 (left) or 3 (right) days. Tubulin was used as a loading control. (C) Distributions (y-axis) of log2 fold changes (x-axis) between RNAseq (green) or PROseq (blue) values from RRP40-depleted versus control ESC samples. The RNA types measured and their numbers are indicated above each panel. The average of all replicates is shown. (D) As in (C) but for the EBd3 samples.
Figure 2.
Figure 2.
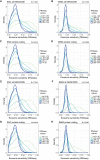
Transcripts from lowly expressed genes are preferentially exosome sensitive. (A and B) Distributions of RNA exosome sensitivities calculated from RNAseq data (see Methods) for RNAs from all GENCODE annotated genes, quintile-stratified based on their normalized PROseq values in control ESC (A) or EBd3 (B) cells. (C and D) As in (A and B) but for RNAs from GENCODE-annotated protein-coding genes only. (EH) Equivalent to panels (A–D) but with quintile-stratification based on normalized RNAseq values in the respective control samples. For all plots, the number of genes/RNAs (N) included is indicated above each panel. Quintiles are defined by the thresholds shown in the legends to the right of plots.
Figure 3.
Figure 3.
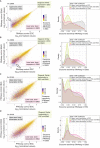
Transcripts tend to be exosome sensitive in the cell state where they are most lowly expressed. (A) Left panel: log10 normalized RNAseq values for RNAs from all GENCODE-annotated genes in control EBd3 (y-axis) and control ESC (x-axis) states, coloured according to their exosome sensitivity in the ESC state as calculated from RNAseq data (as shown on the legend to the right: purple denotes the most exosome-sensitive RNAs). The white arrow emphasizes particularly exosome-sensitive RNAs. The red dashed line marks equal expression levels between EBd3 and ESCs. Based on the red dashed lines, three regions of the plot were defined, indicated by callouts and grey dotted lines, which are further analyzed in the right panel: upper area (region above upper grey line, grey line in the right panel) contains transcripts with lower expression in ESCs; lower area (region below lower grey line, pink line in the right panel) contains transcripts with lower expression in EBd3; diagonal (region between grey lines, green line in the right panel) contains transcripts with similar expression in ESC and EBd3. Right panel: Densities of RRP40 sensitivity in ESCs for transcripts falling into the three areas defined in the left panel. (B) As in A, but with exosome sensitivity calculated from the EBd3 state. (C) As in A, but signals on x- and y-axes in the left panel are based on PROseq data. (D) As in C, but with exosome sensitivity calculated from the EBd3 state. For all plots, the number of genes/RNAs (N) included is indicated above each panel.
Figure 4.
Figure 4.
Contribution of transcription and exosome decay to RNA changes. (A) Scatter plot of log2 fold changes between RNAseq values of all GENCODE annotated genes in EBd3 versus ESC samples (y-axis) against log2 fold changes between PROseq values in EBd3 versus ESC samples (x-axis). Pearson's R square value is indicated. Red dashed lines indicate x = 0, y = 0 and y = x. (B) Same plot as in (A) but defining subsets of the data based on up- and down-regulation between EBd3 versus ESC, and whether RNAseq and PROseq value changes correlate positively (blues) or not (red-orange), as indicated by callouts. (C) Density plots of RNAseq-calculated exosome sensitivities from ESC (blue line) and EBd3 (red line), analyzing transcripts downregulated in ESC that have no correlation between RNAseq and PROseq changes (top-left quadrant from (B). (D) Density plots as in (C) but analyzing transcripts downregulated in ESC that have correlating RNAseq and PROseq changes (top-right quadrant from (B)). The number of genes/RNAs (N) included is indicated above each panel.
Figure 5.
Figure 5.
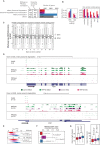
Defining the nature of RNA exosome targets. (A) Definition of gene/RNA classes. The left schematic shows the set of rules used for defining whether changes in RNA levels are mostly driven by transcription, exosome degradation or both. Only transcripts with an absolute log2 fold change of > 0.5 between ESCs and EBd3 were analyzed. Bar plots to the right show the numbers of genes/RNAs in each class. Note that bar colors were used consistently in Figure 5 to indicate the classes, only the ‘other’ class was not further analyzed. (B) Left panel: fractions of coding and non-coding genes/RNAs from the categories in (A). Right-panel: fractions of different types of non-coding genes/RNAs from the left panel. (C) RNAseq log2 fold changes between RRP40 depleted and control ESC samples along each exon (white) and intron (gray) of pre-mRNAs from the classes ‘mainly exosome degradation’ and ‘combination transcription and exosome degradation’ from (A). The number of transcripts analyzed (N) is indicated above the panel. (D) UCSC genome browser (60) examples of genes whose transcripts are downregulated in ESC (top, Prph locus) or EBd3 (bottom, Cish locus) samples, mainly due to exosome degradation. Genome browser tracks show, from top to bottom, signal intensities of CAGE, RNAseq and PROseq samples for each experimental condition on the relevant strand (as indicated by color). Numbers to the left indicate the scale for the respective data type. Bottom track shows GENCODE annotation. Arrow indicates the direction of transcription. The CAGE tracks show pooled data from the two replicates and the RNAseq and PROseq tracks show one of the replicates. (E) Distribution of RNAseq (top) and PROseq (bottom) average signals (normalized log2(TPM)) for RNAs in the classes from panel (A). P-values indicate results from Mann–Whitney two-sided tests between distributions. (F) Distributions of absolute log2(EBd3 versus ESC fold change) for RNAs in the classes from panel (A). P-values indicate results from Mann–Whitney two-sided tests between distributions. (G) Left panel: Distributions of gene lengths (log2(bp), including introns) (left). Right panel: exon count distributions for transcripts in the classes from panel (A), log2 scaled. P-values indicate results from Mann–Whitney two-sided tests between distributions.

Similar articles

Cited by

References

    1. Nichols J., Smith A.. Pluripotency in the embryo and in culture. Cold Spring Harb. Perspect. Biol. 2012; 4:a008128. - PMC - PubMed
    1. Young R.A. Control of the embryonic stem cell state. Cell. 2011; 144:940–954. - PMC - PubMed
    1. Kalkan T., Smith A.. Mapping the route from naive pluripotency to lineage specification. Philos. Trans. R. Soc. Lond., B, Biol. Sci. 2014; 369:20130540. - PMC - PubMed
    1. Huang G., Ye S., Zhou X., Liu D., Ying Q.-L.. Molecular basis of embryonic stem cell self-renewal: from signaling pathways to pluripotency network. Cell. Mol. Life Sci. 2015; 72:1741–1757. - PMC - PubMed
    1. Beck S., Lee B.-K., Kim J.. Multi-layered global gene regulation in mouse embryonic stem cells. Cell. Mol. Life Sci. 2015; 72:199–216. - PMC - PubMed

Publication types