. 2018 Nov 16;46(20):10757-10770.
doi: 10.1093/nar/gky829.

Snapshots of archaeal DNA replication and repair in living cells using super-resolution imaging

Affiliations

Snapshots of archaeal DNA replication and repair in living cells using super-resolution imaging

Floriane Delpech et al. Nucleic Acids Res. .

Abstract

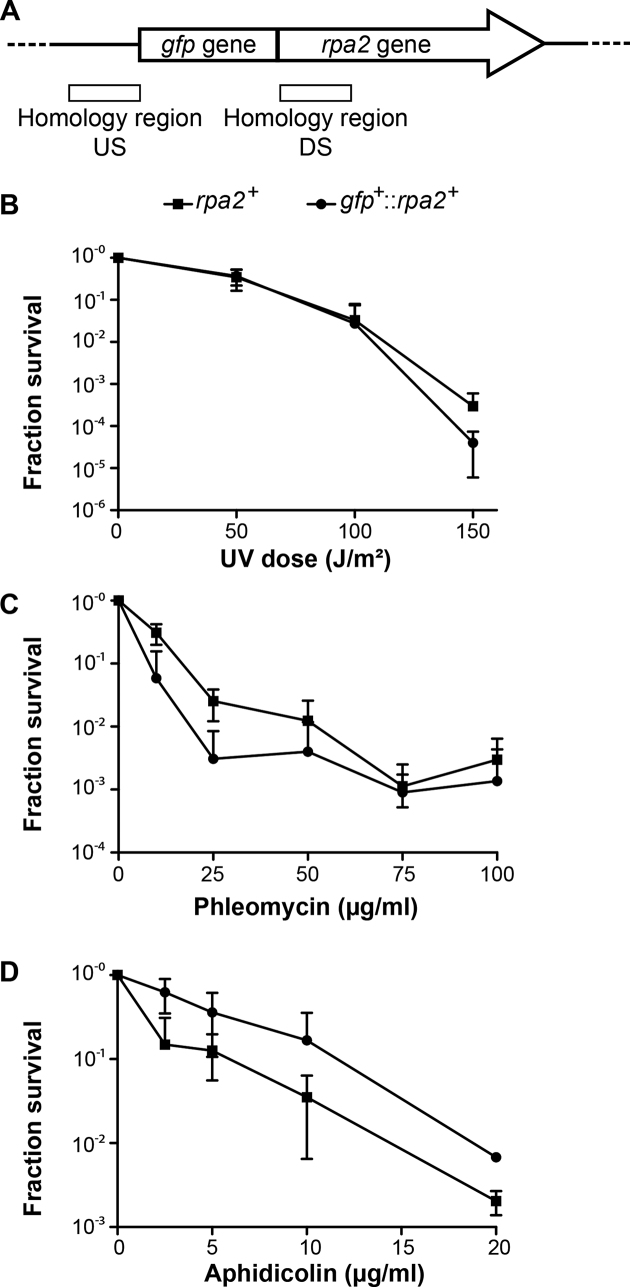
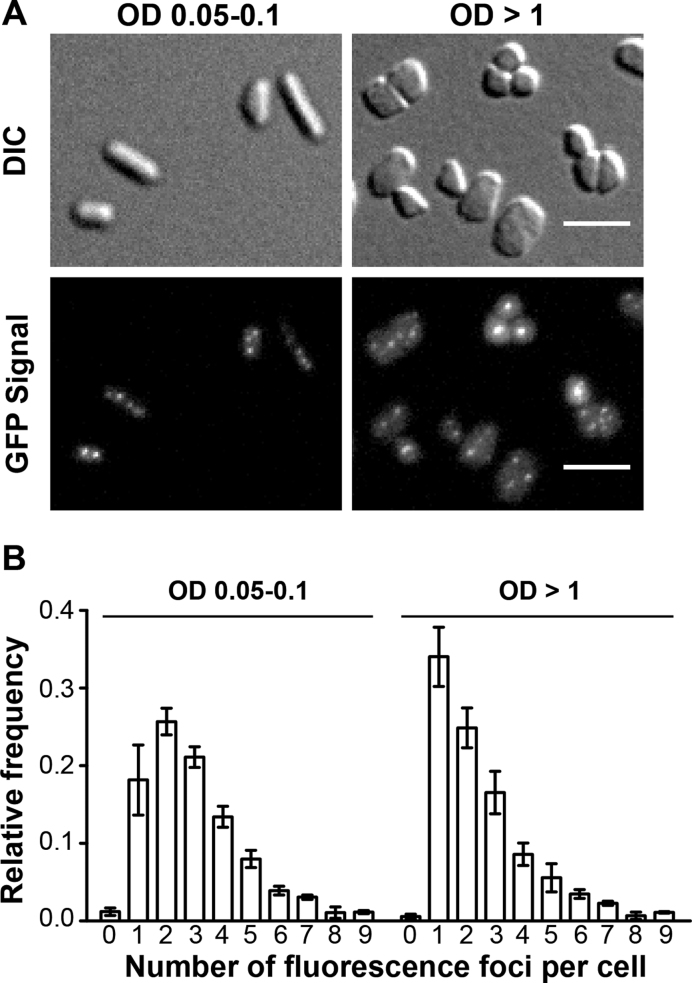
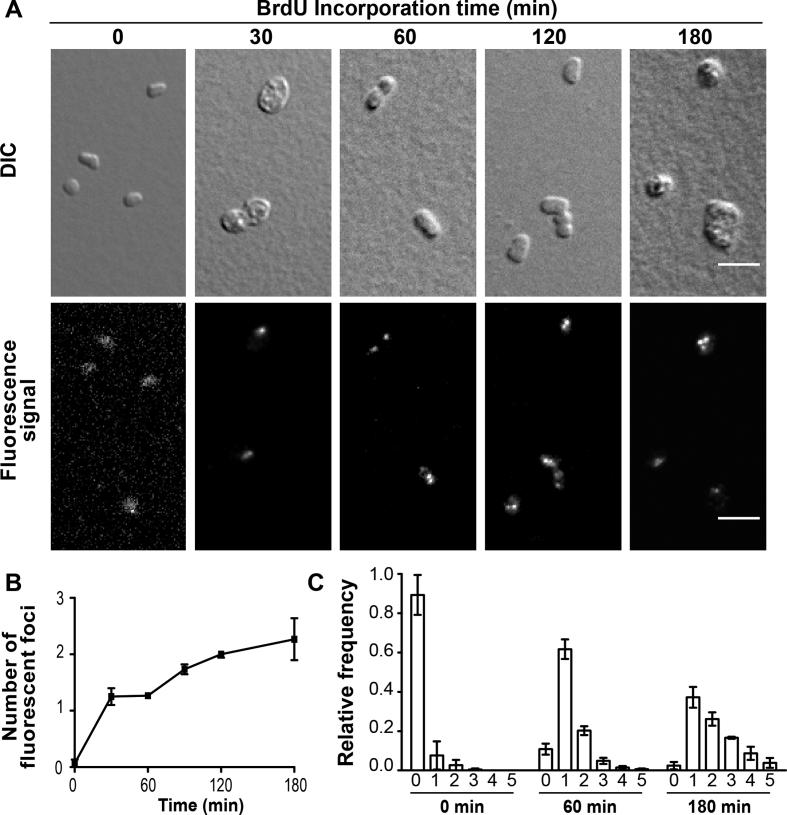
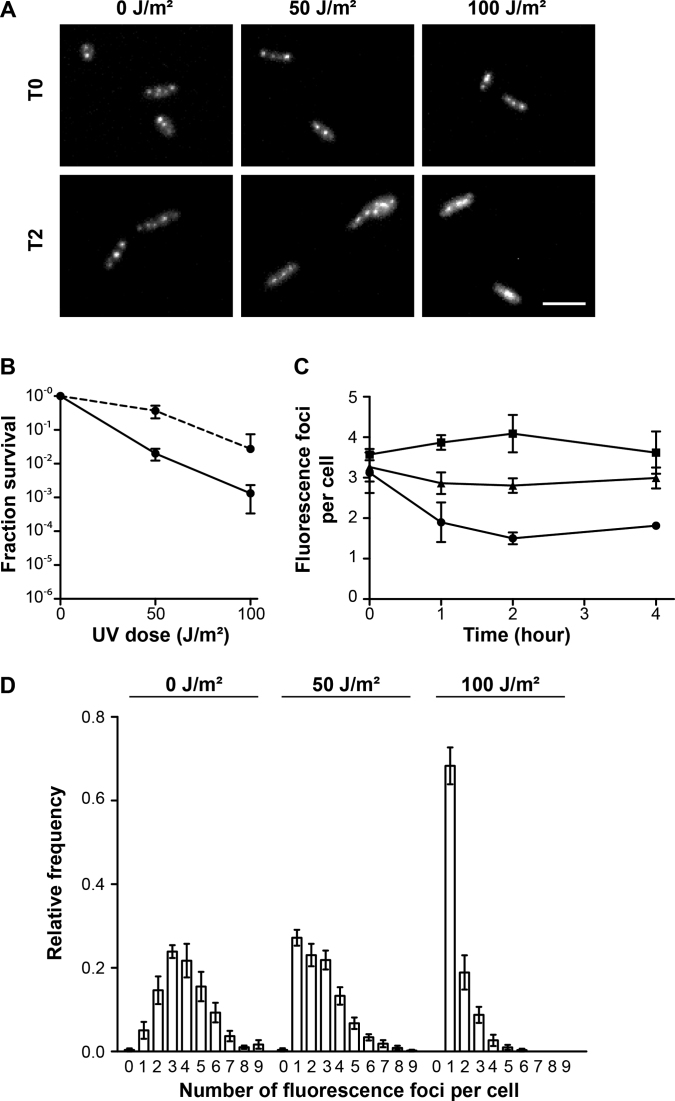
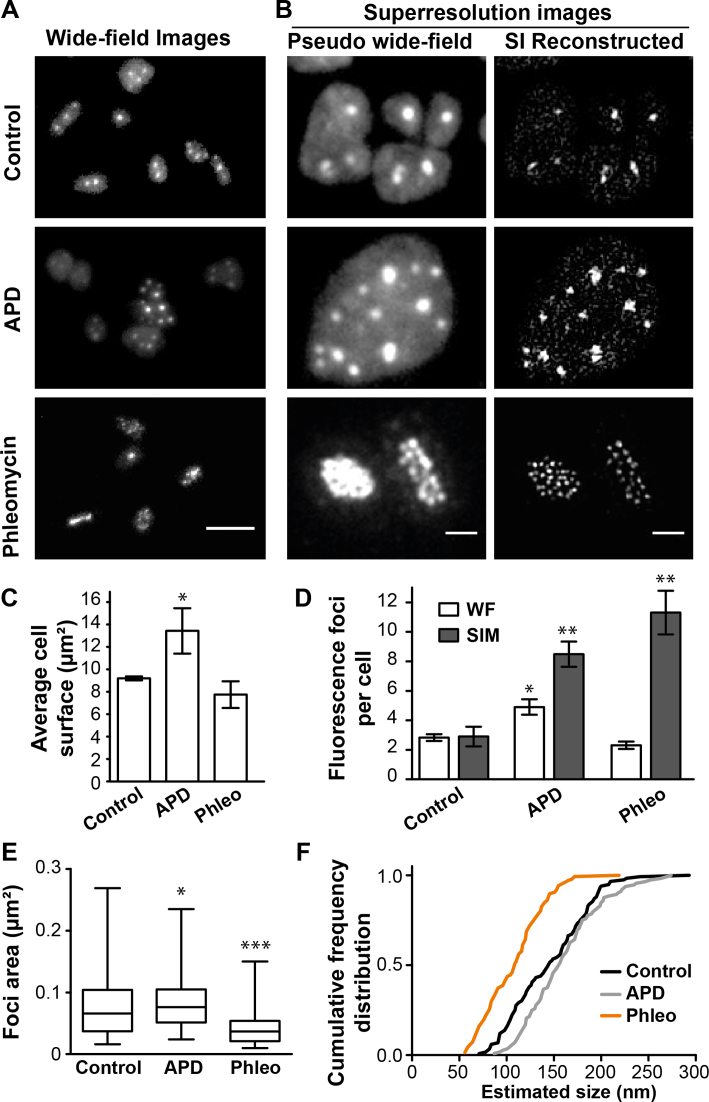
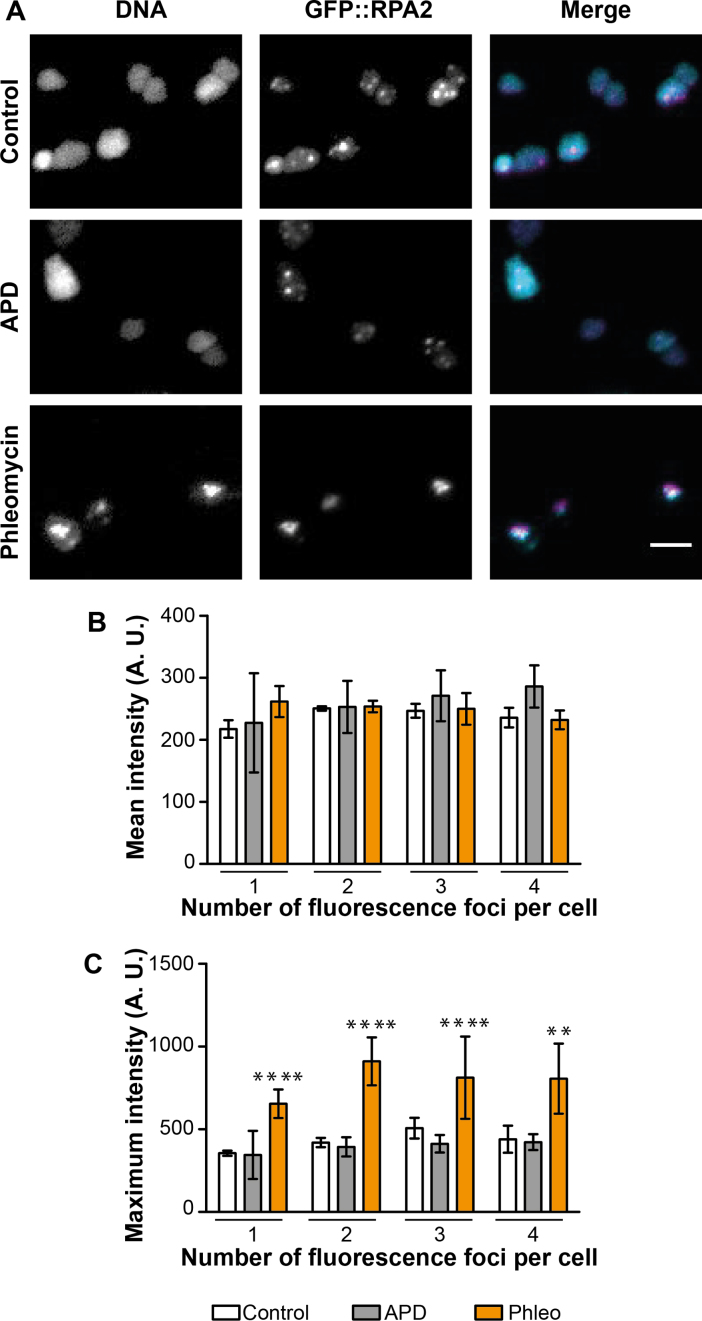
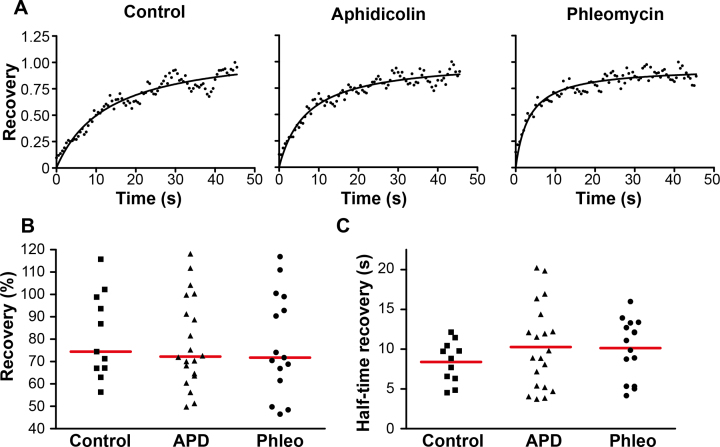
Using the haloarchaeon Haloferax volcanii as a model, we developed nascent DNA labeling and the functional GFP-labeled single-stranded binding protein RPA2 as novel tools to gain new insight into DNA replication and repair in live haloarchaeal cells. Our quantitative fluorescence microscopy data revealed that RPA2 forms distinct replication structures that dynamically responded to replication stress and DNA damaging agents. The number of the RPA2 foci per cell followed a probabilistic Poisson distribution, implying hitherto unnoticed stochastic cell-to-cell variation in haloarchaeal DNA replication and repair processes. The size range of haloarchaeal replication structures is very similar to those observed earlier in eukaryotic cells. The improved lateral resolution of 3D-SIM fluorescence microscopy allowed proposing that inhibition of DNA synthesis results in localized replication foci clustering and facilitated observation of RPA2 complexes brought about by chemical agents creating DNA double-strand breaks. Altogether our in vivo observations are compatible with earlier in vitro studies on archaeal single-stranded DNA binding proteins. Our work thus underlines the great potential of live cell imaging for unraveling the dynamic nature of transient molecular interactions that underpin fundamental molecular processes in the Third domain of life.


Figures

Figure 1.
Figure 1.
gfp-fused rpa2 allele construction and functional characterization. (A) Representation of the chromosomal locus of the gfp+::rpa2+ allele. The regions of homology between the plasmid and the chromosome used for pop-in/pop-out gene replacement are represented by white boxes [Up-Stream (US) and Down-Stream (DS) regions]. Surviving fractions for rpa2+ (▪) and gfp+::rpa2+ cells (•) in response to (B) increasing doses of UV irradiation, (C) increasing concentrations of phleomycin and (D) increasing concentrations of aphidicolin. Error bars represent standard deviations of at least three independent experiments.
Figure 2.
Figure 2.
In vivo localization of GFP-labeled RPA2 under normal growth condition. A total of 391 cells at OD 0.05–0.1 and 1597 cells at OD >1 were analyzed. (A) Images of DIC and GFP signal of gfp+::rpa2+ cells at OD 0.05–0.1 and at OD >1 are indicated. A scale bar equals 5 μm. (B) Relative frequency of number of foci per individual cell is shown. Error bars represent standard deviations of at least three independent experiments.
Figure 3.
Figure 3.
Intracellular localization of nascent DNA. A total number of 163 cells were analyzed at the starting time point of BrdU incorporation, 139 after 30 min, 281 after 60 min, 951 after 120 min and 260 after 180 min. (A) DIC images and Alexa 488 signal of anti-BrdU antibody of Δhts ΔhdrB cells grown in rich media containing 100 μM BrdU. A scale bar equals 5 μm. (B) Mean number of nascent DNA foci formed observed using BrdU labeling and immunodetection of fixed cells. (C) Relative frequency of number of nascent DNA foci per individual cell. Error bars represent standard deviations of at least three independent experiments.
Figure 4.
Figure 4.
In vivo localization of GFP-labeled RPA2 after UV irradiation. A total of 391 cells at OD 0.05–0.1 and 1597 cells at OD >1 were analyzed. (A) Images of GFP signal of gfp+::rpa2+ cells unirradiated (0 J/m²) or after 50 and 100 J/m² UV irradiation, without recovery (T0) and after two hours recovery (T2). A scale bar is equal to 5 μm. (B) Surviving fractions of gfp+::rpa2+ cells in response to increasing doses of UV irradiation performed on plated cells (dotted line, as in Figure 1B) and in liquid cultures (continuous line). (C) The average number of fluorescence foci per cell as a function of time in unirradiated cells (▪) and after 50 (▴) and 100 J/m² (•) UV irradiation. (D) Relative frequency of number of foci per individual cell after 2 h recovery. Error bars represent standard deviations of at least three independent experiments.
Figure 5.
Figure 5.
In vivo localization of GFP-labeled RPA2 using SIM microscopy. A total of 144 control cells, 75 cells exposed to 5 μg/ml aphidicolin, and 116 cells exposed to 100 μg/ml phleomycin, were analyzed. (A) Images of GFP signal of gfp+::rpa2+ cells using wide-field microscopy. Bar equals 5 μm. (B) Images for each condition of GFP signal of gfp+::rpa2+ cells using SIM microscopy, comparing pseudo-wide field (PWF) image with the image obtained after SIM reconstruction. Bar equals 1 μm. (C) Average cell surface. (D) Mean number of GFP-RPA2 labeled fluorescence foci obtained when analyzing PWF images (light histograms) and SIM images (grey histograms). (E) Foci area measured on images after SIM reconstruction. A total of 116 foci were analyzed for control cells, 112 for cells exposed to aphidicolin and 140 for cells exposed to phleomycin. (F) Cumulative frequency distribution of the foci size estimates approximated as circles. Error bars represent standard deviations of at least three independent experiments. Unpaired t-test with Welch's correction were performed in comparison to control cells. ***Significantly different, P < 0.001; **Significantly different, P < 0.01; *Significantly different, P < 0.05.
Figure 6.
Figure 6.
In vivo localization of Hoechst-labeled DNA and GFP-labeled RPA2 using wide-field microscopy. A total of 274 control cells, 159 cells exposed to 5 μg/ml aphidicolin, and 389 cells exposed to 100 μg/ml phleomycin, were analyzed. (A) Images for each condition of the Hoechst-labeled DNA, the GFP signal and the merge image of the DNA signal in cyan and the GFP signal in magenta. Bar equals 5 μm. (B) Mean intensity (A.U.) and (C) Maximum intensity (A.U.) of the Hoechst-labeled DNA signal in cells depending on the individual number of GFP::RPA2 foci. Light histograms correspond to control cells, grey ones to aphidicolin-treated cells and orange ones to phleomycin-treated cells. Error bars represent standard deviations of at least three independent experiments. Unpaired t-test with Welch's correction were performed in comparison to control cells. ****Significantly different, P < 0.0001; **Significantly different, P < 0.01.
Figure 7.
Figure 7.
Dynamic localization of GFP-labeled RPA2 molecules at fluorescence foci. A total of 11 control cells, 20 aphidicolin-treated cells and 14 phleomycin-treated cells were analyzed. (A) Representative fluorescence recovery measurement (dots) after photobleaching, and the corresponding fitted curve (black line), for each condition. (B) Percentage of recovery reached. (C) Half-time recovery (s) calculated from the fitted curves. Data for each cell are represented, and the red lines correspond to the means. Unpaired t-test with Welch's correction were performed in comparison to control cells and concluded to no significant differences.

Similar articles

Cited by

References

    1. Myllykallio H., Lopez P., Lopez-Garcia P., Heilig R., Saurin W., Zivanovic Y., Philippe H., Forterre P.. Bacterial mode of replication with eukaryotic-like machinery in a hyperthermophilic archaeon. Science. 2000; 288:2212–2215. - PubMed
    1. Robinson N.P., Dionne I., Lundgren M., Marsh V.L., Bernander R., Bell S.D.. Identification of two origins of replication in the single chromosome of the archaeon Sulfolobus solfataricus. Cell. 2004; 116:25–38. - PubMed
    1. Edgell D.R., Doolittle W.F.. Archaea and the origin(s) of DNA replication proteins. Cell. 1997; 89:995–998. - PubMed
    1. Matsunaga F., Norais C., Forterre P., Myllykallio H.. Identification of short ‘eukaryotic’ Okazaki fragments synthesized from a prokaryotic replication origin. EMBO Rep. 2003; 4:154–158. - PMC - PubMed
    1. Jensen R.B., Wang S.C., Shapiro L.. A moving DNA replication factory in Caulobacter crescentus. EMBO J. 2001; 20:4952–4963. - PMC - PubMed

Publication types

MeSH terms

LinkOut - more resources